Cities with the Most Immigrants from Belarus in Illinois
RELATED REPORTS & OPTIONS
Belarus
Illinois
Compare Cities
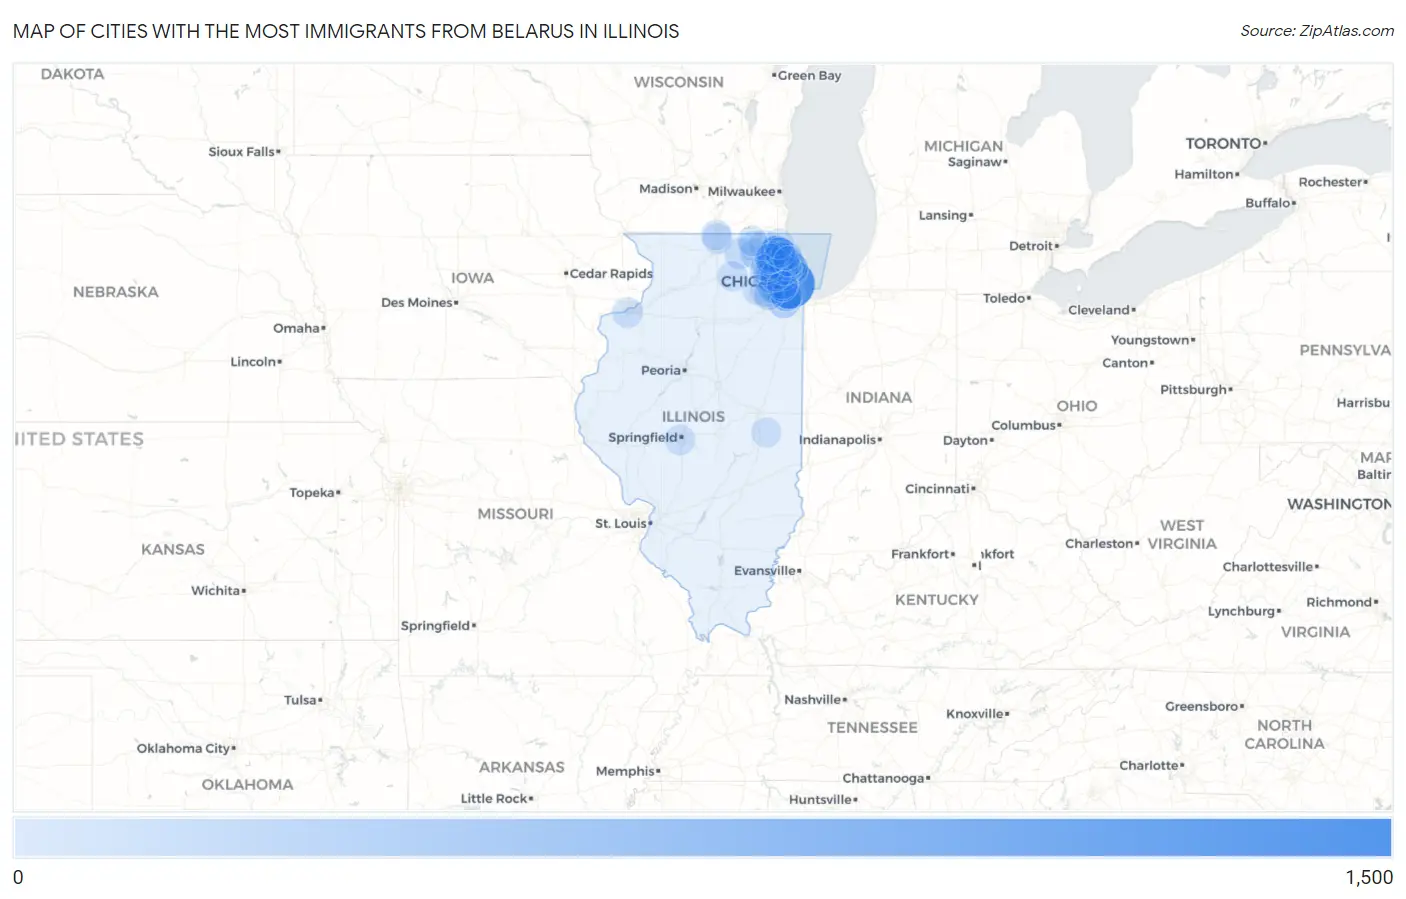
Map of Cities with the Most Immigrants from Belarus in Illinois
0
1,500
Cities with the Most Immigrants from Belarus in Illinois
| City | Belarus | vs State | vs National | |
| 1. | Chicago | 1,309 | 6,186(21.16%)#1 | 71,687(1.83%)#4 |
| 2. | Buffalo Grove | 826 | 6,186(13.35%)#2 | 71,687(1.15%)#5 |
| 3. | Arlington Heights | 602 | 6,186(9.73%)#3 | 71,687(0.84%)#6 |
| 4. | Wheeling | 538 | 6,186(8.70%)#4 | 71,687(0.75%)#8 |
| 5. | Skokie | 388 | 6,186(6.27%)#5 | 71,687(0.54%)#14 |
| 6. | Vernon Hills | 363 | 6,186(5.87%)#6 | 71,687(0.51%)#17 |
| 7. | Orland Park | 234 | 6,186(3.78%)#7 | 71,687(0.33%)#34 |
| 8. | Des Plaines | 210 | 6,186(3.39%)#8 | 71,687(0.29%)#36 |
| 9. | Westmont | 124 | 6,186(2.00%)#9 | 71,687(0.17%)#72 |
| 10. | Worth | 114 | 6,186(1.84%)#10 | 71,687(0.16%)#83 |
| 11. | Downers Grove | 83 | 6,186(1.34%)#11 | 71,687(0.12%)#128 |
| 12. | Highland Park | 79 | 6,186(1.28%)#12 | 71,687(0.11%)#136 |
| 13. | Naperville | 70 | 6,186(1.13%)#13 | 71,687(0.10%)#160 |
| 14. | Wilmette | 62 | 6,186(1.00%)#14 | 71,687(0.09%)#189 |
| 15. | Glendale Heights | 53 | 6,186(0.86%)#15 | 71,687(0.07%)#225 |
| 16. | Schiller Park | 50 | 6,186(0.81%)#16 | 71,687(0.07%)#235 |
| 17. | Deerfield | 49 | 6,186(0.79%)#17 | 71,687(0.07%)#241 |
| 18. | Niles | 47 | 6,186(0.76%)#18 | 71,687(0.07%)#253 |
| 19. | Lake Zurich | 44 | 6,186(0.71%)#19 | 71,687(0.06%)#271 |
| 20. | Mundelein | 42 | 6,186(0.68%)#20 | 71,687(0.06%)#285 |
| 21. | Prospect Heights | 42 | 6,186(0.68%)#21 | 71,687(0.06%)#290 |
| 22. | Rock Island | 38 | 6,186(0.61%)#22 | 71,687(0.05%)#316 |
| 23. | Marengo | 38 | 6,186(0.61%)#23 | 71,687(0.05%)#318 |
| 24. | Bensenville | 35 | 6,186(0.57%)#24 | 71,687(0.05%)#334 |
| 25. | Evanston | 34 | 6,186(0.55%)#25 | 71,687(0.05%)#340 |
| 26. | Morton Grove | 33 | 6,186(0.53%)#26 | 71,687(0.05%)#355 |
| 27. | Mount Prospect | 32 | 6,186(0.52%)#27 | 71,687(0.04%)#361 |
| 28. | Palos Heights | 32 | 6,186(0.52%)#28 | 71,687(0.04%)#370 |
| 29. | Glenview | 31 | 6,186(0.50%)#29 | 71,687(0.04%)#372 |
| 30. | Oak Lawn | 30 | 6,186(0.48%)#30 | 71,687(0.04%)#384 |
| 31. | Palatine | 29 | 6,186(0.47%)#31 | 71,687(0.04%)#394 |
| 32. | Northbrook | 29 | 6,186(0.47%)#32 | 71,687(0.04%)#396 |
| 33. | Riverwoods | 29 | 6,186(0.47%)#33 | 71,687(0.04%)#405 |
| 34. | Roscoe | 27 | 6,186(0.44%)#34 | 71,687(0.04%)#431 |
| 35. | Wood Dale | 24 | 6,186(0.39%)#35 | 71,687(0.03%)#467 |
| 36. | Schaumburg | 23 | 6,186(0.37%)#36 | 71,687(0.03%)#476 |
| 37. | La Grange Park | 23 | 6,186(0.37%)#37 | 71,687(0.03%)#486 |
| 38. | Dekalb | 22 | 6,186(0.36%)#38 | 71,687(0.03%)#503 |
| 39. | Long Grove | 20 | 6,186(0.32%)#39 | 71,687(0.03%)#545 |
| 40. | Springfield | 19 | 6,186(0.31%)#40 | 71,687(0.03%)#551 |
| 41. | Crystal Lake | 17 | 6,186(0.27%)#41 | 71,687(0.02%)#585 |
| 42. | Carol Stream | 17 | 6,186(0.27%)#42 | 71,687(0.02%)#586 |
| 43. | Streamwood | 15 | 6,186(0.24%)#43 | 71,687(0.02%)#634 |
| 44. | Aurora | 13 | 6,186(0.21%)#44 | 71,687(0.02%)#669 |
| 45. | Bolingbrook | 13 | 6,186(0.21%)#45 | 71,687(0.02%)#674 |
| 46. | South Beloit | 13 | 6,186(0.21%)#46 | 71,687(0.02%)#695 |
| 47. | Addison | 12 | 6,186(0.19%)#47 | 71,687(0.02%)#708 |
| 48. | Bull Valley | 12 | 6,186(0.19%)#48 | 71,687(0.02%)#731 |
| 49. | Hoffman Estates | 10 | 6,186(0.16%)#49 | 71,687(0.01%)#756 |
| 50. | Park Ridge | 9 | 6,186(0.15%)#50 | 71,687(0.01%)#785 |
| 51. | La Grange | 9 | 6,186(0.15%)#51 | 71,687(0.01%)#795 |
| 52. | Kildeer | 9 | 6,186(0.15%)#52 | 71,687(0.01%)#804 |
| 53. | Lakemoor | 8 | 6,186(0.13%)#53 | 71,687(0.01%)#828 |
| 54. | Libertyville | 7 | 6,186(0.11%)#54 | 71,687(0.01%)#850 |
| 55. | Highwood | 7 | 6,186(0.11%)#55 | 71,687(0.01%)#864 |
| 56. | Deer Park | 7 | 6,186(0.11%)#56 | 71,687(0.01%)#866 |
| 57. | Gurnee | 6 | 6,186(0.10%)#57 | 71,687(0.01%)#881 |
| 58. | Villa Grove | 6 | 6,186(0.10%)#58 | 71,687(0.01%)#894 |
| 59. | Mettawa | 5 | 6,186(0.08%)#59 | 71,687(0.01%)#916 |
| 60. | Glencoe | 3 | 6,186(0.05%)#60 | 71,687(0.00%)#939 |
| 61. | Greenwood | 1 | 6,186(0.02%)#61 | 71,687(0.00%)#970 |
Common Questions
What are the Top 10 Cities with the Most Immigrants from Belarus in Illinois?
Top 10 Cities with the Most Immigrants from Belarus in Illinois are:
#1
1,309
#2
826
#3
602
#4
538
#5
388
#6
363
#7
234
#8
210
#9
124
#10
114
What city has the Most Immigrants from Belarus in Illinois?
Chicago has the Most Immigrants from Belarus in Illinois with 1,309.
What is the Total Immigrants from Belarus in the State of Illinois?
Total Immigrants from Belarus in Illinois is 6,186.
What is the Total Immigrants from Belarus in the United States?
Total Immigrants from Belarus in the United States is 71,687.