Cities with the Highest Percentage of Immigrants from Taiwan in Illinois
RELATED REPORTS & OPTIONS
Taiwan
Illinois
Compare Cities
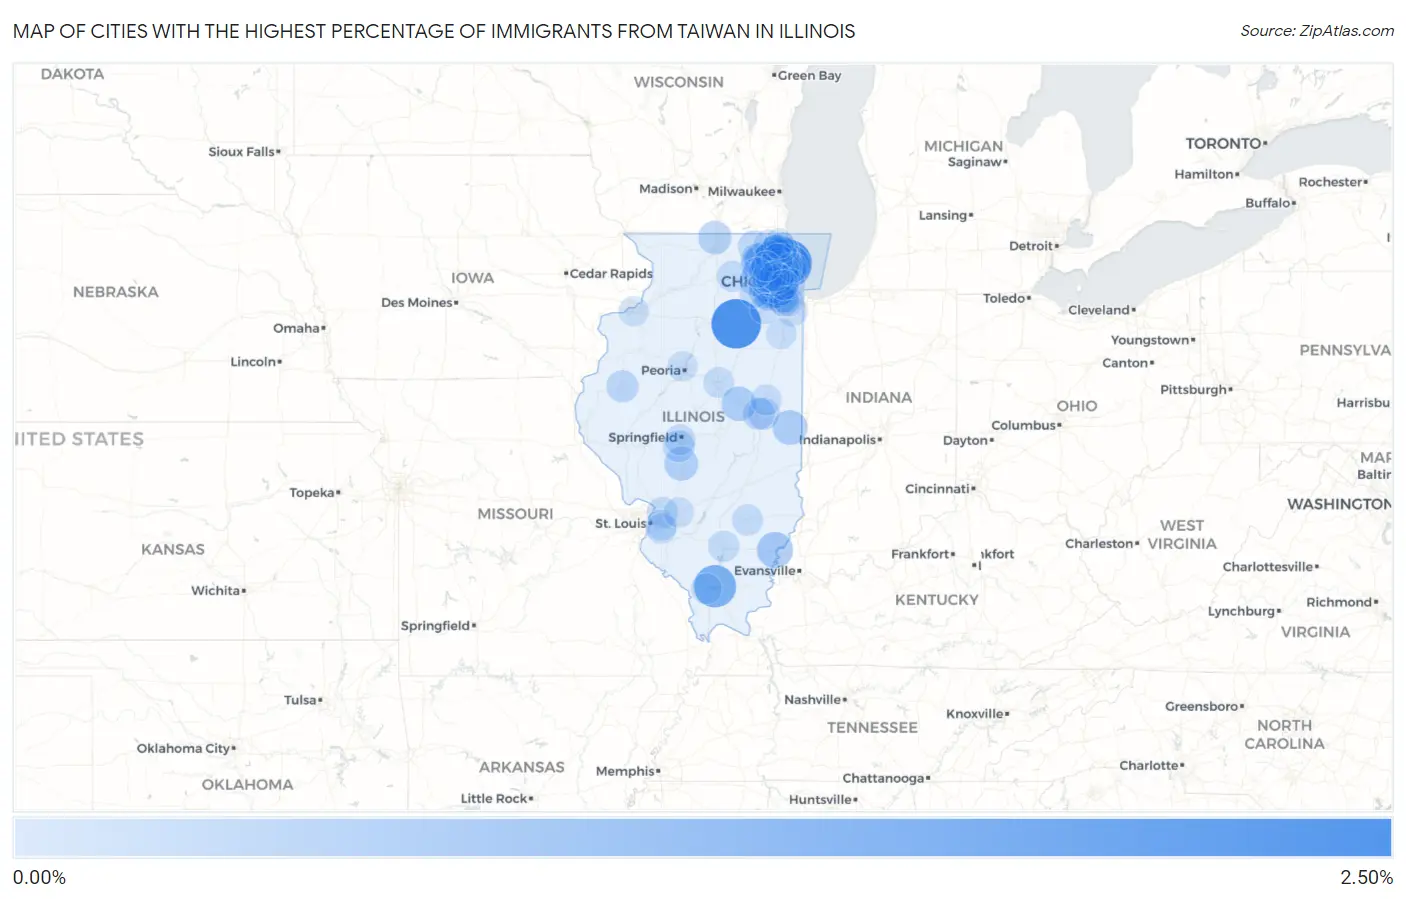
Map of Cities with the Highest Percentage of Immigrants from Taiwan in Illinois
0.00%
2.50%
Cities with the Highest Percentage of Immigrants from Taiwan in Illinois
| City | Taiwan | vs State | vs National | |
| 1. | Marseilles | 2.12% | 0.065%(+2.05)#1 | 0.11%(+2.00)#85 |
| 2. | Northfield | 2.03% | 0.065%(+1.97)#2 | 0.11%(+1.92)#92 |
| 3. | Crainville | 1.32% | 0.065%(+1.26)#3 | 0.11%(+1.21)#161 |
| 4. | Wilmette | 1.15% | 0.065%(+1.08)#4 | 0.11%(+1.03)#194 |
| 5. | Oak Brook | 1.09% | 0.065%(+1.03)#5 | 0.11%(+0.977)#208 |
| 6. | Westmont | 1.05% | 0.065%(+0.986)#6 | 0.11%(+0.937)#221 |
| 7. | Barrington Hills | 0.93% | 0.065%(+0.861)#7 | 0.11%(+0.812)#265 |
| 8. | Vernon Hills | 0.92% | 0.065%(+0.855)#8 | 0.11%(+0.806)#269 |
| 9. | Hinsdale | 0.91% | 0.065%(+0.850)#9 | 0.11%(+0.801)#274 |
| 10. | Long Grove | 0.71% | 0.065%(+0.648)#10 | 0.11%(+0.599)#368 |
| 11. | Grayville | 0.65% | 0.065%(+0.584)#11 | 0.11%(+0.535)#419 |
| 12. | South Barrington | 0.58% | 0.065%(+0.515)#12 | 0.11%(+0.466)#471 |
| 13. | Lisle | 0.57% | 0.065%(+0.506)#13 | 0.11%(+0.457)#480 |
| 14. | Kildeer | 0.56% | 0.065%(+0.492)#14 | 0.11%(+0.443)#496 |
| 15. | Glenview | 0.52% | 0.065%(+0.455)#15 | 0.11%(+0.406)#528 |
| 16. | Indianola | 0.51% | 0.065%(+0.443)#16 | 0.11%(+0.394)#547 |
| 17. | Northbrook | 0.49% | 0.065%(+0.425)#17 | 0.11%(+0.376)#568 |
| 18. | Farmer City | 0.48% | 0.065%(+0.419)#18 | 0.11%(+0.370)#573 |
| 19. | Clarendon Hills | 0.47% | 0.065%(+0.409)#19 | 0.11%(+0.360)#589 |
| 20. | Lincolnshire | 0.47% | 0.065%(+0.403)#20 | 0.11%(+0.354)#597 |
| 21. | Farmersville | 0.42% | 0.065%(+0.354)#21 | 0.11%(+0.305)#659 |
| 22. | Naperville | 0.41% | 0.065%(+0.348)#22 | 0.11%(+0.299)#671 |
| 23. | Palos Park | 0.37% | 0.065%(+0.308)#23 | 0.11%(+0.259)#740 |
| 24. | Darien | 0.36% | 0.065%(+0.300)#24 | 0.11%(+0.251)#751 |
| 25. | Rockton | 0.35% | 0.065%(+0.287)#25 | 0.11%(+0.238)#770 |
| 26. | Palatine | 0.34% | 0.065%(+0.278)#26 | 0.11%(+0.228)#787 |
| 27. | Geneva | 0.34% | 0.065%(+0.272)#27 | 0.11%(+0.223)#796 |
| 28. | Mettawa | 0.33% | 0.065%(+0.268)#28 | 0.11%(+0.219)#806 |
| 29. | West Dundee | 0.32% | 0.065%(+0.254)#29 | 0.11%(+0.205)#831 |
| 30. | Bloomingdale | 0.30% | 0.065%(+0.239)#30 | 0.11%(+0.189)#875 |
| 31. | Deer Park | 0.30% | 0.065%(+0.233)#31 | 0.11%(+0.184)#884 |
| 32. | Oakbrook Terrace | 0.30% | 0.065%(+0.232)#32 | 0.11%(+0.183)#888 |
| 33. | Itasca | 0.28% | 0.065%(+0.216)#33 | 0.11%(+0.167)#928 |
| 34. | Warrenville | 0.28% | 0.065%(+0.215)#34 | 0.11%(+0.166)#929 |
| 35. | Roselle | 0.26% | 0.065%(+0.194)#35 | 0.11%(+0.145)#984 |
| 36. | Woodridge | 0.26% | 0.065%(+0.191)#36 | 0.11%(+0.142)#994 |
| 37. | Palos Heights | 0.24% | 0.065%(+0.178)#37 | 0.11%(+0.129)#1,035 |
| 38. | Macomb | 0.24% | 0.065%(+0.172)#38 | 0.11%(+0.123)#1,050 |
| 39. | Barrington | 0.22% | 0.065%(+0.158)#39 | 0.11%(+0.109)#1,092 |
| 40. | Urbana | 0.22% | 0.065%(+0.155)#40 | 0.11%(+0.106)#1,108 |
| 41. | Champaign | 0.21% | 0.065%(+0.149)#41 | 0.11%(+0.100)#1,117 |
| 42. | Chatham | 0.21% | 0.065%(+0.143)#42 | 0.11%(+0.094)#1,133 |
| 43. | Lake Forest | 0.21% | 0.065%(+0.141)#43 | 0.11%(+0.092)#1,143 |
| 44. | Bolingbrook | 0.19% | 0.065%(+0.123)#44 | 0.11%(+0.073)#1,219 |
| 45. | Downers Grove | 0.17% | 0.065%(+0.109)#45 | 0.11%(+0.060)#1,278 |
| 46. | Schiller Park | 0.17% | 0.065%(+0.108)#46 | 0.11%(+0.059)#1,284 |
| 47. | Bull Valley | 0.16% | 0.065%(+0.096)#47 | 0.11%(+0.047)#1,329 |
| 48. | Skokie | 0.16% | 0.065%(+0.093)#48 | 0.11%(+0.044)#1,344 |
| 49. | Dekalb | 0.15% | 0.065%(+0.090)#49 | 0.11%(+0.041)#1,356 |
| 50. | Glen Carbon | 0.15% | 0.065%(+0.089)#50 | 0.11%(+0.040)#1,364 |
| 51. | Arlington Heights | 0.15% | 0.065%(+0.087)#51 | 0.11%(+0.037)#1,385 |
| 52. | Mundelein | 0.15% | 0.065%(+0.084)#52 | 0.11%(+0.035)#1,394 |
| 53. | Wheaton | 0.14% | 0.065%(+0.075)#53 | 0.11%(+0.026)#1,446 |
| 54. | Mount Vernon | 0.14% | 0.065%(+0.071)#54 | 0.11%(+0.022)#1,464 |
| 55. | Lombard | 0.13% | 0.065%(+0.069)#55 | 0.11%(+0.020)#1,472 |
| 56. | Flora | 0.13% | 0.065%(+0.063)#56 | 0.11%(+0.014)#1,505 |
| 57. | Norridge | 0.12% | 0.065%(+0.060)#57 | 0.11%(+0.011)#1,527 |
| 58. | Rantoul | 0.12% | 0.065%(+0.055)#58 | 0.11%(+0.006)#1,548 |
| 59. | Morton Grove | 0.12% | 0.065%(+0.052)#59 | 0.11%(+0.003)#1,564 |
| 60. | Montgomery | 0.12% | 0.065%(+0.052)#60 | 0.11%(+0.003)#1,566 |
| 61. | Deerfield | 0.11% | 0.065%(+0.050)#61 | 0.11%(+0.001)#1,580 |
| 62. | Schaumburg | 0.11% | 0.065%(+0.048)#62 | 0.11%(-0.002)#1,600 |
| 63. | Algonquin | 0.11% | 0.065%(+0.046)#63 | 0.11%(-0.003)#1,611 |
| 64. | Springfield | 0.11% | 0.065%(+0.046)#64 | 0.11%(-0.003)#1,613 |
| 65. | Carbondale | 0.10% | 0.065%(+0.040)#65 | 0.11%(-0.009)#1,639 |
| 66. | Mount Prospect | 0.10% | 0.065%(+0.039)#66 | 0.11%(-0.010)#1,644 |
| 67. | Normal | 0.10% | 0.065%(+0.037)#67 | 0.11%(-0.012)#1,654 |
| 68. | Winfield | 0.10% | 0.065%(+0.036)#68 | 0.11%(-0.013)#1,662 |
| 69. | Streamwood | 0.096% | 0.065%(+0.032)#69 | 0.11%(-0.018)#1,695 |
| 70. | River Forest | 0.095% | 0.065%(+0.031)#70 | 0.11%(-0.019)#1,707 |
| 71. | Bartlett | 0.093% | 0.065%(+0.029)#71 | 0.11%(-0.021)#1,722 |
| 72. | Fairview Heights | 0.092% | 0.065%(+0.027)#72 | 0.11%(-0.022)#1,731 |
| 73. | Park Ridge | 0.091% | 0.065%(+0.027)#73 | 0.11%(-0.022)#1,734 |
| 74. | Western Springs | 0.081% | 0.065%(+0.017)#74 | 0.11%(-0.033)#1,816 |
| 75. | Park Forest | 0.076% | 0.065%(+0.011)#75 | 0.11%(-0.038)#1,853 |
| 76. | Swansea | 0.074% | 0.065%(+0.009)#76 | 0.11%(-0.040)#1,869 |
| 77. | Burr Ridge | 0.072% | 0.065%(+0.007)#77 | 0.11%(-0.042)#1,876 |
| 78. | Bourbonnais | 0.072% | 0.065%(+0.007)#78 | 0.11%(-0.042)#1,881 |
| 79. | Highland | 0.069% | 0.065%(+0.004)#79 | 0.11%(-0.045)#1,903 |
| 80. | Chicago | 0.068% | 0.065%(+0.003)#80 | 0.11%(-0.046)#1,908 |
| 81. | Glen Ellyn | 0.067% | 0.065%(+0.003)#81 | 0.11%(-0.047)#1,914 |
| 82. | Libertyville | 0.063% | 0.065%(-0.001)#82 | 0.11%(-0.050)#1,951 |
| 83. | Glendale Heights | 0.060% | 0.065%(-0.004)#83 | 0.11%(-0.053)#1,985 |
| 84. | Lake Zurich | 0.056% | 0.065%(-0.009)#84 | 0.11%(-0.058)#2,040 |
| 85. | Joliet | 0.055% | 0.065%(-0.010)#85 | 0.11%(-0.059)#2,054 |
| 86. | Round Lake | 0.054% | 0.065%(-0.011)#86 | 0.11%(-0.060)#2,071 |
| 87. | Orland Park | 0.053% | 0.065%(-0.011)#87 | 0.11%(-0.061)#2,081 |
| 88. | Evanston | 0.053% | 0.065%(-0.011)#88 | 0.11%(-0.061)#2,082 |
| 89. | North Chicago | 0.052% | 0.065%(-0.013)#89 | 0.11%(-0.062)#2,096 |
| 90. | Moline | 0.049% | 0.065%(-0.015)#90 | 0.11%(-0.064)#2,124 |
| 91. | Buffalo Grove | 0.049% | 0.065%(-0.016)#91 | 0.11%(-0.065)#2,129 |
| 92. | Gurnee | 0.046% | 0.065%(-0.019)#92 | 0.11%(-0.068)#2,179 |
| 93. | Elmhurst | 0.044% | 0.065%(-0.021)#93 | 0.11%(-0.070)#2,202 |
| 94. | Carol Stream | 0.043% | 0.065%(-0.022)#94 | 0.11%(-0.071)#2,215 |
| 95. | Peoria | 0.041% | 0.065%(-0.024)#95 | 0.11%(-0.073)#2,239 |
| 96. | Addison | 0.039% | 0.065%(-0.025)#96 | 0.11%(-0.074)#2,262 |
| 97. | South Elgin | 0.038% | 0.065%(-0.027)#97 | 0.11%(-0.076)#2,272 |
| 98. | Oak Forest | 0.037% | 0.065%(-0.028)#98 | 0.11%(-0.077)#2,288 |
| 99. | Brookfield | 0.036% | 0.065%(-0.028)#99 | 0.11%(-0.077)#2,301 |
| 100. | Hoffman Estates | 0.035% | 0.065%(-0.030)#100 | 0.11%(-0.079)#2,316 |
Common Questions
What are the Top 10 Cities with the Highest Percentage of Immigrants from Taiwan in Illinois?
Top 10 Cities with the Highest Percentage of Immigrants from Taiwan in Illinois are:
#1
2.12%
#2
2.03%
#3
1.32%
#4
1.15%
#5
1.09%
#6
1.05%
#7
0.93%
#8
0.92%
#9
0.91%
#10
0.71%
What city has the Highest Percentage of Immigrants from Taiwan in Illinois?
Marseilles has the Highest Percentage of Immigrants from Taiwan in Illinois with 2.12%.
What is the Percentage of Immigrants from Taiwan in the State of Illinois?
Percentage of Immigrants from Taiwan in Illinois is 0.065%.
What is the Percentage of Immigrants from Taiwan in the United States?
Percentage of Immigrants from Taiwan in the United States is 0.11%.