Cities with the Highest Percentage of Immigrants from China in Arizona
RELATED REPORTS & OPTIONS
China
Arizona
Compare Cities
Map of Cities with the Highest Percentage of Immigrants from China in Arizona
0.00%
4.00%
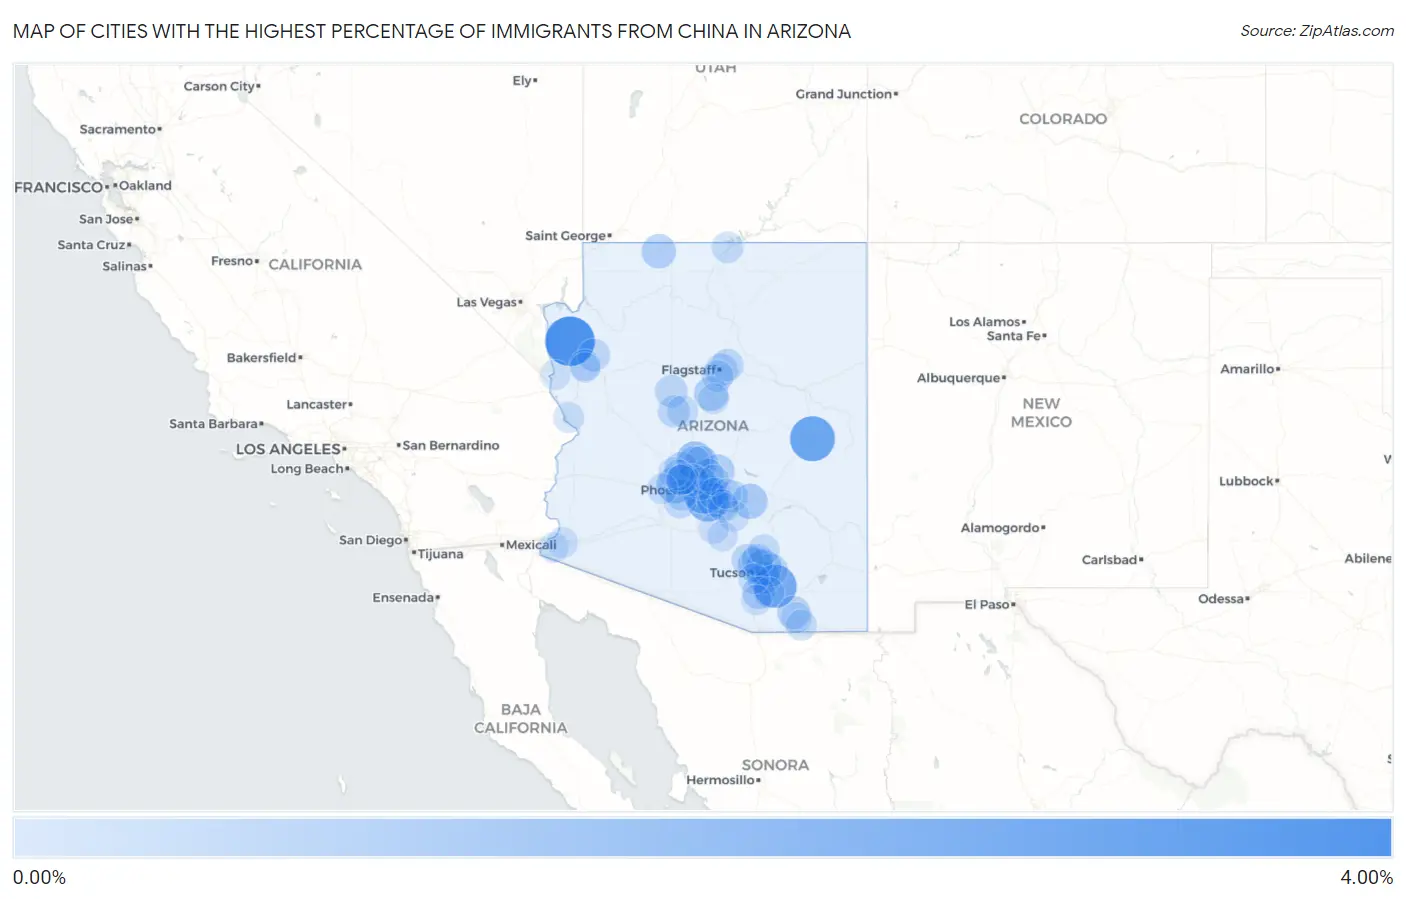
Cities with the Highest Percentage of Immigrants from China in Arizona
| City | China | vs State | vs National | |
| 1. | Dolan Springs | 3.58% | 0.40%(+3.18)#1 | 0.85%(+2.72)#424 |
| 2. | Wagon Wheel | 2.70% | 0.40%(+2.30)#2 | 0.85%(+1.85)#617 |
| 3. | Vail | 2.38% | 0.40%(+1.98)#3 | 0.85%(+1.53)#704 |
| 4. | Chandler | 1.91% | 0.40%(+1.51)#4 | 0.85%(+1.06)#925 |
| 5. | Tempe | 1.80% | 0.40%(+1.40)#5 | 0.85%(+0.949)#980 |
| 6. | New River | 1.25% | 0.40%(+0.855)#6 | 0.85%(+0.400)#1,453 |
| 7. | Citrus Park | 1.19% | 0.40%(+0.786)#7 | 0.85%(+0.331)#1,533 |
| 8. | Catalina Foothills | 1.02% | 0.40%(+0.625)#8 | 0.85%(+0.170)#1,747 |
| 9. | Superior | 0.87% | 0.40%(+0.473)#9 | 0.85%(+0.017)#2,016 |
| 10. | Casas Adobes | 0.81% | 0.40%(+0.408)#10 | 0.85%(-0.048)#2,143 |
| 11. | Sedona | 0.77% | 0.40%(+0.371)#11 | 0.85%(-0.084)#2,233 |
| 12. | Kaibab | 0.74% | 0.40%(+0.342)#12 | 0.85%(-0.114)#2,305 |
| 13. | Rio Verde | 0.70% | 0.40%(+0.303)#13 | 0.85%(-0.153)#2,403 |
| 14. | Gilbert | 0.68% | 0.40%(+0.284)#14 | 0.85%(-0.171)#2,451 |
| 15. | Peoria | 0.56% | 0.40%(+0.161)#15 | 0.85%(-0.294)#2,835 |
| 16. | Cave Creek | 0.54% | 0.40%(+0.145)#16 | 0.85%(-0.311)#2,901 |
| 17. | Huachuca City | 0.54% | 0.40%(+0.137)#17 | 0.85%(-0.318)#2,938 |
| 18. | Tucson | 0.53% | 0.40%(+0.126)#18 | 0.85%(-0.329)#2,983 |
| 19. | Scottsdale | 0.48% | 0.40%(+0.078)#19 | 0.85%(-0.377)#3,199 |
| 20. | Glendale | 0.48% | 0.40%(+0.078)#20 | 0.85%(-0.378)#3,203 |
| 21. | Tanque Verde | 0.47% | 0.40%(+0.074)#21 | 0.85%(-0.382)#3,227 |
| 22. | Sahuarita | 0.46% | 0.40%(+0.057)#22 | 0.85%(-0.399)#3,312 |
| 23. | Flagstaff | 0.44% | 0.40%(+0.041)#23 | 0.85%(-0.415)#3,404 |
| 24. | Anthem | 0.42% | 0.40%(+0.024)#24 | 0.85%(-0.432)#3,506 |
| 25. | Paulden | 0.42% | 0.40%(+0.022)#25 | 0.85%(-0.434)#3,517 |
| 26. | Paradise Valley | 0.42% | 0.40%(+0.019)#26 | 0.85%(-0.436)#3,531 |
| 27. | Valle Vista | 0.42% | 0.40%(+0.019)#27 | 0.85%(-0.437)#3,536 |
| 28. | Doney Park | 0.40% | 0.40%(-0.003)#28 | 0.85%(-0.459)#3,657 |
| 29. | Tucson Mountains | 0.38% | 0.40%(-0.023)#29 | 0.85%(-0.478)#3,770 |
| 30. | Prescott | 0.34% | 0.40%(-0.062)#30 | 0.85%(-0.518)#4,004 |
| 31. | Marana | 0.33% | 0.40%(-0.066)#31 | 0.85%(-0.521)#4,025 |
| 32. | Oro Valley | 0.33% | 0.40%(-0.070)#32 | 0.85%(-0.525)#4,047 |
| 33. | Phoenix | 0.32% | 0.40%(-0.081)#33 | 0.85%(-0.536)#4,128 |
| 34. | Mesa | 0.32% | 0.40%(-0.083)#34 | 0.85%(-0.538)#4,142 |
| 35. | Gold Canyon | 0.31% | 0.40%(-0.088)#35 | 0.85%(-0.543)#4,174 |
| 36. | Goodyear | 0.31% | 0.40%(-0.091)#36 | 0.85%(-0.547)#4,206 |
| 37. | Kachina Village | 0.29% | 0.40%(-0.105)#37 | 0.85%(-0.560)#4,294 |
| 38. | Page | 0.24% | 0.40%(-0.157)#38 | 0.85%(-0.613)#4,687 |
| 39. | Avondale | 0.24% | 0.40%(-0.159)#39 | 0.85%(-0.615)#4,700 |
| 40. | Prescott Valley | 0.22% | 0.40%(-0.182)#40 | 0.85%(-0.637)#4,880 |
| 41. | Saddlebrooke | 0.22% | 0.40%(-0.183)#41 | 0.85%(-0.638)#4,887 |
| 42. | New Kingman Butler | 0.20% | 0.40%(-0.203)#42 | 0.85%(-0.658)#5,032 |
| 43. | Sierra Vista | 0.16% | 0.40%(-0.240)#43 | 0.85%(-0.695)#5,353 |
| 44. | Sierra Vista Southeast | 0.15% | 0.40%(-0.253)#44 | 0.85%(-0.709)#5,482 |
| 45. | Queen Creek | 0.14% | 0.40%(-0.255)#45 | 0.85%(-0.710)#5,503 |
| 46. | Florence | 0.14% | 0.40%(-0.259)#46 | 0.85%(-0.715)#5,553 |
| 47. | Corona De Tucson | 0.14% | 0.40%(-0.262)#47 | 0.85%(-0.717)#5,573 |
| 48. | Lake Havasu City | 0.13% | 0.40%(-0.266)#48 | 0.85%(-0.722)#5,609 |
| 49. | Fortuna Foothills | 0.13% | 0.40%(-0.268)#49 | 0.85%(-0.724)#5,630 |
| 50. | Sun City | 0.13% | 0.40%(-0.272)#50 | 0.85%(-0.727)#5,659 |
| 51. | Village Of Oak Creek Big Park | 0.12% | 0.40%(-0.281)#51 | 0.85%(-0.736)#5,747 |
| 52. | Surprise | 0.12% | 0.40%(-0.282)#52 | 0.85%(-0.738)#5,760 |
| 53. | Sun City West | 0.12% | 0.40%(-0.283)#53 | 0.85%(-0.738)#5,767 |
| 54. | Buckeye | 0.11% | 0.40%(-0.291)#54 | 0.85%(-0.746)#5,821 |
| 55. | Drexel Heights | 0.096% | 0.40%(-0.303)#55 | 0.85%(-0.759)#5,933 |
| 56. | Fountain Hills | 0.084% | 0.40%(-0.315)#56 | 0.85%(-0.770)#6,036 |
| 57. | Eloy | 0.081% | 0.40%(-0.318)#57 | 0.85%(-0.774)#6,066 |
| 58. | Green Valley | 0.062% | 0.40%(-0.337)#58 | 0.85%(-0.792)#6,215 |
| 59. | El Mirage | 0.045% | 0.40%(-0.354)#59 | 0.85%(-0.810)#6,342 |
| 60. | Casa Grande | 0.036% | 0.40%(-0.363)#60 | 0.85%(-0.818)#6,411 |
| 61. | Kingman | 0.030% | 0.40%(-0.369)#61 | 0.85%(-0.824)#6,460 |
| 62. | Bullhead City | 0.019% | 0.40%(-0.380)#62 | 0.85%(-0.835)#6,527 |
| 63. | San Tan Valley | 0.017% | 0.40%(-0.382)#63 | 0.85%(-0.838)#6,543 |
| 64. | Apache Junction | 0.010% | 0.40%(-0.389)#64 | 0.85%(-0.844)#6,577 |
| 65. | Yuma | 0.0031% | 0.40%(-0.396)#65 | 0.85%(-0.851)#6,596 |
Common Questions
What are the Top 10 Cities with the Highest Percentage of Immigrants from China in Arizona?
Top 10 Cities with the Highest Percentage of Immigrants from China in Arizona are:
#1
3.58%
#2
2.70%
#3
2.38%
#4
1.91%
#5
1.80%
#6
1.25%
#7
1.19%
#8
1.02%
#9
0.87%
#10
0.81%
What city has the Highest Percentage of Immigrants from China in Arizona?
Dolan Springs has the Highest Percentage of Immigrants from China in Arizona with 3.58%.
What is the Percentage of Immigrants from China in the State of Arizona?
Percentage of Immigrants from China in Arizona is 0.40%.
What is the Percentage of Immigrants from China in the United States?
Percentage of Immigrants from China in the United States is 0.85%.