Cities with the Highest Percentage of Immigrants from China in Tennessee
RELATED REPORTS & OPTIONS
China
Tennessee
Compare Cities
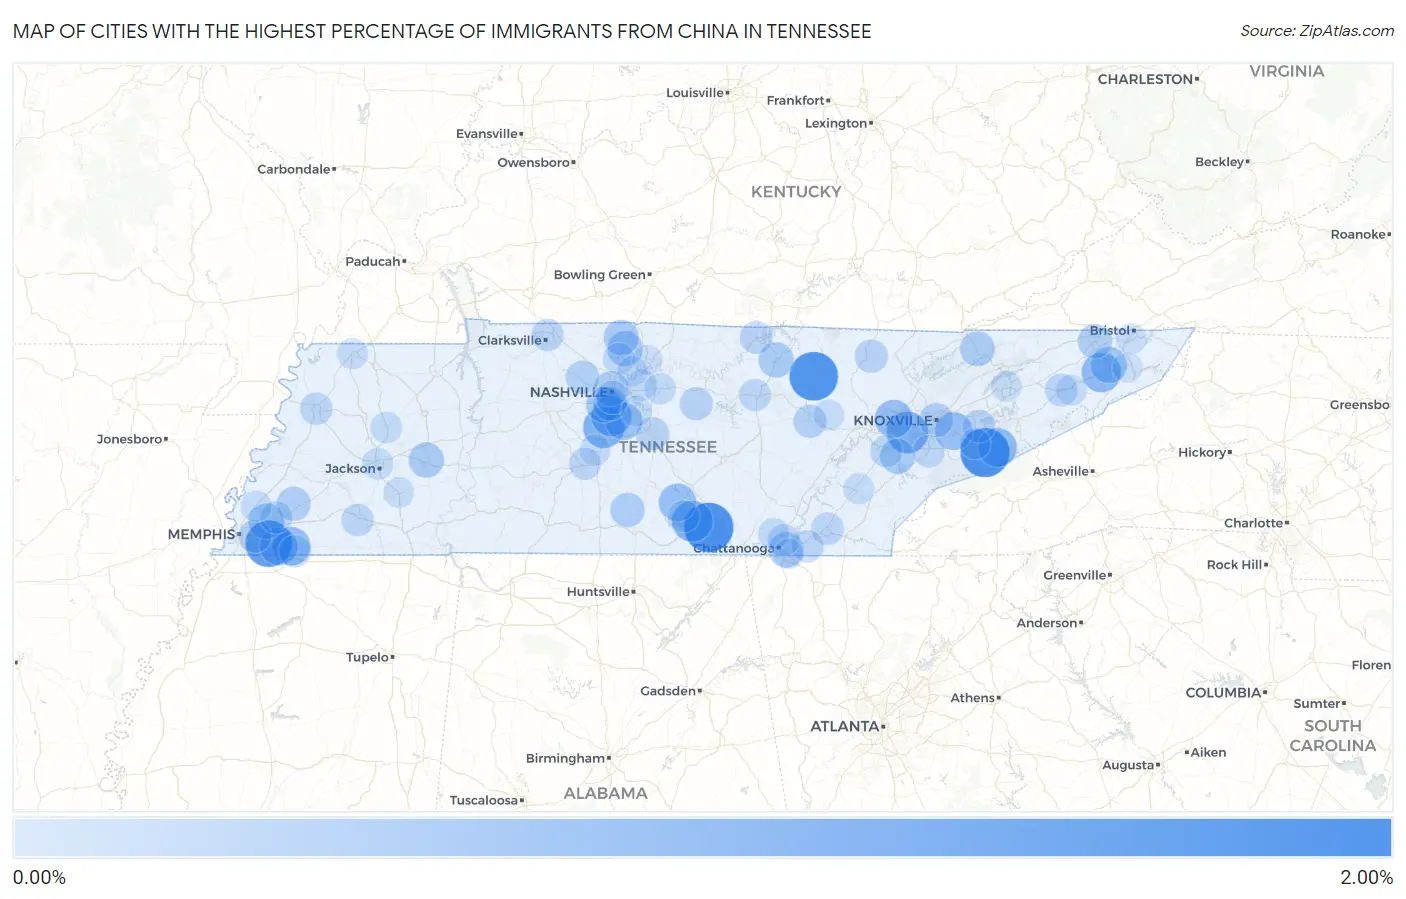
Map of Cities with the Highest Percentage of Immigrants from China in Tennessee
0.00%
2.00%
Cities with the Highest Percentage of Immigrants from China in Tennessee
| City | China | vs State | vs National | |
| 1. | Sewanee | 1.71% | 0.21%(+1.50)#1 | 0.85%(+0.857)#1,040 |
| 2. | Gatlinburg | 1.68% | 0.21%(+1.46)#2 | 0.85%(+0.823)#1,065 |
| 3. | Grimsley | 1.64% | 0.21%(+1.42)#3 | 0.85%(+0.781)#1,102 |
| 4. | Germantown | 1.45% | 0.21%(+1.24)#4 | 0.85%(+0.598)#1,242 |
| 5. | Oak Grove Cdp Washington County | 1.29% | 0.21%(+1.08)#5 | 0.85%(+0.435)#1,418 |
| 6. | Farragut | 1.00% | 0.21%(+0.787)#6 | 0.85%(+0.146)#1,797 |
| 7. | Franklin | 0.97% | 0.21%(+0.753)#7 | 0.85%(+0.112)#1,850 |
| 8. | Decherd | 0.94% | 0.21%(+0.724)#8 | 0.85%(+0.083)#1,903 |
| 9. | Brentwood | 0.87% | 0.21%(+0.659)#9 | 0.85%(+0.018)#2,014 |
| 10. | Jonesborough | 0.81% | 0.21%(+0.601)#10 | 0.85%(-0.040)#2,122 |
| 11. | Pittman Center | 0.77% | 0.21%(+0.556)#11 | 0.85%(-0.085)#2,236 |
| 12. | Piperton | 0.72% | 0.21%(+0.510)#12 | 0.85%(-0.131)#2,352 |
| 13. | Collierville | 0.68% | 0.21%(+0.469)#13 | 0.85%(-0.172)#2,453 |
| 14. | Oak Ridge | 0.68% | 0.21%(+0.462)#14 | 0.85%(-0.179)#2,466 |
| 15. | Seymour | 0.67% | 0.21%(+0.458)#15 | 0.85%(-0.183)#2,475 |
| 16. | Tullahoma | 0.66% | 0.21%(+0.445)#16 | 0.85%(-0.196)#2,515 |
| 17. | Nolensville | 0.60% | 0.21%(+0.389)#17 | 0.85%(-0.252)#2,685 |
| 18. | Johnson City | 0.54% | 0.21%(+0.322)#18 | 0.85%(-0.319)#2,940 |
| 19. | Bartlett | 0.48% | 0.21%(+0.270)#19 | 0.85%(-0.371)#3,176 |
| 20. | White House | 0.46% | 0.21%(+0.245)#20 | 0.85%(-0.396)#3,291 |
| 21. | Forest Hills | 0.45% | 0.21%(+0.233)#21 | 0.85%(-0.407)#3,356 |
| 22. | Lexington | 0.44% | 0.21%(+0.228)#22 | 0.85%(-0.413)#3,390 |
| 23. | Cross Plains | 0.44% | 0.21%(+0.225)#23 | 0.85%(-0.416)#3,406 |
| 24. | Ridgeside | 0.44% | 0.21%(+0.222)#24 | 0.85%(-0.419)#3,423 |
| 25. | Tellico Village | 0.43% | 0.21%(+0.220)#25 | 0.85%(-0.421)#3,435 |
| 26. | Livingston | 0.43% | 0.21%(+0.220)#26 | 0.85%(-0.421)#3,437 |
| 27. | Nashville | 0.41% | 0.21%(+0.199)#27 | 0.85%(-0.442)#3,566 |
| 28. | Tazewell | 0.41% | 0.21%(+0.194)#28 | 0.85%(-0.447)#3,594 |
| 29. | Petersburg | 0.36% | 0.21%(+0.146)#29 | 0.85%(-0.495)#3,867 |
| 30. | Kingsport | 0.36% | 0.21%(+0.144)#30 | 0.85%(-0.497)#3,887 |
| 31. | Braden | 0.34% | 0.21%(+0.128)#31 | 0.85%(-0.513)#3,978 |
| 32. | Knoxville | 0.33% | 0.21%(+0.120)#32 | 0.85%(-0.521)#4,026 |
| 33. | Oak Hill | 0.31% | 0.21%(+0.101)#33 | 0.85%(-0.540)#4,155 |
| 34. | Ashland City | 0.31% | 0.21%(+0.093)#34 | 0.85%(-0.548)#4,211 |
| 35. | Crossville | 0.27% | 0.21%(+0.059)#35 | 0.85%(-0.582)#4,457 |
| 36. | Berry Hill | 0.27% | 0.21%(+0.055)#36 | 0.85%(-0.586)#4,483 |
| 37. | Huntsville | 0.26% | 0.21%(+0.051)#37 | 0.85%(-0.590)#4,510 |
| 38. | Alexandria | 0.26% | 0.21%(+0.045)#38 | 0.85%(-0.596)#4,551 |
| 39. | Murfreesboro | 0.25% | 0.21%(+0.035)#39 | 0.85%(-0.606)#4,638 |
| 40. | Memphis | 0.25% | 0.21%(+0.033)#40 | 0.85%(-0.608)#4,651 |
| 41. | Sevierville | 0.23% | 0.21%(+0.020)#41 | 0.85%(-0.621)#4,752 |
| 42. | Celina | 0.23% | 0.21%(+0.013)#42 | 0.85%(-0.628)#4,802 |
| 43. | Greeneville | 0.21% | 0.21%(-0.000)#43 | 0.85%(-0.641)#4,913 |
| 44. | Cleveland | 0.21% | 0.21%(-0.002)#44 | 0.85%(-0.643)#4,927 |
| 45. | Dyersburg | 0.21% | 0.21%(-0.003)#45 | 0.85%(-0.644)#4,936 |
| 46. | Maryville | 0.20% | 0.21%(-0.016)#46 | 0.85%(-0.657)#5,021 |
| 47. | Lakeland | 0.20% | 0.21%(-0.018)#47 | 0.85%(-0.659)#5,040 |
| 48. | Bolivar | 0.19% | 0.21%(-0.021)#48 | 0.85%(-0.662)#5,065 |
| 49. | Clarksville | 0.19% | 0.21%(-0.026)#49 | 0.85%(-0.667)#5,093 |
| 50. | Collegedale | 0.18% | 0.21%(-0.032)#50 | 0.85%(-0.673)#5,141 |
| 51. | Loudon | 0.18% | 0.21%(-0.032)#51 | 0.85%(-0.673)#5,145 |
| 52. | Karns | 0.18% | 0.21%(-0.038)#52 | 0.85%(-0.679)#5,197 |
| 53. | Rossville | 0.17% | 0.21%(-0.045)#53 | 0.85%(-0.686)#5,266 |
| 54. | Cookeville | 0.17% | 0.21%(-0.048)#54 | 0.85%(-0.689)#5,295 |
| 55. | Columbia | 0.16% | 0.21%(-0.056)#55 | 0.85%(-0.697)#5,368 |
| 56. | Estill Springs | 0.15% | 0.21%(-0.065)#56 | 0.85%(-0.706)#5,454 |
| 57. | Chattanooga | 0.14% | 0.21%(-0.069)#57 | 0.85%(-0.710)#5,498 |
| 58. | Millersville | 0.14% | 0.21%(-0.076)#58 | 0.85%(-0.717)#5,572 |
| 59. | Jackson | 0.13% | 0.21%(-0.087)#59 | 0.85%(-0.728)#5,666 |
| 60. | Mount Juliet | 0.12% | 0.21%(-0.090)#60 | 0.85%(-0.730)#5,694 |
| 61. | Milan | 0.12% | 0.21%(-0.091)#61 | 0.85%(-0.732)#5,711 |
| 62. | Lebanon | 0.12% | 0.21%(-0.092)#62 | 0.85%(-0.733)#5,721 |
| 63. | Signal Mountain | 0.10% | 0.21%(-0.112)#63 | 0.85%(-0.753)#5,874 |
| 64. | Pigeon Forge | 0.095% | 0.21%(-0.119)#64 | 0.85%(-0.760)#5,942 |
| 65. | Spring Hill | 0.080% | 0.21%(-0.134)#65 | 0.85%(-0.775)#6,077 |
| 66. | Athens | 0.078% | 0.21%(-0.135)#66 | 0.85%(-0.776)#6,091 |
| 67. | Millington | 0.076% | 0.21%(-0.138)#67 | 0.85%(-0.779)#6,107 |
| 68. | Union City | 0.072% | 0.21%(-0.141)#68 | 0.85%(-0.782)#6,131 |
| 69. | La Vergne | 0.070% | 0.21%(-0.144)#69 | 0.85%(-0.784)#6,153 |
| 70. | Morristown | 0.065% | 0.21%(-0.148)#70 | 0.85%(-0.789)#6,197 |
| 71. | Powell | 0.064% | 0.21%(-0.149)#71 | 0.85%(-0.790)#6,204 |
| 72. | Tusculum | 0.061% | 0.21%(-0.152)#72 | 0.85%(-0.793)#6,221 |
| 73. | Fairfield Glade | 0.054% | 0.21%(-0.160)#73 | 0.85%(-0.800)#6,287 |
| 74. | Henderson | 0.047% | 0.21%(-0.166)#74 | 0.85%(-0.807)#6,322 |
| 75. | Bristol | 0.040% | 0.21%(-0.173)#75 | 0.85%(-0.814)#6,379 |
| 76. | Hendersonville | 0.031% | 0.21%(-0.183)#76 | 0.85%(-0.824)#6,453 |
| 77. | Elizabethton | 0.014% | 0.21%(-0.200)#77 | 0.85%(-0.841)#6,561 |
| 78. | East Ridge | 0.014% | 0.21%(-0.200)#78 | 0.85%(-0.841)#6,564 |
| 79. | Gallatin | 0.0067% | 0.21%(-0.207)#79 | 0.85%(-0.848)#6,591 |
Common Questions
What are the Top 10 Cities with the Highest Percentage of Immigrants from China in Tennessee?
Top 10 Cities with the Highest Percentage of Immigrants from China in Tennessee are:
#1
1.71%
#2
1.68%
#3
1.64%
#4
1.45%
#5
1.00%
#6
0.97%
#7
0.94%
#8
0.87%
#9
0.81%
#10
0.77%
What city has the Highest Percentage of Immigrants from China in Tennessee?
Sewanee has the Highest Percentage of Immigrants from China in Tennessee with 1.71%.
What is the Percentage of Immigrants from China in the State of Tennessee?
Percentage of Immigrants from China in Tennessee is 0.21%.
What is the Percentage of Immigrants from China in the United States?
Percentage of Immigrants from China in the United States is 0.85%.