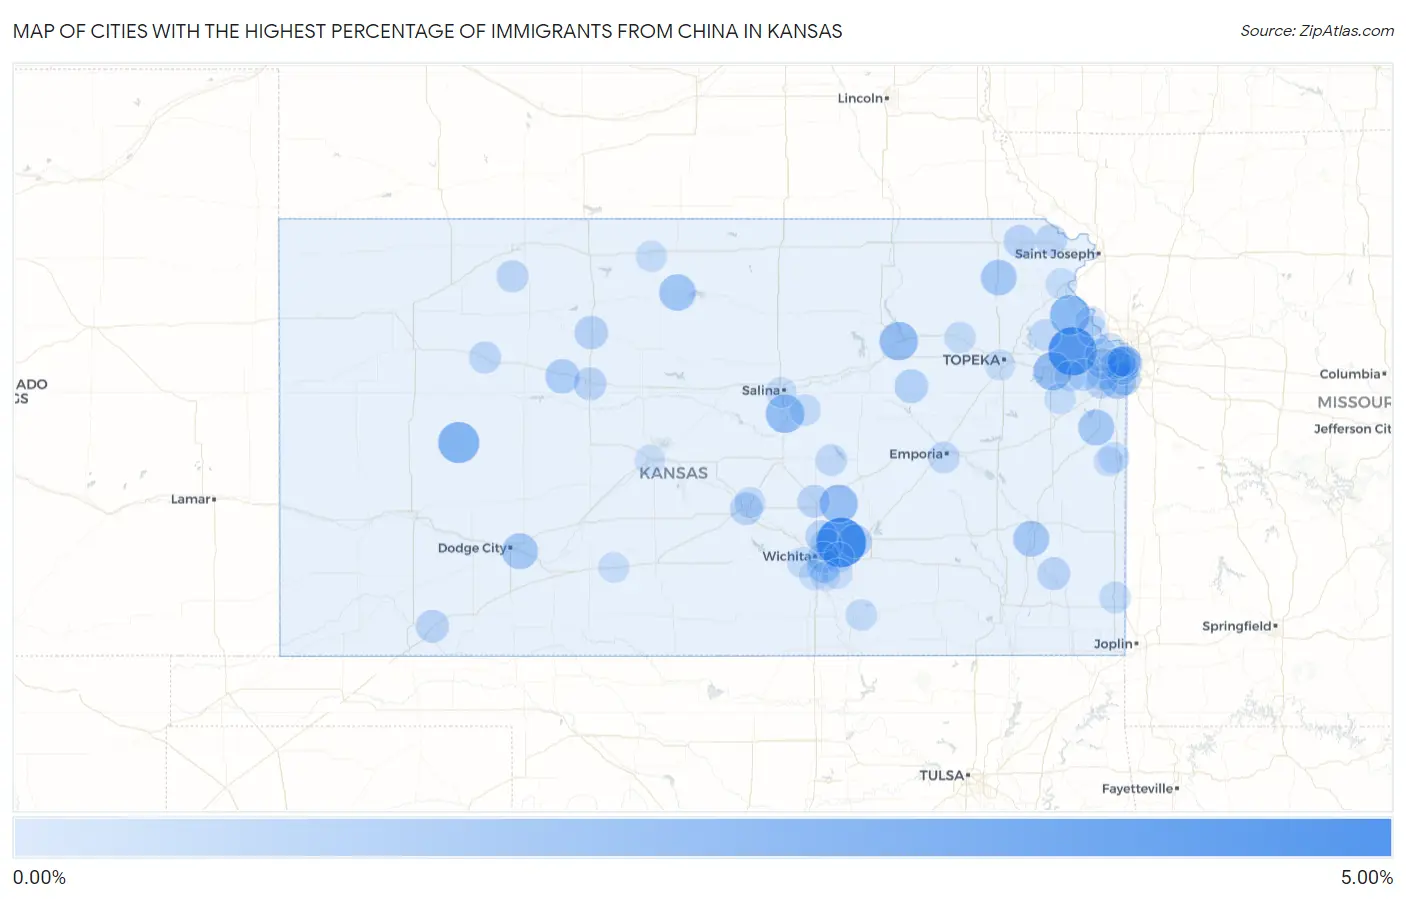
Cities with the Highest Percentage of Immigrants from China in Kansas
RELATED REPORTS & OPTIONS
China
Kansas
Compare Cities
Map of Cities with the Highest Percentage of Immigrants from China in Kansas
0.00%
5.00%
Cities with the Highest Percentage of Immigrants from China in Kansas
| City | China | vs State | vs National | |
| 1. | Benton | 4.62% | 0.34%(+4.28)#1 | 0.85%(+3.77)#295 |
| 2. | Tonganoxie | 4.25% | 0.34%(+3.91)#2 | 0.85%(+3.39)#336 |
| 3. | Dighton | 2.56% | 0.34%(+2.22)#3 | 0.85%(+1.71)#653 |
| 4. | Easton | 2.32% | 0.34%(+1.98)#4 | 0.85%(+1.46)#733 |
| 5. | Assaria | 1.96% | 0.34%(+1.62)#5 | 0.85%(+1.11)#891 |
| 6. | Manhattan | 1.95% | 0.34%(+1.61)#6 | 0.85%(+1.09)#900 |
| 7. | Lawrence | 1.91% | 0.34%(+1.58)#7 | 0.85%(+1.06)#922 |
| 8. | Elbing | 1.85% | 0.34%(+1.51)#8 | 0.85%(+0.991)#955 |
| 9. | Downs | 1.49% | 0.34%(+1.15)#9 | 0.85%(+0.633)#1,213 |
| 10. | Fort Dodge | 1.34% | 0.34%(+1.00)#10 | 0.85%(+0.488)#1,339 |
| 11. | Paola | 1.34% | 0.34%(+1.00)#11 | 0.85%(+0.487)#1,341 |
| 12. | Humboldt | 1.34% | 0.34%(+1.00)#12 | 0.85%(+0.485)#1,345 |
| 13. | Netawaka | 1.29% | 0.34%(+0.952)#13 | 0.85%(+0.436)#1,416 |
| 14. | Overland Park | 1.21% | 0.34%(+0.870)#14 | 0.85%(+0.354)#1,502 |
| 15. | Mission Hills | 1.04% | 0.34%(+0.699)#15 | 0.85%(+0.183)#1,731 |
| 16. | Ellis | 0.99% | 0.34%(+0.654)#16 | 0.85%(+0.138)#1,810 |
| 17. | Alta Vista | 0.87% | 0.34%(+0.535)#17 | 0.85%(+0.019)#2,012 |
| 18. | Leawood | 0.81% | 0.34%(+0.467)#18 | 0.85%(-0.049)#2,148 |
| 19. | Plainville | 0.79% | 0.34%(+0.456)#19 | 0.85%(-0.060)#2,179 |
| 20. | Towanda | 0.78% | 0.34%(+0.439)#20 | 0.85%(-0.077)#2,215 |
| 21. | Mcconnell Afb | 0.74% | 0.34%(+0.400)#21 | 0.85%(-0.116)#2,310 |
| 22. | Hays | 0.65% | 0.34%(+0.311)#22 | 0.85%(-0.205)#2,541 |
| 23. | Erie | 0.64% | 0.34%(+0.307)#23 | 0.85%(-0.210)#2,554 |
| 24. | Kismet | 0.63% | 0.34%(+0.294)#24 | 0.85%(-0.223)#2,595 |
| 25. | North Newton | 0.62% | 0.34%(+0.280)#25 | 0.85%(-0.237)#2,645 |
| 26. | Hiawatha | 0.62% | 0.34%(+0.278)#26 | 0.85%(-0.238)#2,652 |
| 27. | South Hutchinson | 0.60% | 0.34%(+0.265)#27 | 0.85%(-0.252)#2,683 |
| 28. | Fairway | 0.60% | 0.34%(+0.263)#28 | 0.85%(-0.254)#2,690 |
| 29. | Lenexa | 0.55% | 0.34%(+0.208)#29 | 0.85%(-0.308)#2,888 |
| 30. | Olathe | 0.51% | 0.34%(+0.174)#30 | 0.85%(-0.343)#3,055 |
| 31. | Edwardsville | 0.51% | 0.34%(+0.168)#31 | 0.85%(-0.349)#3,079 |
| 32. | Lenora | 0.49% | 0.34%(+0.150)#32 | 0.85%(-0.367)#3,160 |
| 33. | Bel Aire | 0.48% | 0.34%(+0.142)#33 | 0.85%(-0.375)#3,191 |
| 34. | Highland | 0.45% | 0.34%(+0.114)#34 | 0.85%(-0.402)#3,334 |
| 35. | De Soto | 0.45% | 0.34%(+0.110)#35 | 0.85%(-0.406)#3,349 |
| 36. | Quinter | 0.44% | 0.34%(+0.105)#36 | 0.85%(-0.411)#3,378 |
| 37. | Kechi | 0.44% | 0.34%(+0.103)#37 | 0.85%(-0.414)#3,393 |
| 38. | Westwood | 0.44% | 0.34%(+0.099)#38 | 0.85%(-0.417)#3,416 |
| 39. | Emporia | 0.38% | 0.34%(+0.043)#39 | 0.85%(-0.473)#3,733 |
| 40. | Prairie Village | 0.38% | 0.34%(+0.037)#40 | 0.85%(-0.479)#3,772 |
| 41. | Hillsboro | 0.36% | 0.34%(+0.026)#41 | 0.85%(-0.490)#3,842 |
| 42. | Oskaloosa | 0.35% | 0.34%(+0.013)#42 | 0.85%(-0.503)#3,914 |
| 43. | Winfield | 0.34% | 0.34%(+0.001)#43 | 0.85%(-0.516)#3,991 |
| 44. | Pittsburg | 0.33% | 0.34%(-0.008)#44 | 0.85%(-0.524)#4,043 |
| 45. | St Marys | 0.30% | 0.34%(-0.037)#45 | 0.85%(-0.554)#4,249 |
| 46. | Gypsum | 0.30% | 0.34%(-0.040)#46 | 0.85%(-0.557)#4,271 |
| 47. | Eastborough | 0.28% | 0.34%(-0.057)#47 | 0.85%(-0.574)#4,393 |
| 48. | Atchison | 0.27% | 0.34%(-0.070)#48 | 0.85%(-0.587)#4,487 |
| 49. | Smith Center | 0.26% | 0.34%(-0.078)#49 | 0.85%(-0.595)#4,543 |
| 50. | Hutchinson | 0.25% | 0.34%(-0.093)#50 | 0.85%(-0.609)#4,665 |
| 51. | Kansas City | 0.22% | 0.34%(-0.122)#51 | 0.85%(-0.638)#4,889 |
| 52. | Linn Valley | 0.21% | 0.34%(-0.125)#52 | 0.85%(-0.641)#4,915 |
| 53. | Wichita | 0.21% | 0.34%(-0.125)#53 | 0.85%(-0.642)#4,920 |
| 54. | Baldwin City | 0.21% | 0.34%(-0.132)#54 | 0.85%(-0.648)#4,965 |
| 55. | Mission | 0.20% | 0.34%(-0.136)#55 | 0.85%(-0.652)#4,988 |
| 56. | Eudora | 0.20% | 0.34%(-0.139)#56 | 0.85%(-0.655)#5,007 |
| 57. | Shawnee | 0.19% | 0.34%(-0.149)#57 | 0.85%(-0.665)#5,084 |
| 58. | Salina | 0.18% | 0.34%(-0.156)#58 | 0.85%(-0.673)#5,139 |
| 59. | Topeka | 0.18% | 0.34%(-0.160)#59 | 0.85%(-0.676)#5,171 |
| 60. | Merriam | 0.15% | 0.34%(-0.184)#60 | 0.85%(-0.701)#5,405 |
| 61. | Lansing | 0.14% | 0.34%(-0.196)#61 | 0.85%(-0.712)#5,523 |
| 62. | Haviland | 0.14% | 0.34%(-0.197)#62 | 0.85%(-0.714)#5,541 |
| 63. | Andover | 0.13% | 0.34%(-0.209)#63 | 0.85%(-0.725)#5,642 |
| 64. | Rose Hill | 0.11% | 0.34%(-0.223)#64 | 0.85%(-0.740)#5,781 |
| 65. | Great Bend | 0.11% | 0.34%(-0.229)#65 | 0.85%(-0.746)#5,818 |
| 66. | La Cygne | 0.070% | 0.34%(-0.268)#66 | 0.85%(-0.784)#6,150 |
| 67. | Roeland Park | 0.044% | 0.34%(-0.294)#67 | 0.85%(-0.811)#6,352 |
| 68. | Leavenworth | 0.043% | 0.34%(-0.295)#68 | 0.85%(-0.811)#6,356 |
| 69. | Haysville | 0.037% | 0.34%(-0.301)#69 | 0.85%(-0.818)#6,408 |
| 70. | Derby | 0.027% | 0.34%(-0.311)#70 | 0.85%(-0.827)#6,479 |
Common Questions
What are the Top 10 Cities with the Highest Percentage of Immigrants from China in Kansas?
Top 10 Cities with the Highest Percentage of Immigrants from China in Kansas are:
#1
4.62%
#2
4.25%
#3
2.56%
#4
2.32%
#5
1.96%
#6
1.95%
#7
1.91%
#8
1.85%
#9
1.49%
#10
1.34%
What city has the Highest Percentage of Immigrants from China in Kansas?
Benton has the Highest Percentage of Immigrants from China in Kansas with 4.62%.
What is the Percentage of Immigrants from China in the State of Kansas?
Percentage of Immigrants from China in Kansas is 0.34%.
What is the Percentage of Immigrants from China in the United States?
Percentage of Immigrants from China in the United States is 0.85%.