Cities with the Highest Percentage of Immigrants from China in Michigan
RELATED REPORTS & OPTIONS
China
Michigan
Compare Cities
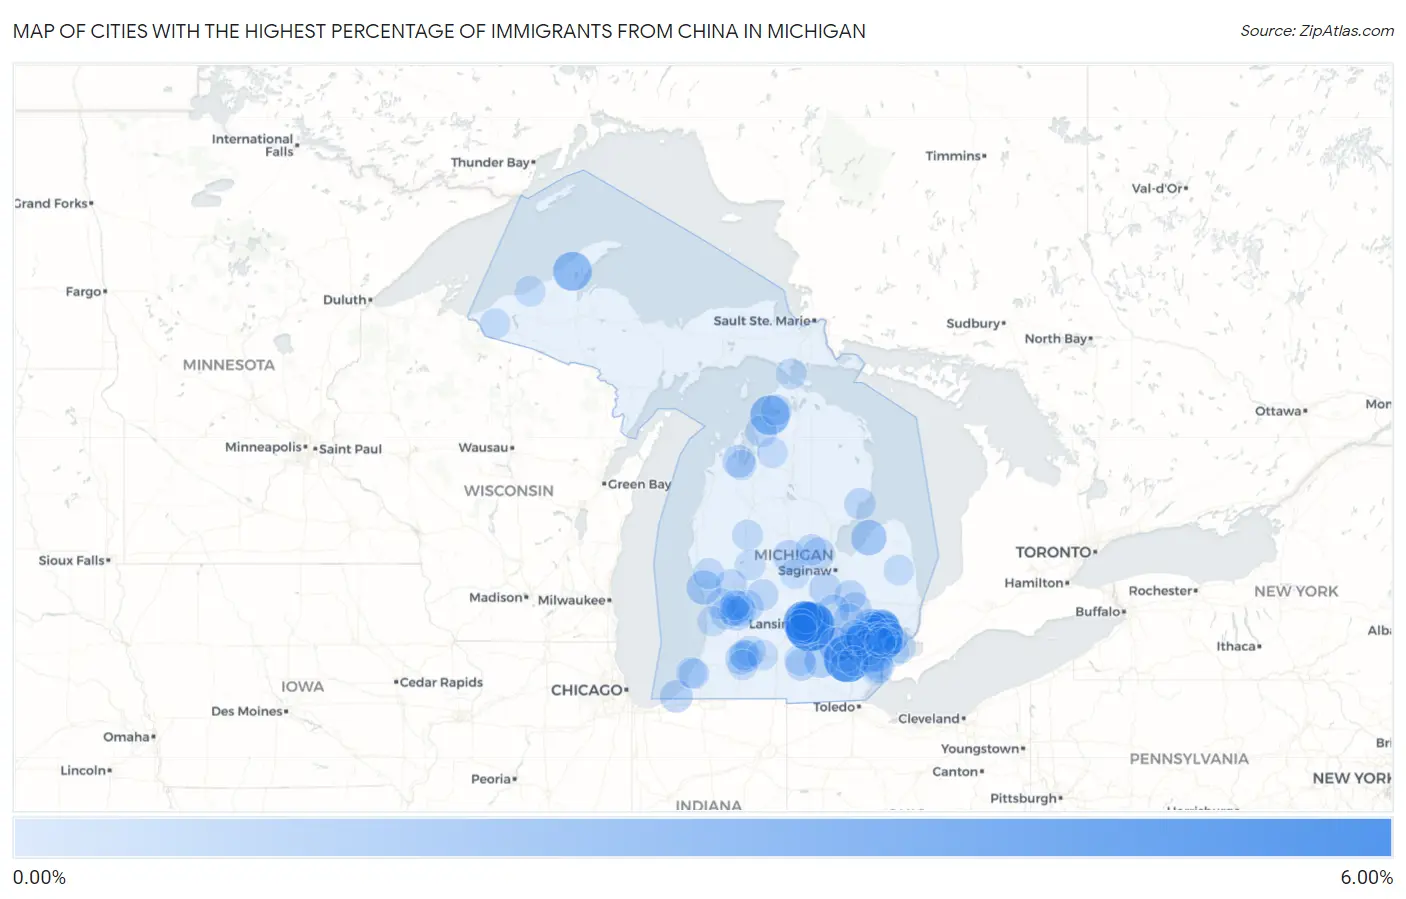
Map of Cities with the Highest Percentage of Immigrants from China in Michigan
0.00%
6.00%
Cities with the Highest Percentage of Immigrants from China in Michigan
| City | China | vs State | vs National | |
| 1. | Okemos | 5.38% | 0.40%(+4.98)#1 | 0.85%(+4.53)#230 |
| 2. | Ann Arbor | 4.72% | 0.40%(+4.32)#2 | 0.85%(+3.87)#280 |
| 3. | Troy | 3.63% | 0.40%(+3.23)#3 | 0.85%(+2.78)#415 |
| 4. | East Lansing | 3.63% | 0.40%(+3.23)#4 | 0.85%(+2.77)#416 |
| 5. | Haslett | 2.84% | 0.40%(+2.44)#5 | 0.85%(+1.98)#581 |
| 6. | Novi | 2.77% | 0.40%(+2.37)#6 | 0.85%(+1.92)#602 |
| 7. | Bay Shore | 2.63% | 0.40%(+2.22)#7 | 0.85%(+1.77)#634 |
| 8. | Houghton | 2.46% | 0.40%(+2.05)#8 | 0.85%(+1.60)#680 |
| 9. | Rochester Hills | 2.42% | 0.40%(+2.02)#9 | 0.85%(+1.56)#692 |
| 10. | Madison Heights | 2.06% | 0.40%(+1.66)#10 | 0.85%(+1.21)#832 |
| 11. | Northville | 1.86% | 0.40%(+1.45)#11 | 0.85%(+1.00)#946 |
| 12. | Pinckney | 1.54% | 0.40%(+1.14)#12 | 0.85%(+0.684)#1,158 |
| 13. | Bay Port | 1.52% | 0.40%(+1.12)#13 | 0.85%(+0.668)#1,177 |
| 14. | Beverly Hills | 1.52% | 0.40%(+1.11)#14 | 0.85%(+0.662)#1,184 |
| 15. | Franklin | 1.39% | 0.40%(+0.993)#15 | 0.85%(+0.540)#1,295 |
| 16. | Lake Angelus | 1.39% | 0.40%(+0.992)#16 | 0.85%(+0.539)#1,297 |
| 17. | Auburn Hills | 1.31% | 0.40%(+0.903)#17 | 0.85%(+0.451)#1,389 |
| 18. | Roosevelt Park | 1.28% | 0.40%(+0.879)#18 | 0.85%(+0.426)#1,428 |
| 19. | Bloomfield Hills | 1.20% | 0.40%(+0.802)#19 | 0.85%(+0.350)#1,512 |
| 20. | Rochester | 1.13% | 0.40%(+0.731)#20 | 0.85%(+0.278)#1,591 |
| 21. | Crystal | 0.99% | 0.40%(+0.588)#21 | 0.85%(+0.136)#1,812 |
| 22. | Grass Lake | 0.98% | 0.40%(+0.580)#22 | 0.85%(+0.128)#1,825 |
| 23. | Pleasant Ridge | 0.84% | 0.40%(+0.441)#23 | 0.85%(-0.011)#2,075 |
| 24. | Walled Lake | 0.84% | 0.40%(+0.438)#24 | 0.85%(-0.014)#2,081 |
| 25. | Greilickville | 0.82% | 0.40%(+0.416)#25 | 0.85%(-0.036)#2,118 |
| 26. | New Buffalo | 0.81% | 0.40%(+0.406)#26 | 0.85%(-0.047)#2,140 |
| 27. | Bingham Farms | 0.80% | 0.40%(+0.399)#27 | 0.85%(-0.053)#2,161 |
| 28. | Grand Blanc | 0.78% | 0.40%(+0.382)#28 | 0.85%(-0.070)#2,196 |
| 29. | Chesaning | 0.73% | 0.40%(+0.333)#29 | 0.85%(-0.120)#2,320 |
| 30. | Midland | 0.73% | 0.40%(+0.331)#30 | 0.85%(-0.121)#2,326 |
| 31. | Mount Pleasant | 0.73% | 0.40%(+0.327)#31 | 0.85%(-0.126)#2,340 |
| 32. | Royal Oak | 0.71% | 0.40%(+0.309)#32 | 0.85%(-0.143)#2,379 |
| 33. | Hazel Park | 0.71% | 0.40%(+0.308)#33 | 0.85%(-0.144)#2,384 |
| 34. | Farmington Hills | 0.64% | 0.40%(+0.237)#34 | 0.85%(-0.215)#2,578 |
| 35. | Beecher | 0.63% | 0.40%(+0.225)#35 | 0.85%(-0.227)#2,617 |
| 36. | Kalamazoo | 0.62% | 0.40%(+0.221)#36 | 0.85%(-0.231)#2,630 |
| 37. | Ellsworth | 0.60% | 0.40%(+0.200)#37 | 0.85%(-0.252)#2,684 |
| 38. | Brighton | 0.60% | 0.40%(+0.199)#38 | 0.85%(-0.253)#2,689 |
| 39. | Forest Hills | 0.59% | 0.40%(+0.189)#39 | 0.85%(-0.263)#2,726 |
| 40. | Casnovia | 0.55% | 0.40%(+0.152)#40 | 0.85%(-0.300)#2,859 |
| 41. | Comstock Northwest | 0.55% | 0.40%(+0.144)#41 | 0.85%(-0.309)#2,892 |
| 42. | Westland | 0.54% | 0.40%(+0.143)#42 | 0.85%(-0.310)#2,894 |
| 43. | Durand | 0.54% | 0.40%(+0.142)#43 | 0.85%(-0.311)#2,902 |
| 44. | Bath | 0.54% | 0.40%(+0.141)#44 | 0.85%(-0.312)#2,909 |
| 45. | Lansing | 0.54% | 0.40%(+0.141)#45 | 0.85%(-0.312)#2,910 |
| 46. | Village Of Grosse Pointe Shores | 0.54% | 0.40%(+0.134)#46 | 0.85%(-0.318)#2,935 |
| 47. | Sanford | 0.53% | 0.40%(+0.126)#47 | 0.85%(-0.326)#2,969 |
| 48. | Tawas City | 0.51% | 0.40%(+0.113)#48 | 0.85%(-0.340)#3,032 |
| 49. | Belding | 0.50% | 0.40%(+0.103)#49 | 0.85%(-0.350)#3,084 |
| 50. | Spring Arbor | 0.50% | 0.40%(+0.096)#50 | 0.85%(-0.357)#3,119 |
| 51. | Hudsonville | 0.50% | 0.40%(+0.096)#51 | 0.85%(-0.357)#3,120 |
| 52. | Sterling Heights | 0.48% | 0.40%(+0.083)#52 | 0.85%(-0.370)#3,172 |
| 53. | Cutlerville | 0.46% | 0.40%(+0.060)#53 | 0.85%(-0.393)#3,279 |
| 54. | Harbor Springs | 0.46% | 0.40%(+0.056)#54 | 0.85%(-0.396)#3,293 |
| 55. | Parma | 0.45% | 0.40%(+0.051)#55 | 0.85%(-0.402)#3,330 |
| 56. | Barton Hills | 0.45% | 0.40%(+0.048)#56 | 0.85%(-0.404)#3,340 |
| 57. | Southgate | 0.45% | 0.40%(+0.045)#57 | 0.85%(-0.407)#3,353 |
| 58. | Twin Lake | 0.42% | 0.40%(+0.022)#58 | 0.85%(-0.430)#3,492 |
| 59. | Grand Rapids | 0.42% | 0.40%(+0.020)#59 | 0.85%(-0.432)#3,511 |
| 60. | Holt | 0.42% | 0.40%(+0.020)#60 | 0.85%(-0.433)#3,514 |
| 61. | Inkster | 0.41% | 0.40%(+0.008)#61 | 0.85%(-0.444)#3,577 |
| 62. | Richland | 0.41% | 0.40%(+0.007)#62 | 0.85%(-0.446)#3,585 |
| 63. | Grandville | 0.41% | 0.40%(+0.004)#63 | 0.85%(-0.449)#3,604 |
| 64. | Kentwood | 0.40% | 0.40%(-0.006)#64 | 0.85%(-0.458)#3,650 |
| 65. | St Joseph | 0.39% | 0.40%(-0.007)#65 | 0.85%(-0.460)#3,660 |
| 66. | Wolverine Lake | 0.38% | 0.40%(-0.024)#66 | 0.85%(-0.476)#3,752 |
| 67. | Allendale | 0.38% | 0.40%(-0.025)#67 | 0.85%(-0.478)#3,762 |
| 68. | Birmingham | 0.37% | 0.40%(-0.029)#68 | 0.85%(-0.482)#3,785 |
| 69. | Reed City | 0.36% | 0.40%(-0.039)#69 | 0.85%(-0.492)#3,855 |
| 70. | St Ignace | 0.36% | 0.40%(-0.044)#70 | 0.85%(-0.496)#3,879 |
| 71. | Dearborn | 0.34% | 0.40%(-0.057)#71 | 0.85%(-0.509)#3,955 |
| 72. | Fair Plain | 0.33% | 0.40%(-0.068)#72 | 0.85%(-0.520)#4,018 |
| 73. | Grosse Pointe Park | 0.32% | 0.40%(-0.081)#73 | 0.85%(-0.533)#4,109 |
| 74. | Pontiac | 0.31% | 0.40%(-0.091)#74 | 0.85%(-0.543)#4,172 |
| 75. | Ontonagon | 0.31% | 0.40%(-0.092)#75 | 0.85%(-0.544)#4,185 |
| 76. | Fenton | 0.31% | 0.40%(-0.093)#76 | 0.85%(-0.545)#4,191 |
| 77. | Morley | 0.31% | 0.40%(-0.094)#77 | 0.85%(-0.546)#4,201 |
| 78. | Saline | 0.30% | 0.40%(-0.101)#78 | 0.85%(-0.554)#4,246 |
| 79. | Farmington | 0.30% | 0.40%(-0.106)#79 | 0.85%(-0.558)#4,284 |
| 80. | Parchment | 0.29% | 0.40%(-0.108)#80 | 0.85%(-0.560)#4,303 |
| 81. | Riverview | 0.29% | 0.40%(-0.111)#81 | 0.85%(-0.564)#4,324 |
| 82. | Livonia | 0.29% | 0.40%(-0.112)#82 | 0.85%(-0.565)#4,332 |
| 83. | Fraser | 0.29% | 0.40%(-0.116)#83 | 0.85%(-0.568)#4,353 |
| 84. | Springfield | 0.28% | 0.40%(-0.117)#84 | 0.85%(-0.570)#4,364 |
| 85. | Wyoming | 0.28% | 0.40%(-0.119)#85 | 0.85%(-0.572)#4,378 |
| 86. | Woodhaven | 0.28% | 0.40%(-0.122)#86 | 0.85%(-0.575)#4,405 |
| 87. | Portage | 0.28% | 0.40%(-0.124)#87 | 0.85%(-0.577)#4,418 |
| 88. | Holland | 0.27% | 0.40%(-0.136)#88 | 0.85%(-0.588)#4,497 |
| 89. | Sandusky | 0.26% | 0.40%(-0.144)#89 | 0.85%(-0.596)#4,556 |
| 90. | Wakefield | 0.26% | 0.40%(-0.145)#90 | 0.85%(-0.597)#4,559 |
| 91. | Warren | 0.26% | 0.40%(-0.146)#91 | 0.85%(-0.598)#4,571 |
| 92. | Walker | 0.25% | 0.40%(-0.148)#92 | 0.85%(-0.600)#4,589 |
| 93. | Mancelona | 0.25% | 0.40%(-0.155)#93 | 0.85%(-0.608)#4,649 |
| 94. | Clawson | 0.25% | 0.40%(-0.156)#94 | 0.85%(-0.609)#4,658 |
| 95. | Traverse City | 0.24% | 0.40%(-0.163)#95 | 0.85%(-0.615)#4,707 |
| 96. | Alma | 0.23% | 0.40%(-0.169)#96 | 0.85%(-0.621)#4,755 |
| 97. | Milford | 0.22% | 0.40%(-0.186)#97 | 0.85%(-0.638)#4,892 |
| 98. | Wixom | 0.21% | 0.40%(-0.190)#98 | 0.85%(-0.643)#4,926 |
| 99. | Ypsilanti | 0.20% | 0.40%(-0.204)#99 | 0.85%(-0.656)#5,017 |
| 100. | Huntington Woods | 0.19% | 0.40%(-0.213)#100 | 0.85%(-0.666)#5,089 |
Common Questions
What are the Top 10 Cities with the Highest Percentage of Immigrants from China in Michigan?
Top 10 Cities with the Highest Percentage of Immigrants from China in Michigan are:
#1
5.38%
#2
4.72%
#3
3.63%
#4
3.63%
#5
2.84%
#6
2.77%
#7
2.63%
#8
2.46%
#9
2.42%
#10
2.06%
What city has the Highest Percentage of Immigrants from China in Michigan?
Okemos has the Highest Percentage of Immigrants from China in Michigan with 5.38%.
What is the Percentage of Immigrants from China in the State of Michigan?
Percentage of Immigrants from China in Michigan is 0.40%.
What is the Percentage of Immigrants from China in the United States?
Percentage of Immigrants from China in the United States is 0.85%.