Cities with the Highest Percentage of Immigrants from China in Texas
RELATED REPORTS & OPTIONS
China
Texas
Compare Cities
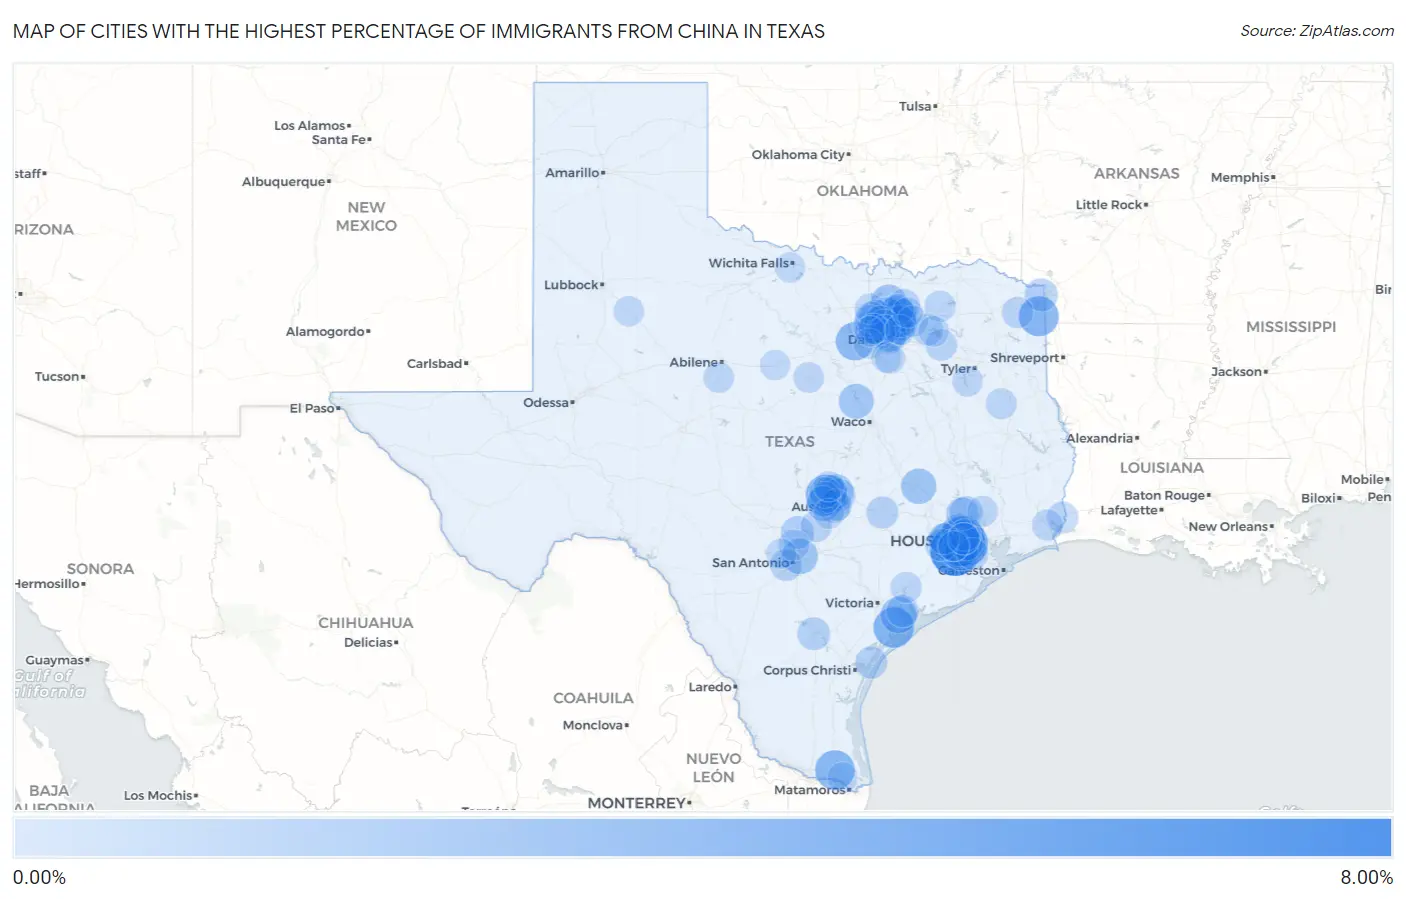
Map of Cities with the Highest Percentage of Immigrants from China in Texas
0.00%
8.00%
Cities with the Highest Percentage of Immigrants from China in Texas
| City | China | vs State | vs National | |
| 1. | Sugar Land | 7.74% | 0.52%(+7.21)#1 | 0.85%(+6.88)#119 |
| 2. | Bellaire | 6.36% | 0.52%(+5.84)#2 | 0.85%(+5.51)#176 |
| 3. | Hedwig Village | 5.82% | 0.52%(+5.30)#3 | 0.85%(+4.96)#210 |
| 4. | Meadows Place | 4.79% | 0.52%(+4.27)#4 | 0.85%(+3.93)#276 |
| 5. | Volente | 4.49% | 0.52%(+3.97)#5 | 0.85%(+3.64)#310 |
| 6. | Seadrift | 4.31% | 0.52%(+3.79)#6 | 0.85%(+3.46)#331 |
| 7. | Atlanta | 4.11% | 0.52%(+3.58)#7 | 0.85%(+3.25)#349 |
| 8. | Palm Valley | 4.00% | 0.52%(+3.47)#8 | 0.85%(+3.14)#362 |
| 9. | Allen | 3.65% | 0.52%(+3.13)#9 | 0.85%(+2.79)#410 |
| 10. | Westover Hills | 3.61% | 0.52%(+3.09)#10 | 0.85%(+2.76)#420 |
| 11. | Piney Point Village | 3.53% | 0.52%(+3.01)#11 | 0.85%(+2.68)#434 |
| 12. | Cinco Ranch | 3.48% | 0.52%(+2.96)#12 | 0.85%(+2.63)#439 |
| 13. | Plano | 3.20% | 0.52%(+2.68)#13 | 0.85%(+2.35)#494 |
| 14. | West University Place | 2.93% | 0.52%(+2.41)#14 | 0.85%(+2.08)#550 |
| 15. | Richardson | 2.82% | 0.52%(+2.30)#15 | 0.85%(+1.97)#588 |
| 16. | Port Lavaca | 2.78% | 0.52%(+2.26)#16 | 0.85%(+1.93)#601 |
| 17. | Celina | 2.63% | 0.52%(+2.11)#17 | 0.85%(+1.78)#633 |
| 18. | Windcrest | 2.59% | 0.52%(+2.07)#18 | 0.85%(+1.74)#645 |
| 19. | Stafford | 2.51% | 0.52%(+1.99)#19 | 0.85%(+1.66)#666 |
| 20. | College Station | 2.40% | 0.52%(+1.88)#20 | 0.85%(+1.55)#696 |
| 21. | Laguna Park | 2.28% | 0.52%(+1.76)#21 | 0.85%(+1.42)#744 |
| 22. | Coppell | 2.22% | 0.52%(+1.70)#22 | 0.85%(+1.37)#765 |
| 23. | Bee Cave | 2.06% | 0.52%(+1.54)#23 | 0.85%(+1.21)#830 |
| 24. | Jersey Village | 2.04% | 0.52%(+1.51)#24 | 0.85%(+1.18)#848 |
| 25. | Brushy Creek | 1.97% | 0.52%(+1.45)#25 | 0.85%(+1.12)#881 |
| 26. | Murphy | 1.89% | 0.52%(+1.37)#26 | 0.85%(+1.04)#934 |
| 27. | Highland Park | 1.84% | 0.52%(+1.32)#27 | 0.85%(+0.989)#957 |
| 28. | Fairview | 1.83% | 0.52%(+1.30)#28 | 0.85%(+0.971)#967 |
| 29. | Missouri City | 1.79% | 0.52%(+1.27)#29 | 0.85%(+0.940)#985 |
| 30. | Southlake | 1.70% | 0.52%(+1.18)#30 | 0.85%(+0.848)#1,048 |
| 31. | Frisco | 1.63% | 0.52%(+1.11)#31 | 0.85%(+0.776)#1,104 |
| 32. | Southside Place | 1.63% | 0.52%(+1.11)#32 | 0.85%(+0.774)#1,105 |
| 33. | Wells Branch | 1.59% | 0.52%(+1.07)#33 | 0.85%(+0.738)#1,122 |
| 34. | Wake Village | 1.59% | 0.52%(+1.07)#34 | 0.85%(+0.736)#1,123 |
| 35. | Rollingwood | 1.59% | 0.52%(+1.06)#35 | 0.85%(+0.731)#1,128 |
| 36. | Spring Branch | 1.57% | 0.52%(+1.05)#36 | 0.85%(+0.716)#1,137 |
| 37. | University Park | 1.55% | 0.52%(+1.03)#37 | 0.85%(+0.698)#1,145 |
| 38. | Hickory Creek | 1.55% | 0.52%(+1.03)#38 | 0.85%(+0.695)#1,148 |
| 39. | Shenandoah | 1.49% | 0.52%(+0.971)#39 | 0.85%(+0.639)#1,205 |
| 40. | The Woodlands | 1.49% | 0.52%(+0.970)#40 | 0.85%(+0.639)#1,207 |
| 41. | George West | 1.47% | 0.52%(+0.946)#41 | 0.85%(+0.615)#1,228 |
| 42. | Steiner Ranch | 1.40% | 0.52%(+0.875)#42 | 0.85%(+0.544)#1,291 |
| 43. | Cedar Park | 1.33% | 0.52%(+0.808)#43 | 0.85%(+0.476)#1,354 |
| 44. | Point Comfort | 1.31% | 0.52%(+0.787)#44 | 0.85%(+0.456)#1,379 |
| 45. | Parker | 1.31% | 0.52%(+0.787)#45 | 0.85%(+0.455)#1,380 |
| 46. | Hilshire Village | 1.27% | 0.52%(+0.751)#46 | 0.85%(+0.419)#1,432 |
| 47. | Mission Bend | 1.25% | 0.52%(+0.732)#47 | 0.85%(+0.400)#1,452 |
| 48. | Fulshear | 1.24% | 0.52%(+0.716)#48 | 0.85%(+0.384)#1,466 |
| 49. | Aransas Pass | 1.24% | 0.52%(+0.715)#49 | 0.85%(+0.384)#1,467 |
| 50. | Giddings | 1.24% | 0.52%(+0.712)#50 | 0.85%(+0.381)#1,469 |
| 51. | Lackland Afb | 1.23% | 0.52%(+0.706)#51 | 0.85%(+0.375)#1,482 |
| 52. | Melissa | 1.19% | 0.52%(+0.671)#52 | 0.85%(+0.339)#1,522 |
| 53. | Flower Mound | 1.15% | 0.52%(+0.629)#53 | 0.85%(+0.298)#1,573 |
| 54. | Mckinney | 1.14% | 0.52%(+0.622)#54 | 0.85%(+0.291)#1,581 |
| 55. | Pearland | 1.13% | 0.52%(+0.607)#55 | 0.85%(+0.276)#1,593 |
| 56. | Lantana | 1.09% | 0.52%(+0.570)#56 | 0.85%(+0.239)#1,639 |
| 57. | Houston | 1.09% | 0.52%(+0.563)#57 | 0.85%(+0.232)#1,653 |
| 58. | Pinehurst | 1.07% | 0.52%(+0.550)#58 | 0.85%(+0.218)#1,675 |
| 59. | Spring Valley Village | 1.07% | 0.52%(+0.543)#59 | 0.85%(+0.211)#1,686 |
| 60. | Austin | 1.06% | 0.52%(+0.534)#60 | 0.85%(+0.203)#1,703 |
| 61. | Edgewood | 1.04% | 0.52%(+0.521)#61 | 0.85%(+0.190)#1,722 |
| 62. | Hudson Bend | 1.03% | 0.52%(+0.512)#62 | 0.85%(+0.180)#1,735 |
| 63. | Wimberley | 0.98% | 0.52%(+0.456)#63 | 0.85%(+0.125)#1,828 |
| 64. | Marietta | 0.97% | 0.52%(+0.448)#64 | 0.85%(+0.116)#1,836 |
| 65. | Quinlan | 0.95% | 0.52%(+0.429)#65 | 0.85%(+0.098)#1,876 |
| 66. | Nevada | 0.94% | 0.52%(+0.416)#66 | 0.85%(+0.085)#1,898 |
| 67. | Commerce | 0.90% | 0.52%(+0.380)#67 | 0.85%(+0.049)#1,961 |
| 68. | Central Gardens | 0.88% | 0.52%(+0.359)#68 | 0.85%(+0.028)#1,994 |
| 69. | Ganado | 0.86% | 0.52%(+0.340)#69 | 0.85%(+0.008)#2,036 |
| 70. | Lewisville | 0.85% | 0.52%(+0.324)#70 | 0.85%(-0.007)#2,068 |
| 71. | Katy | 0.84% | 0.52%(+0.318)#71 | 0.85%(-0.013)#2,078 |
| 72. | The Hills | 0.84% | 0.52%(+0.315)#72 | 0.85%(-0.016)#2,087 |
| 73. | Cushing | 0.83% | 0.52%(+0.307)#73 | 0.85%(-0.025)#2,101 |
| 74. | Timberwood Park | 0.80% | 0.52%(+0.277)#74 | 0.85%(-0.055)#2,167 |
| 75. | Jonestown | 0.79% | 0.52%(+0.270)#75 | 0.85%(-0.061)#2,182 |
| 76. | Carrollton | 0.78% | 0.52%(+0.258)#76 | 0.85%(-0.073)#2,203 |
| 77. | Patton Village | 0.78% | 0.52%(+0.253)#77 | 0.85%(-0.078)#2,217 |
| 78. | Irving | 0.76% | 0.52%(+0.239)#78 | 0.85%(-0.092)#2,253 |
| 79. | West Tawakoni | 0.76% | 0.52%(+0.237)#79 | 0.85%(-0.094)#2,258 |
| 80. | Stephenville | 0.73% | 0.52%(+0.209)#80 | 0.85%(-0.122)#2,328 |
| 81. | Emerald Bay | 0.72% | 0.52%(+0.199)#81 | 0.85%(-0.132)#2,355 |
| 82. | Tuscola | 0.72% | 0.52%(+0.194)#82 | 0.85%(-0.137)#2,369 |
| 83. | Denton | 0.70% | 0.52%(+0.175)#83 | 0.85%(-0.156)#2,416 |
| 84. | Post | 0.69% | 0.52%(+0.168)#84 | 0.85%(-0.164)#2,432 |
| 85. | Farmers Branch | 0.64% | 0.52%(+0.119)#85 | 0.85%(-0.212)#2,561 |
| 86. | Lakeside City | 0.64% | 0.52%(+0.118)#86 | 0.85%(-0.213)#2,564 |
| 87. | Pantego | 0.63% | 0.52%(+0.109)#87 | 0.85%(-0.222)#2,591 |
| 88. | Grapevine | 0.63% | 0.52%(+0.109)#88 | 0.85%(-0.222)#2,593 |
| 89. | Garland | 0.63% | 0.52%(+0.107)#89 | 0.85%(-0.224)#2,599 |
| 90. | Princeton | 0.63% | 0.52%(+0.106)#90 | 0.85%(-0.225)#2,611 |
| 91. | Colleyville | 0.63% | 0.52%(+0.103)#91 | 0.85%(-0.228)#2,621 |
| 92. | Eastland | 0.61% | 0.52%(+0.083)#92 | 0.85%(-0.248)#2,673 |
| 93. | Oak Leaf | 0.60% | 0.52%(+0.082)#93 | 0.85%(-0.249)#2,677 |
| 94. | Shady Hollow | 0.60% | 0.52%(+0.080)#94 | 0.85%(-0.251)#2,680 |
| 95. | Four Corners | 0.60% | 0.52%(+0.076)#95 | 0.85%(-0.255)#2,694 |
| 96. | Belterra | 0.60% | 0.52%(+0.076)#96 | 0.85%(-0.255)#2,697 |
| 97. | Leander | 0.60% | 0.52%(+0.075)#97 | 0.85%(-0.256)#2,698 |
| 98. | Palmer | 0.59% | 0.52%(+0.068)#98 | 0.85%(-0.263)#2,727 |
| 99. | Helotes | 0.59% | 0.52%(+0.068)#99 | 0.85%(-0.264)#2,728 |
| 100. | Pecan Hill | 0.58% | 0.52%(+0.061)#100 | 0.85%(-0.270)#2,744 |
Common Questions
What are the Top 10 Cities with the Highest Percentage of Immigrants from China in Texas?
Top 10 Cities with the Highest Percentage of Immigrants from China in Texas are:
#1
7.74%
#2
6.36%
#3
5.82%
#4
4.79%
#5
4.49%
#6
4.31%
#7
4.11%
#8
4.00%
#9
3.65%
#10
3.61%
What city has the Highest Percentage of Immigrants from China in Texas?
Sugar Land has the Highest Percentage of Immigrants from China in Texas with 7.74%.
What is the Percentage of Immigrants from China in the State of Texas?
Percentage of Immigrants from China in Texas is 0.52%.
What is the Percentage of Immigrants from China in the United States?
Percentage of Immigrants from China in the United States is 0.85%.