Cities with the Highest Percentage of Population Employed in Health Diagnosing & Treating in Montana
RELATED REPORTS & OPTIONS
Health Diagnosing & Treating
Montana
Compare Cities
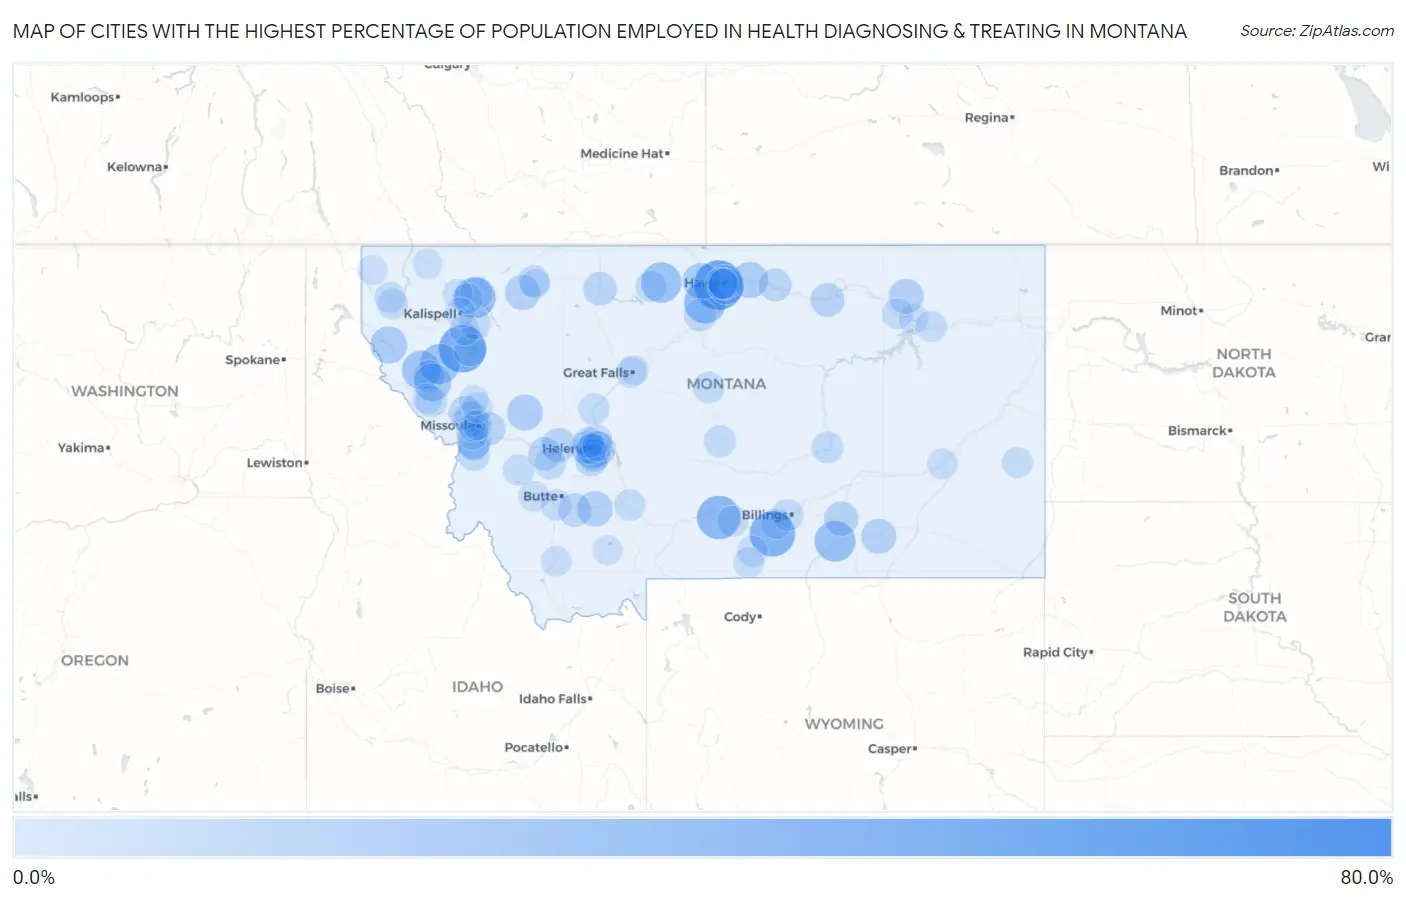
Map of Cities with the Highest Percentage of Population Employed in Health Diagnosing & Treating in Montana
0.0%
80.0%
Cities with the Highest Percentage of Population Employed in Health Diagnosing & Treating in Montana
| City | % Employed | vs State | vs National | |
| 1. | Glacier Colony | 61.1% | 6.6%(+54.6)#1 | 6.2%(+54.9)#40 |
| 2. | Hardy | 47.1% | 6.6%(+40.5)#2 | 6.2%(+40.8)#91 |
| 3. | Herron | 44.4% | 6.6%(+37.9)#3 | 6.2%(+38.2)#112 |
| 4. | Mcallister | 43.5% | 6.6%(+36.9)#4 | 6.2%(+37.2)#114 |
| 5. | Big Arm | 40.4% | 6.6%(+33.8)#5 | 6.2%(+34.1)#141 |
| 6. | Silesia | 36.4% | 6.6%(+29.8)#6 | 6.2%(+30.1)#178 |
| 7. | Vida | 33.3% | 6.6%(+26.8)#7 | 6.2%(+27.1)#234 |
| 8. | Greycliff | 32.5% | 6.6%(+25.9)#8 | 6.2%(+26.3)#252 |
| 9. | Box Elder | 28.9% | 6.6%(+22.4)#9 | 6.2%(+22.7)#319 |
| 10. | Hungry Horse | 28.0% | 6.6%(+21.4)#10 | 6.2%(+21.8)#355 |
| 11. | St Xavier | 26.9% | 6.6%(+20.4)#11 | 6.2%(+20.7)#376 |
| 12. | Joplin | 26.3% | 6.6%(+19.8)#12 | 6.2%(+20.1)#394 |
| 13. | Hot Springs | 25.4% | 6.6%(+18.9)#13 | 6.2%(+19.2)#425 |
| 14. | Weeksville | 22.8% | 6.6%(+16.2)#14 | 6.2%(+16.6)#560 |
| 15. | Paradise | 21.1% | 6.6%(+14.5)#15 | 6.2%(+14.8)#657 |
| 16. | Trout Creek | 19.4% | 6.6%(+12.9)#16 | 6.2%(+13.2)#800 |
| 17. | Kremlin | 19.2% | 6.6%(+12.7)#17 | 6.2%(+13.0)#818 |
| 18. | Chinook | 18.0% | 6.6%(+11.4)#18 | 6.2%(+11.8)#957 |
| 19. | Saddle Butte | 17.6% | 6.6%(+11.1)#19 | 6.2%(+11.4)#992 |
| 20. | Ovando | 17.4% | 6.6%(+10.8)#20 | 6.2%(+11.1)#1,021 |
| 21. | East Helena | 17.2% | 6.6%(+10.7)#21 | 6.2%(+11.0)#1,049 |
| 22. | Cardwell | 16.7% | 6.6%(+10.1)#22 | 6.2%(+10.4)#1,157 |
| 23. | Busby | 15.8% | 6.6%(+9.19)#23 | 6.2%(+9.51)#1,341 |
| 24. | East Glacier Park Village | 15.7% | 6.6%(+9.19)#24 | 6.2%(+9.50)#1,342 |
| 25. | South Hills | 15.5% | 6.6%(+8.94)#25 | 6.2%(+9.25)#1,395 |
| 26. | St Marie | 15.3% | 6.6%(+8.73)#26 | 6.2%(+9.05)#1,447 |
| 27. | Rimini | 15.1% | 6.6%(+8.53)#27 | 6.2%(+8.85)#1,488 |
| 28. | Havre North | 15.0% | 6.6%(+8.49)#28 | 6.2%(+8.80)#1,494 |
| 29. | Wye | 14.8% | 6.6%(+8.21)#29 | 6.2%(+8.53)#1,560 |
| 30. | Carlton | 14.5% | 6.6%(+7.96)#30 | 6.2%(+8.28)#1,640 |
| 31. | Hardin | 14.2% | 6.6%(+7.65)#31 | 6.2%(+7.96)#1,743 |
| 32. | Avon | 14.0% | 6.6%(+7.44)#32 | 6.2%(+7.76)#1,809 |
| 33. | Raynesford | 13.8% | 6.6%(+7.23)#33 | 6.2%(+7.55)#1,874 |
| 34. | York | 13.7% | 6.6%(+7.13)#34 | 6.2%(+7.45)#1,920 |
| 35. | Luther | 13.3% | 6.6%(+6.77)#35 | 6.2%(+7.09)#2,057 |
| 36. | Malta | 13.2% | 6.6%(+6.68)#36 | 6.2%(+6.99)#2,085 |
| 37. | Shelby | 13.1% | 6.6%(+6.49)#37 | 6.2%(+6.81)#2,156 |
| 38. | Rader Creek | 12.8% | 6.6%(+6.26)#38 | 6.2%(+6.58)#2,277 |
| 39. | Turah | 12.6% | 6.6%(+6.08)#39 | 6.2%(+6.40)#2,359 |
| 40. | Garrison | 12.5% | 6.6%(+5.94)#40 | 6.2%(+6.26)#2,435 |
| 41. | Montana City | 12.4% | 6.6%(+5.83)#41 | 6.2%(+6.14)#2,487 |
| 42. | Frenchtown | 12.1% | 6.6%(+5.58)#42 | 6.2%(+5.90)#2,607 |
| 43. | Harlem | 11.7% | 6.6%(+5.09)#43 | 6.2%(+5.41)#2,866 |
| 44. | Kings Point | 11.4% | 6.6%(+4.89)#44 | 6.2%(+5.20)#3,032 |
| 45. | Helena West Side | 11.4% | 6.6%(+4.79)#45 | 6.2%(+5.11)#3,093 |
| 46. | Clancy | 10.9% | 6.6%(+4.33)#46 | 6.2%(+4.64)#3,394 |
| 47. | Big Sandy | 10.8% | 6.6%(+4.24)#47 | 6.2%(+4.56)#3,473 |
| 48. | Coram | 10.8% | 6.6%(+4.22)#48 | 6.2%(+4.54)#3,485 |
| 49. | Plains | 10.3% | 6.6%(+3.70)#49 | 6.2%(+4.01)#3,956 |
| 50. | Judith Gap | 10.2% | 6.6%(+3.61)#50 | 6.2%(+3.92)#4,051 |
| 51. | Stevensville | 10.2% | 6.6%(+3.59)#51 | 6.2%(+3.91)#4,066 |
| 52. | Florence | 10.1% | 6.6%(+3.54)#52 | 6.2%(+3.85)#4,109 |
| 53. | North Browning | 9.9% | 6.6%(+3.32)#53 | 6.2%(+3.63)#4,337 |
| 54. | Melstone | 9.8% | 6.6%(+3.20)#54 | 6.2%(+3.51)#4,488 |
| 55. | Riverbend | 9.6% | 6.6%(+3.04)#55 | 6.2%(+3.35)#4,653 |
| 56. | Denton | 9.4% | 6.6%(+2.79)#56 | 6.2%(+3.11)#4,962 |
| 57. | West Havre | 9.2% | 6.6%(+2.64)#57 | 6.2%(+2.95)#5,133 |
| 58. | Billings | 9.1% | 6.6%(+2.56)#58 | 6.2%(+2.88)#5,233 |
| 59. | Chester | 9.1% | 6.6%(+2.53)#59 | 6.2%(+2.85)#5,277 |
| 60. | Gallatin River Ranch | 9.1% | 6.6%(+2.53)#60 | 6.2%(+2.85)#5,295 |
| 61. | Helena Valley Northeast | 9.0% | 6.6%(+2.44)#61 | 6.2%(+2.75)#5,432 |
| 62. | Deer Lodge | 9.0% | 6.6%(+2.43)#62 | 6.2%(+2.75)#5,438 |
| 63. | Bigfork | 9.0% | 6.6%(+2.43)#63 | 6.2%(+2.75)#5,442 |
| 64. | Lolo | 9.0% | 6.6%(+2.41)#64 | 6.2%(+2.72)#5,473 |
| 65. | Craig | 8.7% | 6.6%(+2.14)#65 | 6.2%(+2.45)#5,869 |
| 66. | Philipsburg | 8.6% | 6.6%(+2.04)#66 | 6.2%(+2.35)#6,015 |
| 67. | Glasgow | 8.4% | 6.6%(+1.86)#67 | 6.2%(+2.18)#6,288 |
| 68. | Frazer | 8.3% | 6.6%(+1.77)#68 | 6.2%(+2.09)#6,422 |
| 69. | Butte Silver Bow Balance | 8.3% | 6.6%(+1.74)#69 | 6.2%(+2.06)#6,485 |
| 70. | Reed Point | 8.1% | 6.6%(+1.58)#70 | 6.2%(+1.89)#6,749 |
| 71. | Roberts | 8.0% | 6.6%(+1.44)#71 | 6.2%(+1.76)#6,997 |
| 72. | Libby | 8.0% | 6.6%(+1.42)#72 | 6.2%(+1.73)#7,033 |
| 73. | Plevna | 7.9% | 6.6%(+1.33)#73 | 6.2%(+1.65)#7,185 |
| 74. | Helena Valley West Central | 7.8% | 6.6%(+1.27)#74 | 6.2%(+1.58)#7,328 |
| 75. | Pioneer Junction | 7.7% | 6.6%(+1.16)#75 | 6.2%(+1.48)#7,526 |
| 76. | Miles City | 7.7% | 6.6%(+1.10)#76 | 6.2%(+1.42)#7,650 |
| 77. | Columbia Falls | 7.6% | 6.6%(+1.08)#77 | 6.2%(+1.40)#7,703 |
| 78. | Laurel | 7.6% | 6.6%(+1.05)#78 | 6.2%(+1.37)#7,765 |
| 79. | Great Falls | 7.6% | 6.6%(+1.04)#79 | 6.2%(+1.36)#7,796 |
| 80. | Anaconda Deer Lodge County | 7.6% | 6.6%(+0.999)#80 | 6.2%(+1.31)#7,876 |
| 81. | Orchard Homes | 7.5% | 6.6%(+0.987)#81 | 6.2%(+1.30)#7,901 |
| 82. | Helena | 7.5% | 6.6%(+0.978)#82 | 6.2%(+1.29)#7,917 |
| 83. | Red Lodge | 7.5% | 6.6%(+0.975)#83 | 6.2%(+1.29)#7,923 |
| 84. | Evaro | 7.2% | 6.6%(+0.686)#84 | 6.2%(+1.00)#8,607 |
| 85. | Dillon | 7.1% | 6.6%(+0.536)#85 | 6.2%(+0.852)#8,935 |
| 86. | Lakeside | 7.0% | 6.6%(+0.431)#86 | 6.2%(+0.746)#9,186 |
| 87. | Superior | 7.0% | 6.6%(+0.408)#87 | 6.2%(+0.724)#9,251 |
| 88. | Essex | 6.9% | 6.6%(+0.336)#88 | 6.2%(+0.652)#9,448 |
| 89. | Missoula | 6.9% | 6.6%(+0.318)#89 | 6.2%(+0.634)#9,480 |
| 90. | Havre | 6.6% | 6.6%(+0.026)#90 | 6.2%(+0.341)#10,220 |
| 91. | Ennis | 6.5% | 6.6%(-0.044)#91 | 6.2%(+0.271)#10,404 |
| 92. | Fortine | 6.5% | 6.6%(-0.067)#92 | 6.2%(+0.249)#10,461 |
| 93. | Black Eagle | 6.5% | 6.6%(-0.076)#93 | 6.2%(+0.240)#10,483 |
| 94. | Nashua | 6.5% | 6.6%(-0.079)#94 | 6.2%(+0.237)#10,488 |
| 95. | Whitefish | 6.5% | 6.6%(-0.090)#95 | 6.2%(+0.226)#10,515 |
| 96. | Sylvanite | 6.5% | 6.6%(-0.109)#96 | 6.2%(+0.207)#10,594 |
| 97. | Helena Valley Southeast | 6.4% | 6.6%(-0.134)#97 | 6.2%(+0.181)#10,656 |
| 98. | Kalispell | 6.4% | 6.6%(-0.139)#98 | 6.2%(+0.176)#10,668 |
| 99. | South Browning | 6.4% | 6.6%(-0.147)#99 | 6.2%(+0.168)#10,686 |
| 100. | Arlee | 6.3% | 6.6%(-0.267)#100 | 6.2%(+0.049)#10,988 |
Common Questions
What are the Top 10 Cities with the Highest Percentage of Population Employed in Health Diagnosing & Treating in Montana?
Top 10 Cities with the Highest Percentage of Population Employed in Health Diagnosing & Treating in Montana are:
#1
44.4%
#2
40.4%
#3
36.4%
#4
32.5%
#5
28.9%
#6
28.0%
#7
26.9%
#8
26.3%
#9
25.4%
#10
22.8%
What city has the Highest Percentage of Population Employed in Health Diagnosing & Treating in Montana?
Herron has the Highest Percentage of Population Employed in Health Diagnosing & Treating in Montana with 44.4%.
What is the Percentage of Population Employed in Health Diagnosing & Treating in the State of Montana?
Percentage of Population Employed in Health Diagnosing & Treating in Montana is 6.6%.
What is the Percentage of Population Employed in Health Diagnosing & Treating in the United States?
Percentage of Population Employed in Health Diagnosing & Treating in the United States is 6.2%.