Zip Codes with the Highest Percentage of Population Employed in Health Diagnosing & Treating in Silver Spring, MD
RELATED REPORTS & OPTIONS
Health Diagnosing & Treating
Silver Spring
Compare Zip Codes
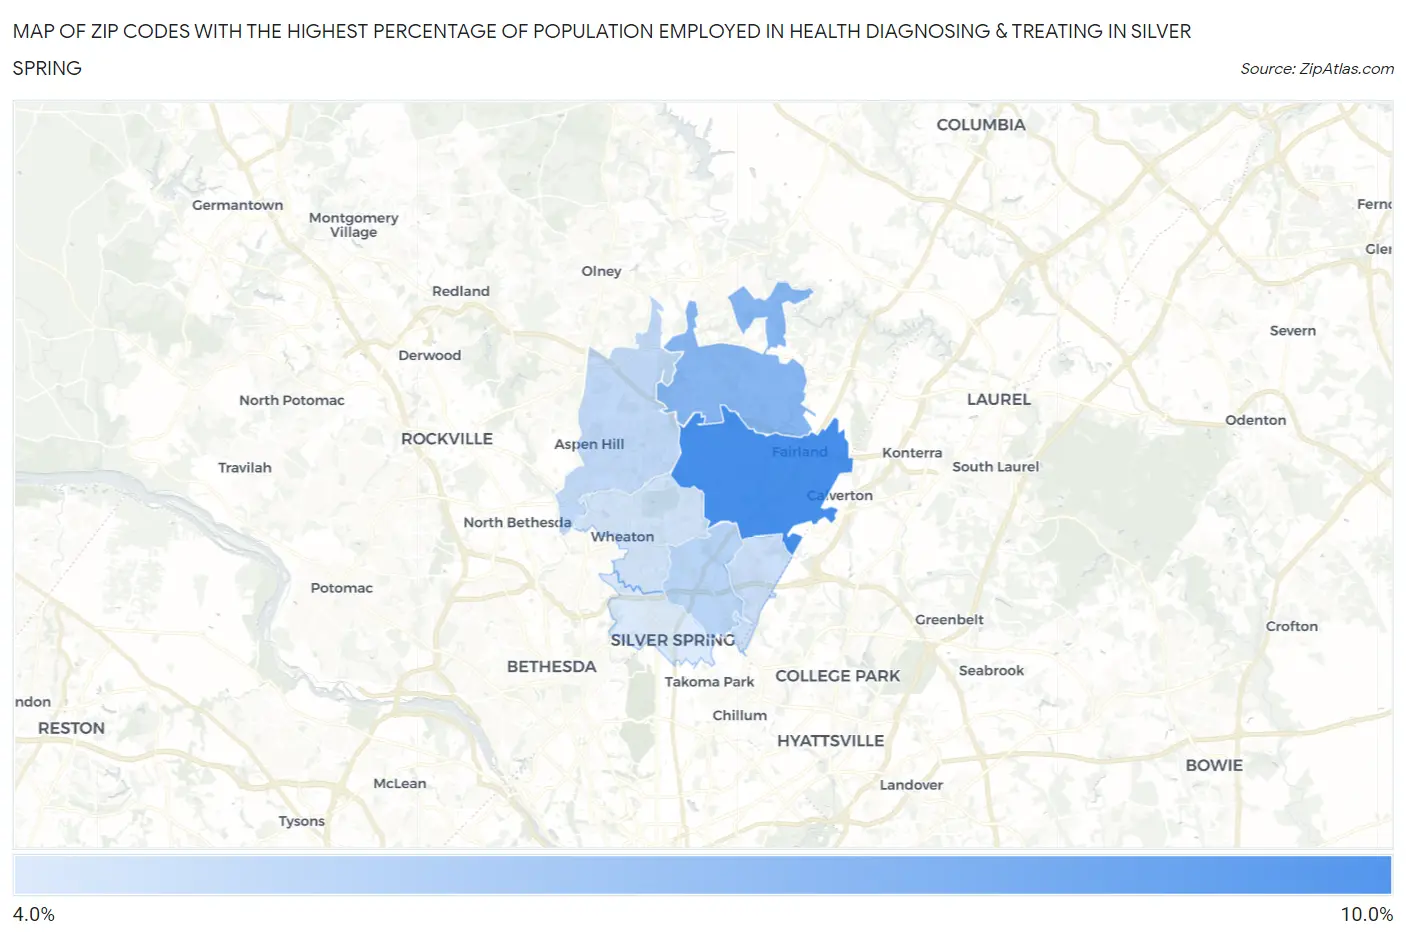
Map of Zip Codes with the Highest Percentage of Population Employed in Health Diagnosing & Treating in Silver Spring
0.0%
10.0%
Zip Codes with the Highest Percentage of Population Employed in Health Diagnosing & Treating in Silver Spring, MD
| Zip Code | % Employed | vs State | vs National | |
| 1. | 20904 | 8.2% | 6.2%(+1.97)#111 | 6.2%(+1.93)#7,065 |
| 2. | 20905 | 6.4% | 6.2%(+0.145)#184 | 6.2%(+0.107)#12,559 |
| 3. | 20901 | 5.0% | 6.2%(-1.22)#267 | 6.2%(-1.26)#17,787 |
| 4. | 20906 | 4.8% | 6.2%(-1.39)#274 | 6.2%(-1.42)#18,422 |
| 5. | 20903 | 4.6% | 6.2%(-1.63)#281 | 6.2%(-1.66)#19,330 |
| 6. | 20902 | 4.3% | 6.2%(-1.87)#295 | 6.2%(-1.91)#20,224 |
| 7. | 20910 | 4.1% | 6.2%(-2.16)#314 | 6.2%(-2.19)#21,207 |
1
Common Questions
What are the Top 5 Zip Codes with the Highest Percentage of Population Employed in Health Diagnosing & Treating in Silver Spring, MD?
Top 5 Zip Codes with the Highest Percentage of Population Employed in Health Diagnosing & Treating in Silver Spring, MD are:
What zip code has the Highest Percentage of Population Employed in Health Diagnosing & Treating in Silver Spring, MD?
20904 has the Highest Percentage of Population Employed in Health Diagnosing & Treating in Silver Spring, MD with 8.2%.
What is the Percentage of Population Employed in Health Diagnosing & Treating in Silver Spring, MD?
Percentage of Population Employed in Health Diagnosing & Treating in Silver Spring is 3.8%.
What is the Percentage of Population Employed in Health Diagnosing & Treating in Maryland?
Percentage of Population Employed in Health Diagnosing & Treating in Maryland is 6.2%.
What is the Percentage of Population Employed in Health Diagnosing & Treating in the United States?
Percentage of Population Employed in Health Diagnosing & Treating in the United States is 6.2%.