Cities with the Highest Percentage of Population Employed in Health Diagnosing & Treating in Pennsylvania
RELATED REPORTS & OPTIONS
Health Diagnosing & Treating
Pennsylvania
Compare Cities
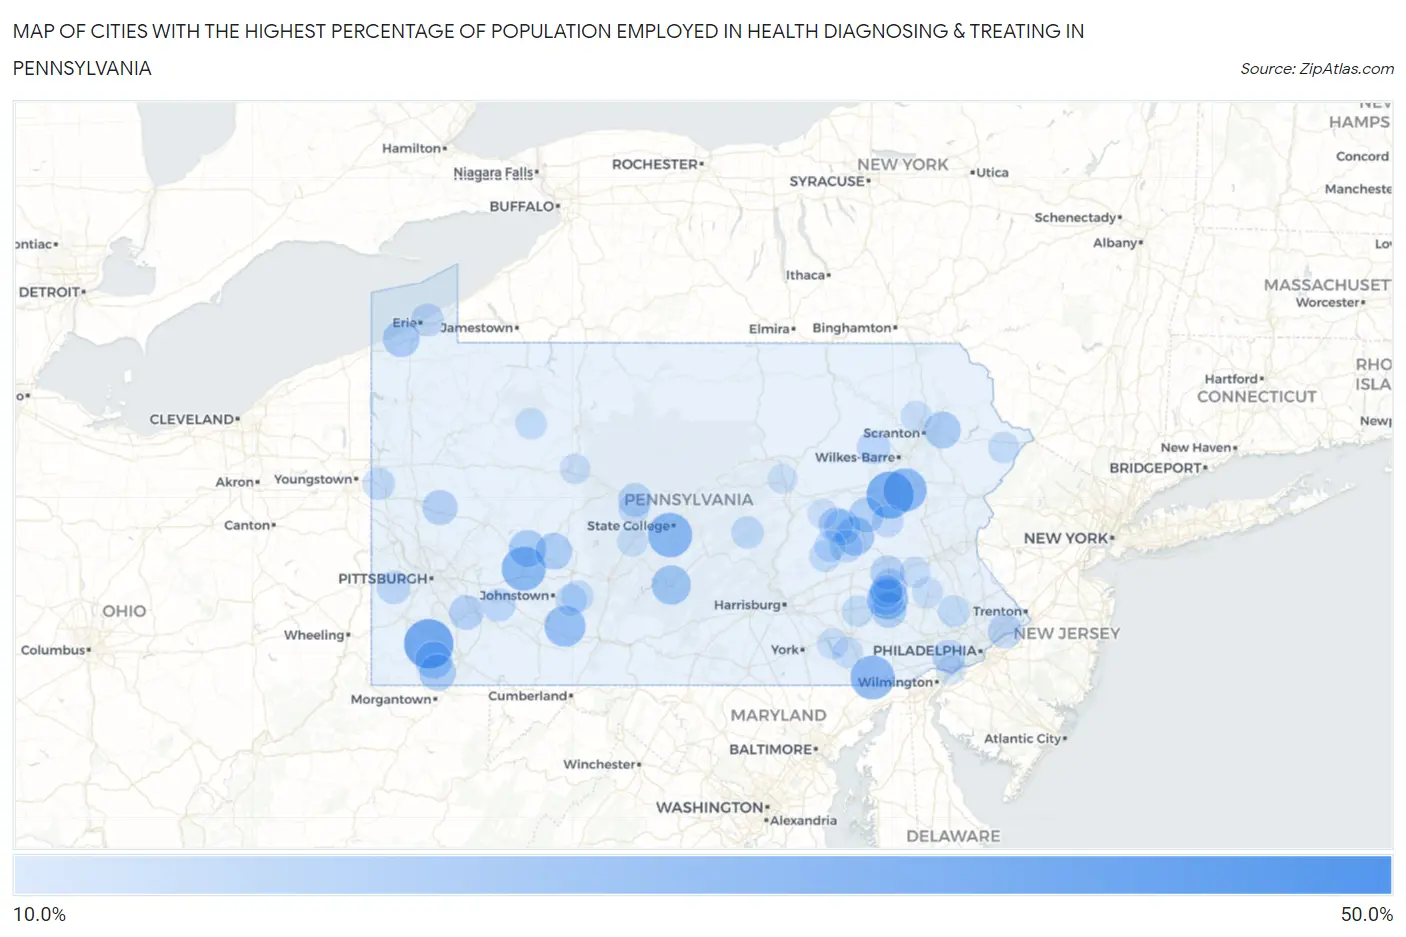
Map of Cities with the Highest Percentage of Population Employed in Health Diagnosing & Treating in Pennsylvania
0.0%
50.0%
Cities with the Highest Percentage of Population Employed in Health Diagnosing & Treating in Pennsylvania
| City | % Employed | vs State | vs National | |
| 1. | Green Hills Borough | 50.0% | 7.4%(+42.6)#1 | 6.2%(+43.8)#85 |
| 2. | Fredericktown | 38.9% | 7.4%(+31.5)#2 | 6.2%(+32.6)#153 |
| 3. | Sunbrook | 36.8% | 7.4%(+29.5)#3 | 6.2%(+30.6)#172 |
| 4. | Lattimer | 35.8% | 7.4%(+28.5)#4 | 6.2%(+29.6)#187 |
| 5. | Jacksonville Cdp Centre County | 35.0% | 7.4%(+27.6)#5 | 6.2%(+28.8)#202 |
| 6. | Pine Grove Mills | 32.4% | 7.4%(+25.0)#6 | 6.2%(+26.1)#259 |
| 7. | Coral | 32.1% | 7.4%(+24.7)#7 | 6.2%(+25.8)#264 |
| 8. | Callimont Borough | 31.8% | 7.4%(+24.5)#8 | 6.2%(+25.6)#274 |
| 9. | Little Britain | 31.7% | 7.4%(+24.3)#9 | 6.2%(+25.4)#276 |
| 10. | Hickory Hills | 31.2% | 7.4%(+23.9)#10 | 6.2%(+25.0)#286 |
| 11. | Dixonville | 29.7% | 7.4%(+22.4)#11 | 6.2%(+23.5)#311 |
| 12. | Danville Borough | 29.7% | 7.4%(+22.4)#12 | 6.2%(+23.5)#312 |
| 13. | Montrose Manor | 28.5% | 7.4%(+21.1)#13 | 6.2%(+22.3)#339 |
| 14. | Cairnbrook | 28.3% | 7.4%(+20.9)#14 | 6.2%(+22.0)#348 |
| 15. | Stillwater Borough | 28.0% | 7.4%(+20.7)#15 | 6.2%(+21.8)#353 |
| 16. | Newburg Borough Clearfield County | 28.0% | 7.4%(+20.6)#16 | 6.2%(+21.8)#356 |
| 17. | Jeddo Borough | 27.2% | 7.4%(+19.8)#17 | 6.2%(+20.9)#369 |
| 18. | Cassville Borough | 26.6% | 7.4%(+19.2)#18 | 6.2%(+20.3)#387 |
| 19. | Canoe Creek | 26.4% | 7.4%(+19.1)#19 | 6.2%(+20.2)#392 |
| 20. | Cedar Crest | 25.9% | 7.4%(+18.6)#20 | 6.2%(+19.7)#414 |
| 21. | Heckscherville | 25.2% | 7.4%(+17.9)#21 | 6.2%(+19.0)#430 |
| 22. | Chevy Chase Heights | 23.7% | 7.4%(+16.3)#22 | 6.2%(+17.4)#509 |
| 23. | Fairdale | 23.3% | 7.4%(+15.9)#23 | 6.2%(+17.0)#532 |
| 24. | Fairview | 23.0% | 7.4%(+15.7)#24 | 6.2%(+16.8)#547 |
| 25. | Runville | 23.0% | 7.4%(+15.6)#25 | 6.2%(+16.7)#549 |
| 26. | Mount Cobb | 22.9% | 7.4%(+15.6)#26 | 6.2%(+16.7)#552 |
| 27. | Heilwood | 22.9% | 7.4%(+15.6)#27 | 6.2%(+16.7)#553 |
| 28. | Mapletown | 22.7% | 7.4%(+15.4)#28 | 6.2%(+16.5)#566 |
| 29. | Salona | 22.3% | 7.4%(+15.0)#29 | 6.2%(+16.1)#585 |
| 30. | Locustdale | 21.9% | 7.4%(+14.6)#30 | 6.2%(+15.7)#607 |
| 31. | Hookstown Borough | 21.6% | 7.4%(+14.2)#31 | 6.2%(+15.3)#627 |
| 32. | Alleghenyville | 21.4% | 7.4%(+14.0)#32 | 6.2%(+15.1)#637 |
| 33. | Plumville Borough | 21.3% | 7.4%(+14.0)#33 | 6.2%(+15.1)#638 |
| 34. | Brandonville | 21.2% | 7.4%(+13.8)#34 | 6.2%(+14.9)#648 |
| 35. | Shanor Northvue | 20.9% | 7.4%(+13.5)#35 | 6.2%(+14.6)#672 |
| 36. | Lincoln Park | 20.8% | 7.4%(+13.5)#36 | 6.2%(+14.6)#673 |
| 37. | Atlas | 20.8% | 7.4%(+13.4)#37 | 6.2%(+14.5)#685 |
| 38. | Yukon | 20.4% | 7.4%(+13.0)#38 | 6.2%(+14.1)#716 |
| 39. | Riverview Park | 20.2% | 7.4%(+12.8)#39 | 6.2%(+13.9)#724 |
| 40. | Sylvan Hills | 20.1% | 7.4%(+12.8)#40 | 6.2%(+13.9)#728 |
| 41. | Eddington | 20.1% | 7.4%(+12.7)#41 | 6.2%(+13.9)#730 |
| 42. | Mohrsville | 20.0% | 7.4%(+12.6)#42 | 6.2%(+13.8)#741 |
| 43. | Juniata Terrace Borough | 19.7% | 7.4%(+12.4)#43 | 6.2%(+13.5)#774 |
| 44. | Allport | 19.2% | 7.4%(+11.9)#44 | 6.2%(+13.0)#819 |
| 45. | Holters Crossing | 19.0% | 7.4%(+11.6)#45 | 6.2%(+12.7)#844 |
| 46. | Rose Valley Borough | 19.0% | 7.4%(+11.6)#46 | 6.2%(+12.7)#847 |
| 47. | Bulger | 18.9% | 7.4%(+11.6)#47 | 6.2%(+12.7)#850 |
| 48. | Manor Borough | 18.8% | 7.4%(+11.5)#48 | 6.2%(+12.6)#857 |
| 49. | Pikes Creek | 18.8% | 7.4%(+11.4)#49 | 6.2%(+12.5)#861 |
| 50. | Lima | 18.8% | 7.4%(+11.4)#50 | 6.2%(+12.5)#863 |
| 51. | Eldorado | 18.7% | 7.4%(+11.4)#51 | 6.2%(+12.5)#871 |
| 52. | Hostetter | 18.7% | 7.4%(+11.3)#52 | 6.2%(+12.4)#876 |
| 53. | Fox Chapel Borough | 18.4% | 7.4%(+11.1)#53 | 6.2%(+12.2)#901 |
| 54. | Bear Creek Village Borough | 18.4% | 7.4%(+11.1)#54 | 6.2%(+12.2)#905 |
| 55. | Lawrence Park | 18.4% | 7.4%(+11.0)#55 | 6.2%(+12.1)#909 |
| 56. | Spring Ridge | 18.3% | 7.4%(+10.9)#56 | 6.2%(+12.1)#917 |
| 57. | Newtown | 18.0% | 7.4%(+10.7)#57 | 6.2%(+11.8)#956 |
| 58. | Beaver Springs | 17.9% | 7.4%(+10.5)#58 | 6.2%(+11.6)#968 |
| 59. | Frizzleburg | 17.8% | 7.4%(+10.4)#59 | 6.2%(+11.6)#977 |
| 60. | Laflin Borough | 17.6% | 7.4%(+10.2)#60 | 6.2%(+11.3)#1,004 |
| 61. | Penn Farms | 17.5% | 7.4%(+10.2)#61 | 6.2%(+11.3)#1,007 |
| 62. | Sankertown Borough | 17.4% | 7.4%(+10.1)#62 | 6.2%(+11.2)#1,016 |
| 63. | North East Borough | 17.4% | 7.4%(+10.0)#63 | 6.2%(+11.1)#1,022 |
| 64. | Rural Valley Borough | 17.4% | 7.4%(+10.0)#64 | 6.2%(+11.1)#1,028 |
| 65. | Beaverdale | 17.2% | 7.4%(+9.88)#65 | 6.2%(+11.0)#1,048 |
| 66. | Hometown | 17.2% | 7.4%(+9.82)#66 | 6.2%(+10.9)#1,057 |
| 67. | Gray | 17.1% | 7.4%(+9.79)#67 | 6.2%(+10.9)#1,063 |
| 68. | Skippack | 17.1% | 7.4%(+9.77)#68 | 6.2%(+10.9)#1,067 |
| 69. | Marklesburg Borough | 17.0% | 7.4%(+9.66)#69 | 6.2%(+10.8)#1,082 |
| 70. | Rainsburg Borough | 17.0% | 7.4%(+9.63)#70 | 6.2%(+10.7)#1,087 |
| 71. | Salix | 17.0% | 7.4%(+9.62)#71 | 6.2%(+10.7)#1,089 |
| 72. | Orrstown Borough | 16.9% | 7.4%(+9.54)#72 | 6.2%(+10.6)#1,107 |
| 73. | Reinerton | 16.9% | 7.4%(+9.52)#73 | 6.2%(+10.6)#1,112 |
| 74. | Greensboro Borough | 16.9% | 7.4%(+9.51)#74 | 6.2%(+10.6)#1,114 |
| 75. | Hegins | 16.8% | 7.4%(+9.46)#75 | 6.2%(+10.6)#1,120 |
| 76. | Clay | 16.7% | 7.4%(+9.34)#76 | 6.2%(+10.4)#1,140 |
| 77. | Marienville | 16.7% | 7.4%(+9.32)#77 | 6.2%(+10.4)#1,142 |
| 78. | Jennerstown Borough | 16.6% | 7.4%(+9.29)#78 | 6.2%(+10.4)#1,163 |
| 79. | Sunrise Lake | 16.5% | 7.4%(+9.13)#79 | 6.2%(+10.2)#1,183 |
| 80. | Tunnelhill Borough | 16.4% | 7.4%(+9.03)#80 | 6.2%(+10.1)#1,203 |
| 81. | Washington Boro | 16.2% | 7.4%(+8.80)#81 | 6.2%(+9.91)#1,251 |
| 82. | Jermyn Borough | 16.1% | 7.4%(+8.78)#82 | 6.2%(+9.88)#1,253 |
| 83. | New Berlinville | 16.0% | 7.4%(+8.65)#83 | 6.2%(+9.76)#1,283 |
| 84. | Bowers | 16.0% | 7.4%(+8.61)#84 | 6.2%(+9.71)#1,292 |
| 85. | Glenburn | 16.0% | 7.4%(+8.60)#85 | 6.2%(+9.71)#1,293 |
| 86. | Portland Borough | 15.9% | 7.4%(+8.58)#86 | 6.2%(+9.68)#1,295 |
| 87. | North Philipsburg | 15.9% | 7.4%(+8.53)#87 | 6.2%(+9.64)#1,306 |
| 88. | Orwigsburg Borough | 15.9% | 7.4%(+8.53)#88 | 6.2%(+9.63)#1,307 |
| 89. | Conestoga | 15.9% | 7.4%(+8.52)#89 | 6.2%(+9.62)#1,311 |
| 90. | Northwood | 15.9% | 7.4%(+8.50)#90 | 6.2%(+9.61)#1,314 |
| 91. | Ford City Borough | 15.8% | 7.4%(+8.40)#91 | 6.2%(+9.51)#1,340 |
| 92. | Cassandra Borough | 15.5% | 7.4%(+8.17)#92 | 6.2%(+9.27)#1,391 |
| 93. | Treasure Lake | 15.4% | 7.4%(+8.06)#93 | 6.2%(+9.17)#1,411 |
| 94. | Seven Fields Borough | 15.1% | 7.4%(+7.77)#94 | 6.2%(+8.87)#1,480 |
| 95. | Elysburg | 14.8% | 7.4%(+7.46)#95 | 6.2%(+8.57)#1,546 |
| 96. | Darlington Borough | 14.8% | 7.4%(+7.46)#96 | 6.2%(+8.57)#1,548 |
| 97. | Spring Drive Mobile Home Park | 14.8% | 7.4%(+7.46)#97 | 6.2%(+8.57)#1,549 |
| 98. | Linwood | 14.8% | 7.4%(+7.46)#98 | 6.2%(+8.57)#1,554 |
| 99. | Allenwood | 14.8% | 7.4%(+7.44)#99 | 6.2%(+8.54)#1,556 |
| 100. | Penn Lake Park Borough | 14.7% | 7.4%(+7.39)#100 | 6.2%(+8.49)#1,568 |
Common Questions
What are the Top 10 Cities with the Highest Percentage of Population Employed in Health Diagnosing & Treating in Pennsylvania?
Top 10 Cities with the Highest Percentage of Population Employed in Health Diagnosing & Treating in Pennsylvania are:
#1
38.9%
#2
35.8%
#3
32.4%
#4
32.1%
#5
31.7%
#6
31.2%
#7
28.5%
#8
28.3%
#9
25.9%
#10
25.2%
What city has the Highest Percentage of Population Employed in Health Diagnosing & Treating in Pennsylvania?
Fredericktown has the Highest Percentage of Population Employed in Health Diagnosing & Treating in Pennsylvania with 38.9%.
What is the Percentage of Population Employed in Health Diagnosing & Treating in the State of Pennsylvania?
Percentage of Population Employed in Health Diagnosing & Treating in Pennsylvania is 7.4%.
What is the Percentage of Population Employed in Health Diagnosing & Treating in the United States?
Percentage of Population Employed in Health Diagnosing & Treating in the United States is 6.2%.