Cities with the Highest Percentage of Population Employed in Health Diagnosing & Treating in Kentucky
RELATED REPORTS & OPTIONS
Health Diagnosing & Treating
Kentucky
Compare Cities
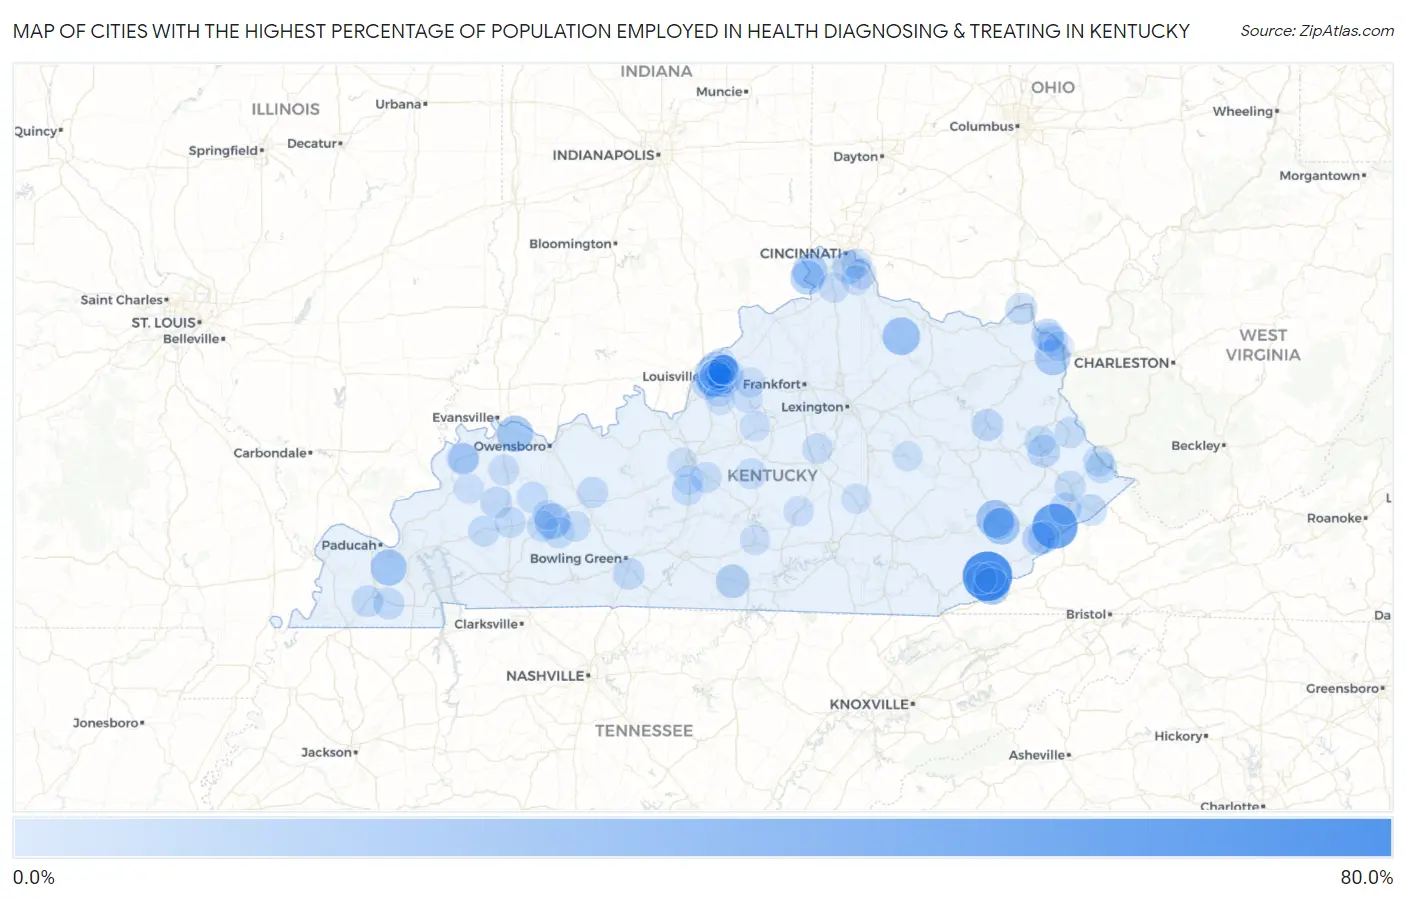
Map of Cities with the Highest Percentage of Population Employed in Health Diagnosing & Treating in Kentucky
0.0%
80.0%
Cities with the Highest Percentage of Population Employed in Health Diagnosing & Treating in Kentucky
| City | % Employed | vs State | vs National | |
| 1. | Coxton | 75.0% | 7.2%(+67.8)#1 | 6.2%(+68.8)#26 |
| 2. | Knottsville | 67.8% | 7.2%(+60.6)#2 | 6.2%(+61.5)#32 |
| 3. | Mcroberts | 60.4% | 7.2%(+53.2)#3 | 6.2%(+54.1)#41 |
| 4. | Mount Olivet | 34.7% | 7.2%(+27.5)#4 | 6.2%(+28.4)#208 |
| 5. | Hazard | 33.8% | 7.2%(+26.6)#5 | 6.2%(+27.5)#218 |
| 6. | Cawood | 32.4% | 7.2%(+25.2)#6 | 6.2%(+26.2)#258 |
| 7. | Jeff | 31.9% | 7.2%(+24.7)#7 | 6.2%(+25.7)#271 |
| 8. | Spottsville | 30.4% | 7.2%(+23.2)#8 | 6.2%(+24.1)#299 |
| 9. | Symsonia | 29.9% | 7.2%(+22.6)#9 | 6.2%(+23.6)#308 |
| 10. | Cleaton | 28.3% | 7.2%(+21.1)#10 | 6.2%(+22.1)#347 |
| 11. | Cannonsburg | 28.1% | 7.2%(+20.9)#11 | 6.2%(+21.8)#352 |
| 12. | Mockingbird Valley | 27.6% | 7.2%(+20.4)#12 | 6.2%(+21.3)#361 |
| 13. | Belleview | 26.3% | 7.2%(+19.0)#13 | 6.2%(+20.0)#400 |
| 14. | Glenview | 24.7% | 7.2%(+17.5)#14 | 6.2%(+18.5)#459 |
| 15. | Rabbit Hash | 24.7% | 7.2%(+17.5)#15 | 6.2%(+18.5)#460 |
| 16. | Marrowbone | 22.0% | 7.2%(+14.8)#16 | 6.2%(+15.8)#604 |
| 17. | Maryhill Estates | 21.5% | 7.2%(+14.3)#17 | 6.2%(+15.3)#629 |
| 18. | Whitesburg | 20.4% | 7.2%(+13.2)#18 | 6.2%(+14.2)#709 |
| 19. | Strathmoor Manor | 20.0% | 7.2%(+12.8)#19 | 6.2%(+13.8)#739 |
| 20. | Seneca Gardens | 19.9% | 7.2%(+12.7)#20 | 6.2%(+13.6)#763 |
| 21. | Fairview | 19.8% | 7.2%(+12.5)#21 | 6.2%(+13.5)#772 |
| 22. | Sycamore | 18.8% | 7.2%(+11.5)#22 | 6.2%(+12.5)#865 |
| 23. | Auxier | 18.7% | 7.2%(+11.5)#23 | 6.2%(+12.4)#874 |
| 24. | Raceland | 18.3% | 7.2%(+11.1)#24 | 6.2%(+12.1)#910 |
| 25. | Murray Hill | 18.0% | 7.2%(+10.8)#25 | 6.2%(+11.8)#952 |
| 26. | Mayking | 17.9% | 7.2%(+10.7)#26 | 6.2%(+11.7)#964 |
| 27. | Virgie | 17.7% | 7.2%(+10.5)#27 | 6.2%(+11.5)#986 |
| 28. | Norbourne Estates | 17.5% | 7.2%(+10.3)#28 | 6.2%(+11.3)#1,006 |
| 29. | Northfield | 17.2% | 7.2%(+10.0)#29 | 6.2%(+11.0)#1,047 |
| 30. | West Liberty | 17.2% | 7.2%(+9.96)#30 | 6.2%(+10.9)#1,056 |
| 31. | Diablock | 16.9% | 7.2%(+9.73)#31 | 6.2%(+10.7)#1,094 |
| 32. | Morganfield | 16.9% | 7.2%(+9.65)#32 | 6.2%(+10.6)#1,115 |
| 33. | South Shore | 16.4% | 7.2%(+9.22)#33 | 6.2%(+10.2)#1,194 |
| 34. | Pryorsburg | 16.3% | 7.2%(+9.07)#34 | 6.2%(+10.0)#1,220 |
| 35. | Plano | 16.3% | 7.2%(+9.05)#35 | 6.2%(+10.0)#1,226 |
| 36. | Manitou | 16.2% | 7.2%(+9.01)#36 | 6.2%(+9.97)#1,240 |
| 37. | Elkhorn City | 15.4% | 7.2%(+8.15)#37 | 6.2%(+9.12)#1,429 |
| 38. | Beechmont | 15.3% | 7.2%(+8.12)#38 | 6.2%(+9.08)#1,434 |
| 39. | Rosine | 15.1% | 7.2%(+7.88)#39 | 6.2%(+8.85)#1,486 |
| 40. | Thornhill | 14.9% | 7.2%(+7.68)#40 | 6.2%(+8.65)#1,530 |
| 41. | Farmington | 14.9% | 7.2%(+7.68)#41 | 6.2%(+8.65)#1,531 |
| 42. | Belfry | 14.7% | 7.2%(+7.46)#42 | 6.2%(+8.42)#1,586 |
| 43. | Greenville | 14.6% | 7.2%(+7.42)#43 | 6.2%(+8.38)#1,609 |
| 44. | Upton | 14.5% | 7.2%(+7.30)#44 | 6.2%(+8.26)#1,644 |
| 45. | Dawson Springs | 14.5% | 7.2%(+7.28)#45 | 6.2%(+8.24)#1,653 |
| 46. | South Williamson | 14.4% | 7.2%(+7.22)#46 | 6.2%(+8.18)#1,670 |
| 47. | Inez | 14.4% | 7.2%(+7.20)#47 | 6.2%(+8.17)#1,674 |
| 48. | Audubon Park | 14.3% | 7.2%(+7.09)#48 | 6.2%(+8.06)#1,696 |
| 49. | Sacramento | 14.3% | 7.2%(+7.08)#49 | 6.2%(+8.04)#1,705 |
| 50. | Mortons Gap | 14.2% | 7.2%(+7.02)#50 | 6.2%(+7.99)#1,735 |
| 51. | Pikeville | 13.9% | 7.2%(+6.65)#51 | 6.2%(+7.62)#1,842 |
| 52. | Paintsville | 13.9% | 7.2%(+6.64)#52 | 6.2%(+7.61)#1,846 |
| 53. | Hodgenville | 13.7% | 7.2%(+6.51)#53 | 6.2%(+7.47)#1,904 |
| 54. | Strathmoor Village | 13.7% | 7.2%(+6.49)#54 | 6.2%(+7.46)#1,912 |
| 55. | Bancroft | 13.6% | 7.2%(+6.41)#55 | 6.2%(+7.37)#1,941 |
| 56. | Harlan | 13.5% | 7.2%(+6.27)#56 | 6.2%(+7.23)#1,988 |
| 57. | Breckinridge Center | 13.4% | 7.2%(+6.22)#57 | 6.2%(+7.19)#2,017 |
| 58. | Bellefonte | 13.4% | 7.2%(+6.18)#58 | 6.2%(+7.14)#2,029 |
| 59. | Sebree | 13.3% | 7.2%(+6.13)#59 | 6.2%(+7.10)#2,042 |
| 60. | Prospect | 13.3% | 7.2%(+6.08)#60 | 6.2%(+7.05)#2,067 |
| 61. | Anchorage | 13.2% | 7.2%(+5.96)#61 | 6.2%(+6.93)#2,111 |
| 62. | St Mary | 13.2% | 7.2%(+5.95)#62 | 6.2%(+6.91)#2,117 |
| 63. | Rochester | 13.0% | 7.2%(+5.83)#63 | 6.2%(+6.80)#2,164 |
| 64. | Bellewood | 13.0% | 7.2%(+5.80)#64 | 6.2%(+6.76)#2,187 |
| 65. | Ten Broeck | 12.9% | 7.2%(+5.69)#65 | 6.2%(+6.66)#2,242 |
| 66. | Burgin | 12.7% | 7.2%(+5.50)#66 | 6.2%(+6.47)#2,326 |
| 67. | Spring Valley | 12.7% | 7.2%(+5.45)#67 | 6.2%(+6.41)#2,351 |
| 68. | Alexandria | 12.6% | 7.2%(+5.44)#68 | 6.2%(+6.40)#2,356 |
| 69. | Cambridge | 12.6% | 7.2%(+5.40)#69 | 6.2%(+6.37)#2,373 |
| 70. | Kingsley | 12.6% | 7.2%(+5.40)#70 | 6.2%(+6.36)#2,378 |
| 71. | Walton | 12.5% | 7.2%(+5.31)#71 | 6.2%(+6.27)#2,412 |
| 72. | Brownsboro Village | 12.5% | 7.2%(+5.29)#72 | 6.2%(+6.26)#2,421 |
| 73. | Hollow Creek | 12.4% | 7.2%(+5.21)#73 | 6.2%(+6.18)#2,468 |
| 74. | Bloomfield | 12.4% | 7.2%(+5.17)#74 | 6.2%(+6.13)#2,491 |
| 75. | Flatwoods | 12.4% | 7.2%(+5.14)#75 | 6.2%(+6.11)#2,505 |
| 76. | Norwood | 12.2% | 7.2%(+4.97)#76 | 6.2%(+5.94)#2,590 |
| 77. | Forest Hills | 12.1% | 7.2%(+4.84)#77 | 6.2%(+5.81)#2,652 |
| 78. | Elk Creek | 11.8% | 7.2%(+4.54)#78 | 6.2%(+5.51)#2,806 |
| 79. | Liberty | 11.7% | 7.2%(+4.51)#79 | 6.2%(+5.47)#2,823 |
| 80. | Hurstbourne | 11.7% | 7.2%(+4.49)#80 | 6.2%(+5.45)#2,839 |
| 81. | Windy Hills | 11.6% | 7.2%(+4.38)#81 | 6.2%(+5.34)#2,920 |
| 82. | Simpsonville | 11.6% | 7.2%(+4.38)#82 | 6.2%(+5.34)#2,922 |
| 83. | Druid Hills | 11.6% | 7.2%(+4.35)#83 | 6.2%(+5.32)#2,939 |
| 84. | Crestview | 11.6% | 7.2%(+4.34)#84 | 6.2%(+5.31)#2,943 |
| 85. | Ages | 11.5% | 7.2%(+4.29)#85 | 6.2%(+5.26)#2,986 |
| 86. | Columbia | 11.5% | 7.2%(+4.28)#86 | 6.2%(+5.25)#3,000 |
| 87. | Broeck Pointe | 11.5% | 7.2%(+4.24)#87 | 6.2%(+5.21)#3,024 |
| 88. | Brownsboro Farm | 11.4% | 7.2%(+4.21)#88 | 6.2%(+5.17)#3,048 |
| 89. | St Matthews | 11.2% | 7.2%(+4.03)#89 | 6.2%(+5.00)#3,155 |
| 90. | Brodhead | 11.2% | 7.2%(+4.02)#90 | 6.2%(+4.98)#3,163 |
| 91. | Heritage Creek | 11.2% | 7.2%(+4.00)#91 | 6.2%(+4.96)#3,179 |
| 92. | Cecilia | 11.2% | 7.2%(+3.97)#92 | 6.2%(+4.94)#3,197 |
| 93. | Central City | 11.2% | 7.2%(+3.97)#93 | 6.2%(+4.93)#3,203 |
| 94. | Irvine | 11.1% | 7.2%(+3.90)#94 | 6.2%(+4.87)#3,241 |
| 95. | Sonora | 11.1% | 7.2%(+3.90)#95 | 6.2%(+4.87)#3,247 |
| 96. | Clay | 11.0% | 7.2%(+3.82)#96 | 6.2%(+4.79)#3,314 |
| 97. | Ashland | 11.0% | 7.2%(+3.82)#97 | 6.2%(+4.78)#3,316 |
| 98. | Claryville | 10.9% | 7.2%(+3.71)#98 | 6.2%(+4.67)#3,377 |
| 99. | Graymoor Devondale | 10.8% | 7.2%(+3.62)#99 | 6.2%(+4.59)#3,446 |
| 100. | Manor Creek | 10.8% | 7.2%(+3.62)#100 | 6.2%(+4.58)#3,454 |
Common Questions
What are the Top 10 Cities with the Highest Percentage of Population Employed in Health Diagnosing & Treating in Kentucky?
Top 10 Cities with the Highest Percentage of Population Employed in Health Diagnosing & Treating in Kentucky are:
#1
75.0%
#2
60.4%
#3
34.7%
#4
33.8%
#5
32.4%
#6
31.9%
#7
30.4%
#8
29.9%
#9
28.3%
#10
28.1%
What city has the Highest Percentage of Population Employed in Health Diagnosing & Treating in Kentucky?
Coxton has the Highest Percentage of Population Employed in Health Diagnosing & Treating in Kentucky with 75.0%.
What is the Percentage of Population Employed in Health Diagnosing & Treating in the State of Kentucky?
Percentage of Population Employed in Health Diagnosing & Treating in Kentucky is 7.2%.
What is the Percentage of Population Employed in Health Diagnosing & Treating in the United States?
Percentage of Population Employed in Health Diagnosing & Treating in the United States is 6.2%.