Cities with the Highest Percentage of Population Employed in Health Diagnosing & Treating in New Jersey
RELATED REPORTS & OPTIONS
Health Diagnosing & Treating
New Jersey
Compare Cities
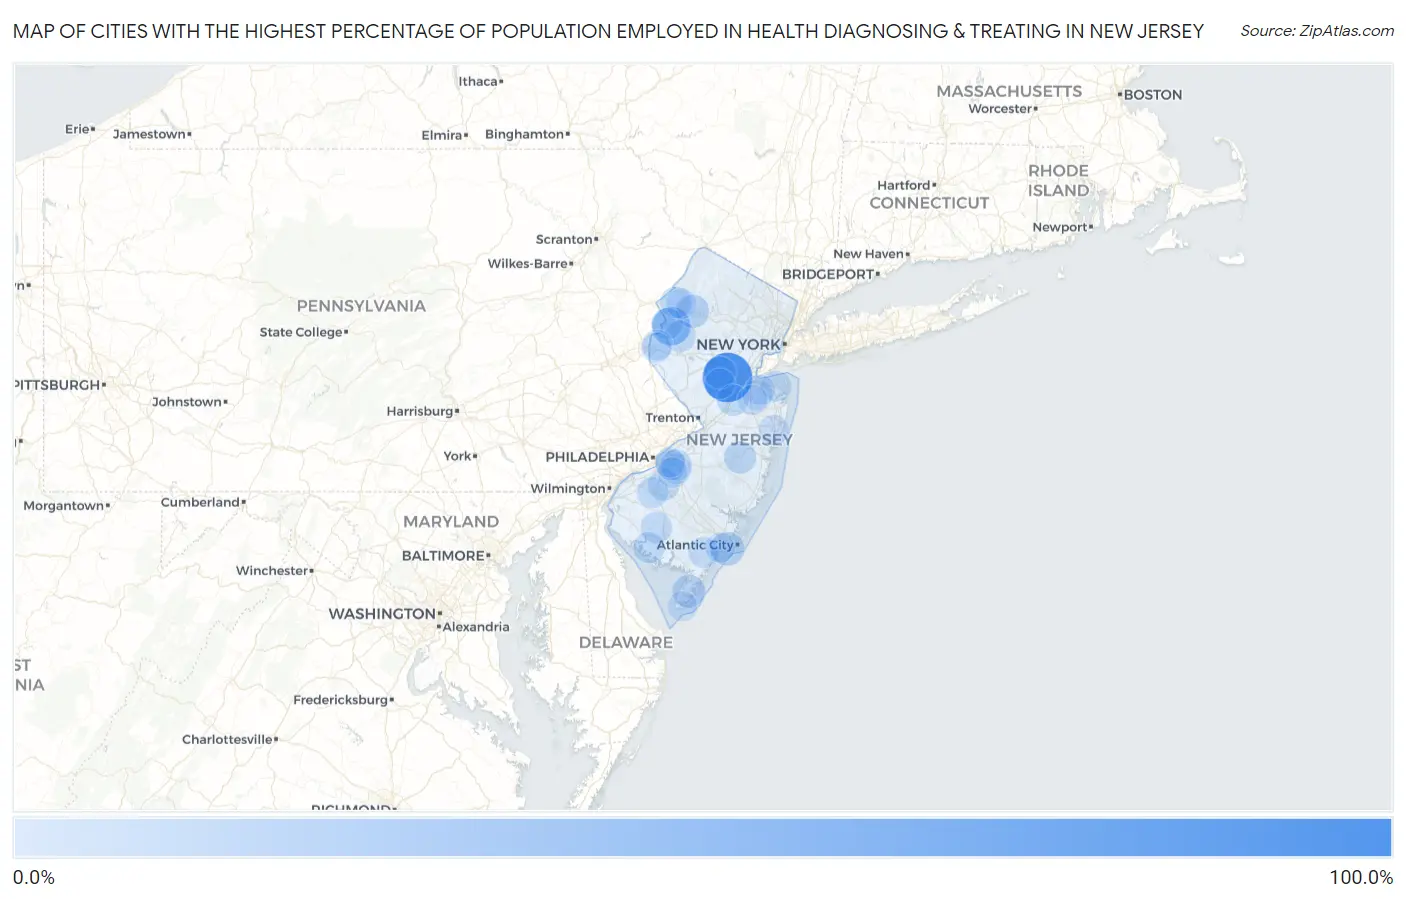
Map of Cities with the Highest Percentage of Population Employed in Health Diagnosing & Treating in New Jersey
0.0%
100.0%
Cities with the Highest Percentage of Population Employed in Health Diagnosing & Treating in New Jersey
| City | % Employed | vs State | vs National | |
| 1. | Clyde | 100.0% | 6.2%(+93.8)#1 | 6.2%(+93.8)#9 |
| 2. | Buttzville | 48.1% | 6.2%(+41.8)#2 | 6.2%(+41.8)#89 |
| 3. | Springfield | 44.7% | 6.2%(+38.5)#3 | 6.2%(+38.5)#106 |
| 4. | Heislerville | 39.1% | 6.2%(+32.9)#4 | 6.2%(+32.9)#150 |
| 5. | Tuckahoe | 37.2% | 6.2%(+30.9)#5 | 6.2%(+30.9)#170 |
| 6. | Lakeside-Beebe Run | 30.3% | 6.2%(+24.1)#6 | 6.2%(+24.1)#300 |
| 7. | Connecticut Farms | 30.0% | 6.2%(+23.8)#7 | 6.2%(+23.8)#304 |
| 8. | Nesco | 27.6% | 6.2%(+21.3)#8 | 6.2%(+21.3)#362 |
| 9. | Newtonville | 26.2% | 6.2%(+19.9)#9 | 6.2%(+19.9)#404 |
| 10. | Margate City | 26.0% | 6.2%(+19.8)#10 | 6.2%(+19.8)#411 |
| 11. | Laurel Heights | 24.5% | 6.2%(+18.3)#11 | 6.2%(+18.3)#466 |
| 12. | Allamuchy | 23.8% | 6.2%(+17.6)#12 | 6.2%(+17.6)#504 |
| 13. | Burleigh | 22.8% | 6.2%(+16.5)#13 | 6.2%(+16.5)#563 |
| 14. | New Gretna | 22.3% | 6.2%(+16.1)#14 | 6.2%(+16.1)#584 |
| 15. | Pluckemin | 21.7% | 6.2%(+15.5)#15 | 6.2%(+15.5)#615 |
| 16. | Mount Royal | 20.3% | 6.2%(+14.1)#16 | 6.2%(+14.1)#719 |
| 17. | Cedar Glen Lakes | 19.4% | 6.2%(+13.2)#17 | 6.2%(+13.2)#801 |
| 18. | Fortescue | 19.4% | 6.2%(+13.1)#18 | 6.2%(+13.1)#804 |
| 19. | Weston | 19.3% | 6.2%(+13.1)#19 | 6.2%(+13.1)#807 |
| 20. | Stonebridge | 19.2% | 6.2%(+12.9)#20 | 6.2%(+12.9)#822 |
| 21. | Millstone Borough | 19.0% | 6.2%(+12.8)#21 | 6.2%(+12.8)#833 |
| 22. | Sunset Lake | 19.0% | 6.2%(+12.7)#22 | 6.2%(+12.7)#848 |
| 23. | Lawnside Borough | 17.3% | 6.2%(+11.0)#23 | 6.2%(+11.0)#1,035 |
| 24. | Englewood Cliffs Borough | 16.8% | 6.2%(+10.6)#24 | 6.2%(+10.6)#1,123 |
| 25. | Sewell | 16.8% | 6.2%(+10.5)#25 | 6.2%(+10.5)#1,126 |
| 26. | Anderson | 16.7% | 6.2%(+10.5)#26 | 6.2%(+10.5)#1,136 |
| 27. | Rosenhayn | 16.5% | 6.2%(+10.3)#27 | 6.2%(+10.3)#1,172 |
| 28. | Lebanon Borough | 16.5% | 6.2%(+10.3)#28 | 6.2%(+10.3)#1,176 |
| 29. | Renaissance At Monroe | 16.4% | 6.2%(+10.2)#29 | 6.2%(+10.2)#1,190 |
| 30. | Blairstown | 16.3% | 6.2%(+10.0)#30 | 6.2%(+10.0)#1,219 |
| 31. | Haddonfield Borough | 16.2% | 6.2%(+9.94)#31 | 6.2%(+9.94)#1,246 |
| 32. | Vauxhall | 16.2% | 6.2%(+9.92)#32 | 6.2%(+9.92)#1,247 |
| 33. | Ocean View | 16.1% | 6.2%(+9.89)#33 | 6.2%(+9.88)#1,254 |
| 34. | Bridgeville | 15.8% | 6.2%(+9.58)#34 | 6.2%(+9.58)#1,320 |
| 35. | Rossmoor | 15.7% | 6.2%(+9.46)#35 | 6.2%(+9.45)#1,350 |
| 36. | Turnersville | 15.7% | 6.2%(+9.43)#36 | 6.2%(+9.43)#1,356 |
| 37. | Sheppards Mill | 15.6% | 6.2%(+9.31)#37 | 6.2%(+9.31)#1,385 |
| 38. | Manasquan Borough | 15.5% | 6.2%(+9.29)#38 | 6.2%(+9.29)#1,387 |
| 39. | Northvale Borough | 15.4% | 6.2%(+9.21)#39 | 6.2%(+9.20)#1,402 |
| 40. | Cedarville | 15.4% | 6.2%(+9.19)#40 | 6.2%(+9.19)#1,406 |
| 41. | Regency At Monroe | 15.4% | 6.2%(+9.13)#41 | 6.2%(+9.13)#1,428 |
| 42. | Mauricetown | 15.3% | 6.2%(+9.07)#42 | 6.2%(+9.07)#1,439 |
| 43. | Allenhurst Borough | 15.3% | 6.2%(+9.04)#43 | 6.2%(+9.04)#1,450 |
| 44. | Old Tappan Borough | 15.2% | 6.2%(+8.93)#44 | 6.2%(+8.93)#1,468 |
| 45. | Tenafly Borough | 15.1% | 6.2%(+8.91)#45 | 6.2%(+8.90)#1,475 |
| 46. | Alpine Borough | 15.0% | 6.2%(+8.76)#46 | 6.2%(+8.76)#1,503 |
| 47. | Richwood | 15.0% | 6.2%(+8.73)#47 | 6.2%(+8.72)#1,516 |
| 48. | Oldwick | 14.6% | 6.2%(+8.40)#48 | 6.2%(+8.40)#1,594 |
| 49. | Greentree | 14.3% | 6.2%(+8.09)#49 | 6.2%(+8.08)#1,691 |
| 50. | Corbin City | 14.2% | 6.2%(+7.96)#50 | 6.2%(+7.95)#1,746 |
| 51. | Bergenfield Borough | 14.2% | 6.2%(+7.95)#51 | 6.2%(+7.94)#1,752 |
| 52. | Rockleigh Borough | 14.2% | 6.2%(+7.93)#52 | 6.2%(+7.92)#1,759 |
| 53. | Rainbow Lakes | 13.8% | 6.2%(+7.57)#53 | 6.2%(+7.57)#1,861 |
| 54. | Titusville | 13.2% | 6.2%(+7.01)#54 | 6.2%(+7.00)#2,083 |
| 55. | Monmouth Beach Borough | 13.2% | 6.2%(+6.92)#55 | 6.2%(+6.92)#2,112 |
| 56. | Saddle River Borough | 13.0% | 6.2%(+6.78)#56 | 6.2%(+6.78)#2,179 |
| 57. | Belford | 13.0% | 6.2%(+6.72)#57 | 6.2%(+6.72)#2,209 |
| 58. | New Milford Borough | 12.7% | 6.2%(+6.43)#58 | 6.2%(+6.43)#2,348 |
| 59. | Bargaintown | 12.7% | 6.2%(+6.42)#59 | 6.2%(+6.41)#2,353 |
| 60. | Palermo | 12.6% | 6.2%(+6.36)#60 | 6.2%(+6.35)#2,380 |
| 61. | Morganville | 12.6% | 6.2%(+6.32)#61 | 6.2%(+6.32)#2,396 |
| 62. | Shiloh Borough | 12.4% | 6.2%(+6.17)#62 | 6.2%(+6.17)#2,473 |
| 63. | Springdale | 12.4% | 6.2%(+6.15)#63 | 6.2%(+6.15)#2,483 |
| 64. | Pleasantdale | 12.4% | 6.2%(+6.13)#64 | 6.2%(+6.12)#2,498 |
| 65. | Marmora | 12.2% | 6.2%(+6.00)#65 | 6.2%(+5.99)#2,563 |
| 66. | Grenloch | 12.1% | 6.2%(+5.90)#66 | 6.2%(+5.90)#2,608 |
| 67. | Franklin Lakes Borough | 11.9% | 6.2%(+5.67)#67 | 6.2%(+5.67)#2,714 |
| 68. | Ship Bottom Borough | 11.9% | 6.2%(+5.66)#68 | 6.2%(+5.66)#2,722 |
| 69. | Pleasant Plains | 11.8% | 6.2%(+5.59)#69 | 6.2%(+5.58)#2,761 |
| 70. | Upper Stewartsville | 11.8% | 6.2%(+5.52)#70 | 6.2%(+5.52)#2,793 |
| 71. | Marksboro | 11.8% | 6.2%(+5.52)#71 | 6.2%(+5.52)#2,800 |
| 72. | Beachwood Borough | 11.7% | 6.2%(+5.49)#72 | 6.2%(+5.48)#2,813 |
| 73. | Roseland Borough | 11.7% | 6.2%(+5.47)#73 | 6.2%(+5.47)#2,827 |
| 74. | Allenwood | 11.7% | 6.2%(+5.42)#74 | 6.2%(+5.41)#2,865 |
| 75. | The Ponds | 11.6% | 6.2%(+5.37)#75 | 6.2%(+5.37)#2,898 |
| 76. | Bay Head Borough | 11.5% | 6.2%(+5.26)#76 | 6.2%(+5.25)#2,992 |
| 77. | North Caldwell Borough | 11.5% | 6.2%(+5.23)#77 | 6.2%(+5.22)#3,010 |
| 78. | Robbinsville Center | 11.3% | 6.2%(+5.09)#78 | 6.2%(+5.09)#3,103 |
| 79. | Ho Ho Kus Borough | 11.3% | 6.2%(+5.08)#79 | 6.2%(+5.07)#3,111 |
| 80. | Strathmore | 11.3% | 6.2%(+5.04)#80 | 6.2%(+5.03)#3,131 |
| 81. | Island Heights Borough | 11.2% | 6.2%(+4.98)#81 | 6.2%(+4.98)#3,165 |
| 82. | Barclay | 11.1% | 6.2%(+4.90)#82 | 6.2%(+4.90)#3,229 |
| 83. | West Berlin | 11.1% | 6.2%(+4.90)#83 | 6.2%(+4.89)#3,230 |
| 84. | Medford Lakes Borough | 11.1% | 6.2%(+4.90)#84 | 6.2%(+4.89)#3,231 |
| 85. | Audubon Borough | 11.0% | 6.2%(+4.75)#85 | 6.2%(+4.74)#3,339 |
| 86. | Echelon | 10.9% | 6.2%(+4.70)#86 | 6.2%(+4.70)#3,363 |
| 87. | Hopelawn | 10.9% | 6.2%(+4.68)#87 | 6.2%(+4.68)#3,376 |
| 88. | Cape May Point Borough | 10.9% | 6.2%(+4.63)#88 | 6.2%(+4.62)#3,408 |
| 89. | Green | 10.8% | 6.2%(+4.60)#89 | 6.2%(+4.59)#3,439 |
| 90. | Flanders | 10.8% | 6.2%(+4.59)#90 | 6.2%(+4.58)#3,455 |
| 91. | Greenwich | 10.7% | 6.2%(+4.50)#91 | 6.2%(+4.49)#3,534 |
| 92. | Robertsville | 10.7% | 6.2%(+4.47)#92 | 6.2%(+4.46)#3,556 |
| 93. | Cape May | 10.6% | 6.2%(+4.36)#93 | 6.2%(+4.35)#3,642 |
| 94. | Barrington Borough | 10.6% | 6.2%(+4.35)#94 | 6.2%(+4.34)#3,651 |
| 95. | Ellisburg | 10.6% | 6.2%(+4.34)#95 | 6.2%(+4.34)#3,661 |
| 96. | Thorofare | 10.5% | 6.2%(+4.30)#96 | 6.2%(+4.30)#3,695 |
| 97. | Centre Grove | 10.5% | 6.2%(+4.30)#97 | 6.2%(+4.29)#3,697 |
| 98. | Harvey Cedars Borough | 10.5% | 6.2%(+4.28)#98 | 6.2%(+4.28)#3,714 |
| 99. | Dumont Borough | 10.5% | 6.2%(+4.28)#99 | 6.2%(+4.28)#3,726 |
| 100. | Linwood | 10.4% | 6.2%(+4.15)#100 | 6.2%(+4.14)#3,834 |
Common Questions
What are the Top 10 Cities with the Highest Percentage of Population Employed in Health Diagnosing & Treating in New Jersey?
Top 10 Cities with the Highest Percentage of Population Employed in Health Diagnosing & Treating in New Jersey are:
#1
100.0%
#2
48.1%
#3
26.0%
#4
23.8%
#5
22.8%
#6
19.4%
#7
19.3%
#8
16.7%
#9
16.5%
#10
16.3%
What city has the Highest Percentage of Population Employed in Health Diagnosing & Treating in New Jersey?
Clyde has the Highest Percentage of Population Employed in Health Diagnosing & Treating in New Jersey with 100.0%.
What is the Percentage of Population Employed in Health Diagnosing & Treating in the State of New Jersey?
Percentage of Population Employed in Health Diagnosing & Treating in New Jersey is 6.2%.
What is the Percentage of Population Employed in Health Diagnosing & Treating in the United States?
Percentage of Population Employed in Health Diagnosing & Treating in the United States is 6.2%.