Zip Codes with the Highest Percentage of Population Employed in Health Diagnosing & Treating in Bowie, MD
RELATED REPORTS & OPTIONS
Health Diagnosing & Treating
Bowie
Compare Zip Codes
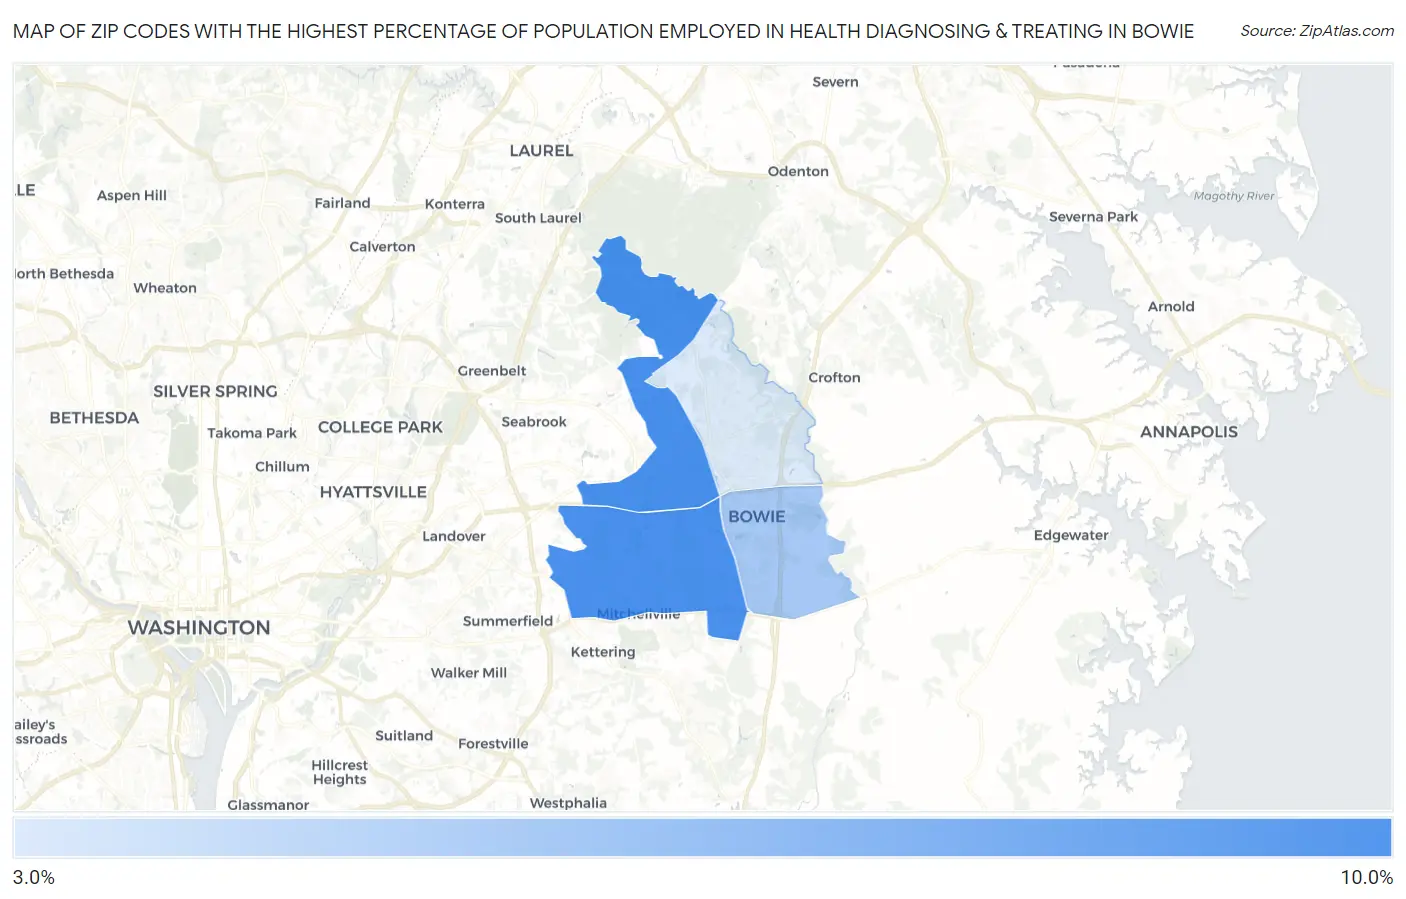
Map of Zip Codes with the Highest Percentage of Population Employed in Health Diagnosing & Treating in Bowie
0.0%
10.0%
Zip Codes with the Highest Percentage of Population Employed in Health Diagnosing & Treating in Bowie, MD
| Zip Code | % Employed | vs State | vs National | |
| 1. | 20720 | 8.9% | 6.2%(+2.68)#79 | 6.2%(+2.64)#5,554 |
| 2. | 20721 | 8.8% | 6.2%(+2.60)#87 | 6.2%(+2.56)#5,722 |
| 3. | 20716 | 5.6% | 6.2%(-0.644)#236 | 6.2%(-0.682)#15,535 |
| 4. | 20715 | 3.7% | 6.2%(-2.52)#334 | 6.2%(-2.55)#22,317 |
1
Common Questions
What are the Top 3 Zip Codes with the Highest Percentage of Population Employed in Health Diagnosing & Treating in Bowie, MD?
Top 3 Zip Codes with the Highest Percentage of Population Employed in Health Diagnosing & Treating in Bowie, MD are:
What zip code has the Highest Percentage of Population Employed in Health Diagnosing & Treating in Bowie, MD?
20720 has the Highest Percentage of Population Employed in Health Diagnosing & Treating in Bowie, MD with 8.9%.
What is the Percentage of Population Employed in Health Diagnosing & Treating in Bowie, MD?
Percentage of Population Employed in Health Diagnosing & Treating in Bowie is 5.1%.
What is the Percentage of Population Employed in Health Diagnosing & Treating in Maryland?
Percentage of Population Employed in Health Diagnosing & Treating in Maryland is 6.2%.
What is the Percentage of Population Employed in Health Diagnosing & Treating in the United States?
Percentage of Population Employed in Health Diagnosing & Treating in the United States is 6.2%.