Kingstown, MD
Kingstown Map
Kingstown Overview
1,874
TOTAL POPULATION
930
MALE POPULATION
944
FEMALE POPULATION
98.52
MALES / 100 FEMALES
101.51
FEMALES / 100 MALES
49.3
MEDIAN AGE
2.9
AVG FAMILY SIZE
2.2
AVG HOUSEHOLD SIZE
$44,970
PER CAPITA INCOME
$126,319
AVG FAMILY INCOME
$88,214
AVG HOUSEHOLD INCOME
15.7%
WAGE / INCOME GAP [ % ]
84.3¢/ $1
WAGE / INCOME GAP [ $ ]
0.49
INEQUALITY / GINI INDEX
839
LABOR FORCE [ PEOPLE ]
51.6%
PERCENT IN LABOR FORCE
1.3%
UNEMPLOYMENT RATE
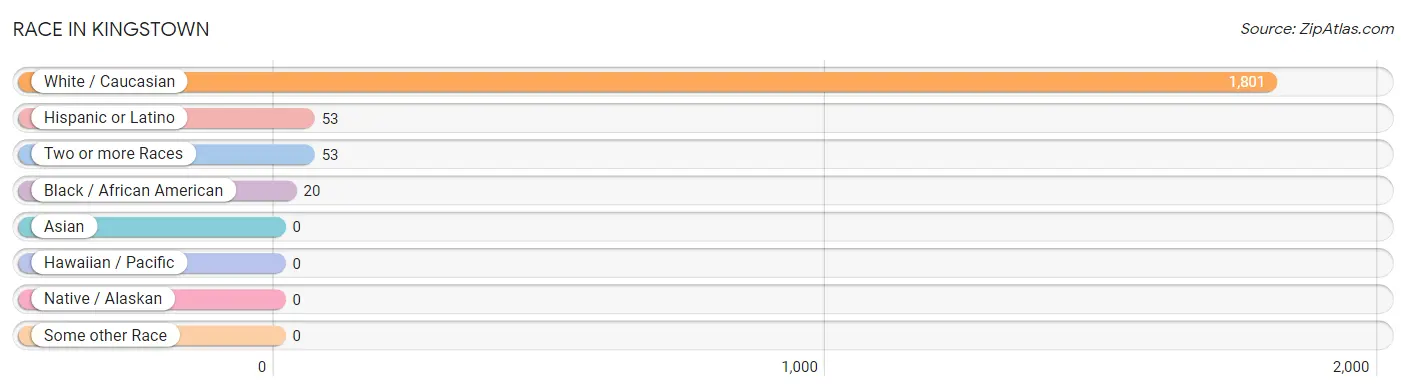
Race in Kingstown
The most populous races in Kingstown are White / Caucasian (1,801 | 96.1%), Hispanic or Latino (53 | 2.8%), and Two or more Races (53 | 2.8%).
| Race | # Population | % Population |
| Asian | 0 | 0.0% |
| Black / African American | 20 | 1.1% |
| Hawaiian / Pacific | 0 | 0.0% |
| Hispanic or Latino | 53 | 2.8% |
| Native / Alaskan | 0 | 0.0% |
| White / Caucasian | 1,801 | 96.1% |
| Two or more Races | 53 | 2.8% |
| Some other Race | 0 | 0.0% |
| Total | 1,874 | 100.0% |
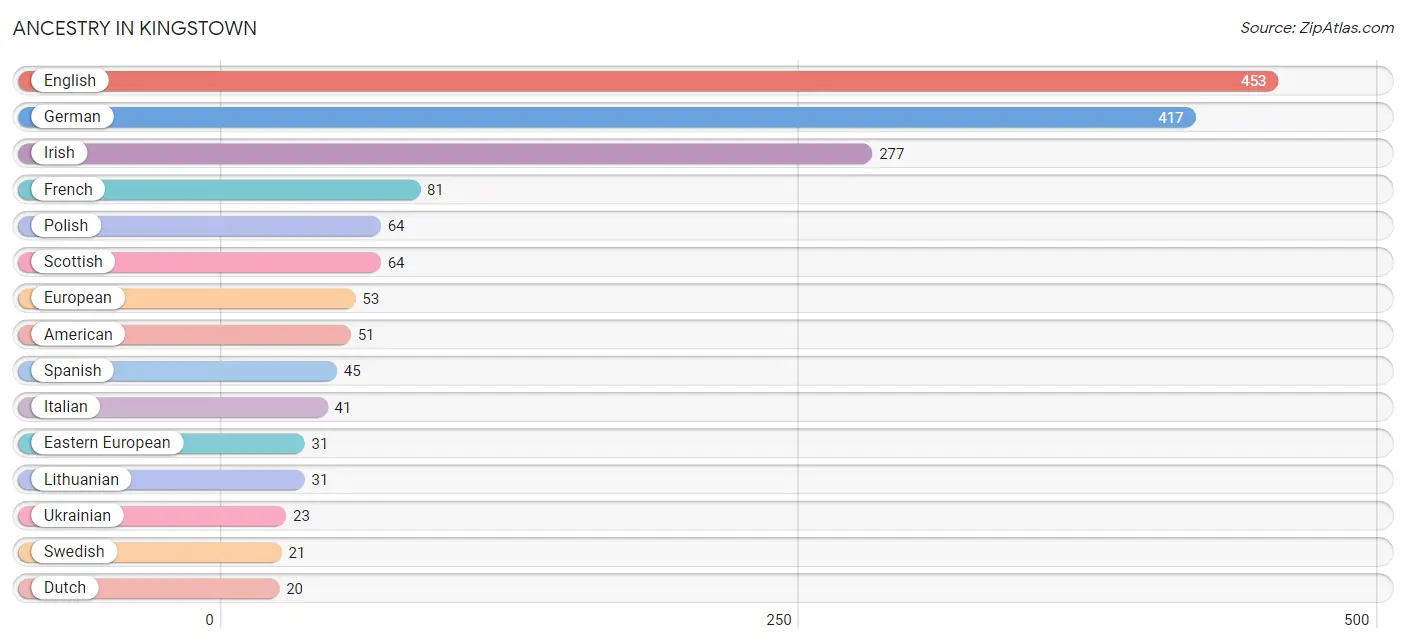
Ancestry in Kingstown
The most populous ancestries reported in Kingstown are English (453 | 24.2%), German (417 | 22.3%), Irish (277 | 14.8%), French (81 | 4.3%), and Polish (64 | 3.4%), together accounting for 68.9% of all Kingstown residents.
| Ancestry | # Population | % Population |
| American | 51 | 2.7% |
| Austrian | 11 | 0.6% |
| Danish | 12 | 0.6% |
| Dutch | 20 | 1.1% |
| Eastern European | 31 | 1.7% |
| English | 453 | 24.2% |
| European | 53 | 2.8% |
| French | 81 | 4.3% |
| French Canadian | 12 | 0.6% |
| German | 417 | 22.3% |
| Greek | 8 | 0.4% |
| Hungarian | 20 | 1.1% |
| Irish | 277 | 14.8% |
| Italian | 41 | 2.2% |
| Lithuanian | 31 | 1.7% |
| Norwegian | 10 | 0.5% |
| Polish | 64 | 3.4% |
| Puerto Rican | 8 | 0.4% |
| Romanian | 12 | 0.6% |
| Scotch-Irish | 19 | 1.0% |
| Scottish | 64 | 3.4% |
| Spanish | 45 | 2.4% |
| Swedish | 21 | 1.1% |
| Ukrainian | 23 | 1.2% | View All 24 Rows |
Immigrants in Kingstown

| Immigration Origin | # Population | % Population | View All 0 Rows |
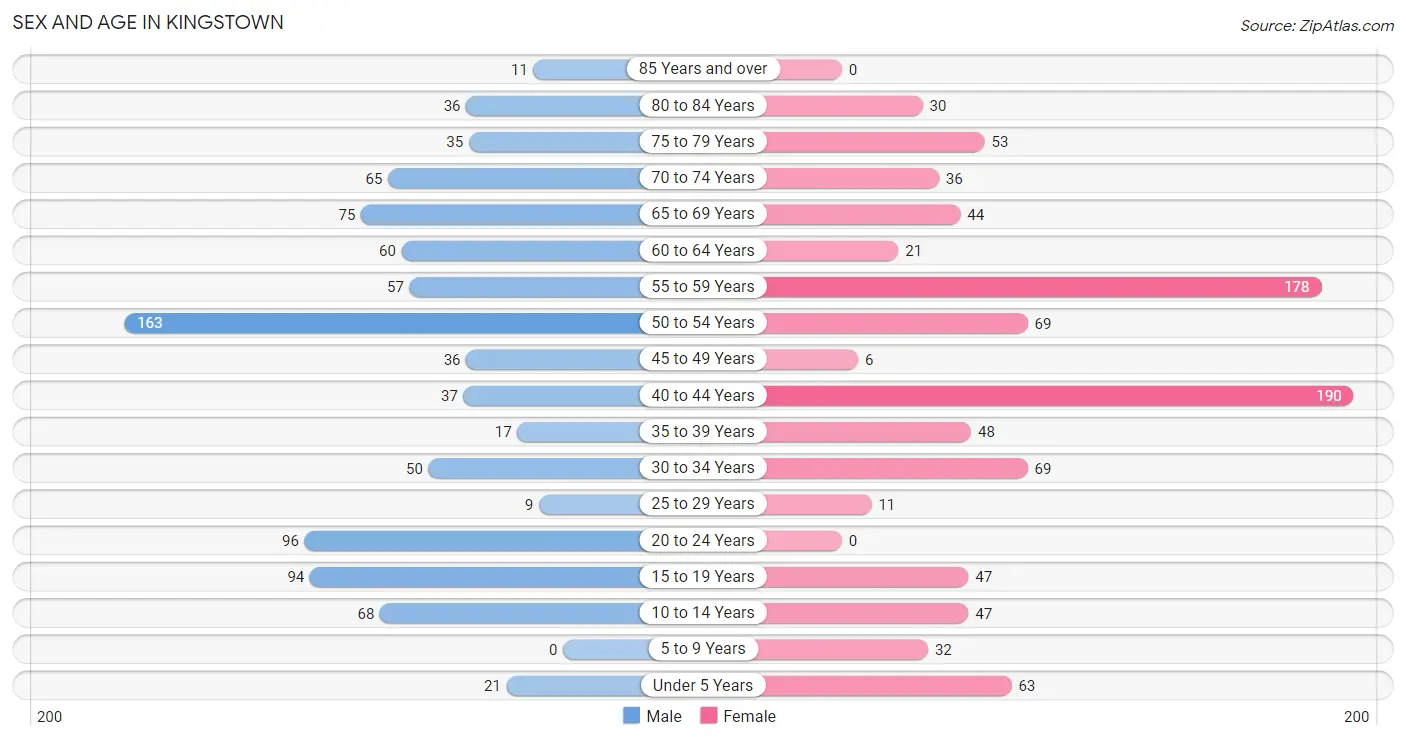
Sex and Age in Kingstown
Sex and Age in Kingstown
The most populous age groups in Kingstown are 50 to 54 Years (163 | 17.5%) for men and 40 to 44 Years (190 | 20.1%) for women.
| Age Bracket | Male | Female |
| Under 5 Years | 21 (2.3%) | 63 (6.7%) |
| 5 to 9 Years | 0 (0.0%) | 32 (3.4%) |
| 10 to 14 Years | 68 (7.3%) | 47 (5.0%) |
| 15 to 19 Years | 94 (10.1%) | 47 (5.0%) |
| 20 to 24 Years | 96 (10.3%) | 0 (0.0%) |
| 25 to 29 Years | 9 (1.0%) | 11 (1.2%) |
| 30 to 34 Years | 50 (5.4%) | 69 (7.3%) |
| 35 to 39 Years | 17 (1.8%) | 48 (5.1%) |
| 40 to 44 Years | 37 (4.0%) | 190 (20.1%) |
| 45 to 49 Years | 36 (3.9%) | 6 (0.6%) |
| 50 to 54 Years | 163 (17.5%) | 69 (7.3%) |
| 55 to 59 Years | 57 (6.1%) | 178 (18.9%) |
| 60 to 64 Years | 60 (6.5%) | 21 (2.2%) |
| 65 to 69 Years | 75 (8.1%) | 44 (4.7%) |
| 70 to 74 Years | 65 (7.0%) | 36 (3.8%) |
| 75 to 79 Years | 35 (3.8%) | 53 (5.6%) |
| 80 to 84 Years | 36 (3.9%) | 30 (3.2%) |
| 85 Years and over | 11 (1.2%) | 0 (0.0%) |
| Total | 930 (100.0%) | 944 (100.0%) |
Families and Households in Kingstown
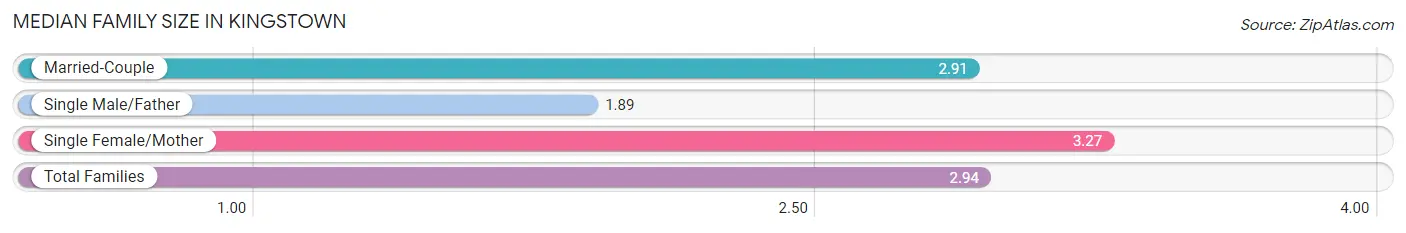
Median Family Size in Kingstown
The median family size in Kingstown is 2.94 persons per family, with single female/mother families (67 | 13.4%) accounting for the largest median family size of 3.27 persons per family. On the other hand, single male/father families (9 | 1.8%) represent the smallest median family size with 1.89 persons per family.
| Family Type | # Families | Family Size |
| Married-Couple | 425 (84.8%) | 2.91 |
| Single Male/Father | 9 (1.8%) | 1.89 |
| Single Female/Mother | 67 (13.4%) | 3.27 |
| Total Families | 501 (100.0%) | 2.94 |
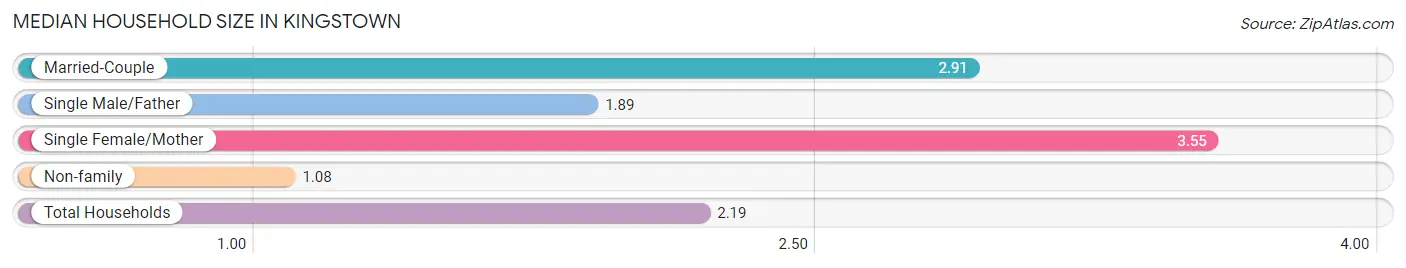
Median Household Size in Kingstown
The median household size in Kingstown is 2.19 persons per household, with single female/mother households (67 | 7.9%) accounting for the largest median household size of 3.55 persons per household. non-family households (351 | 41.2%) represent the smallest median household size with 1.08 persons per household.
| Household Type | # Households | Household Size |
| Married-Couple | 425 (49.9%) | 2.91 |
| Single Male/Father | 9 (1.1%) | 1.89 |
| Single Female/Mother | 67 (7.9%) | 3.55 |
| Non-family | 351 (41.2%) | 1.08 |
| Total Households | 852 (100.0%) | 2.19 |
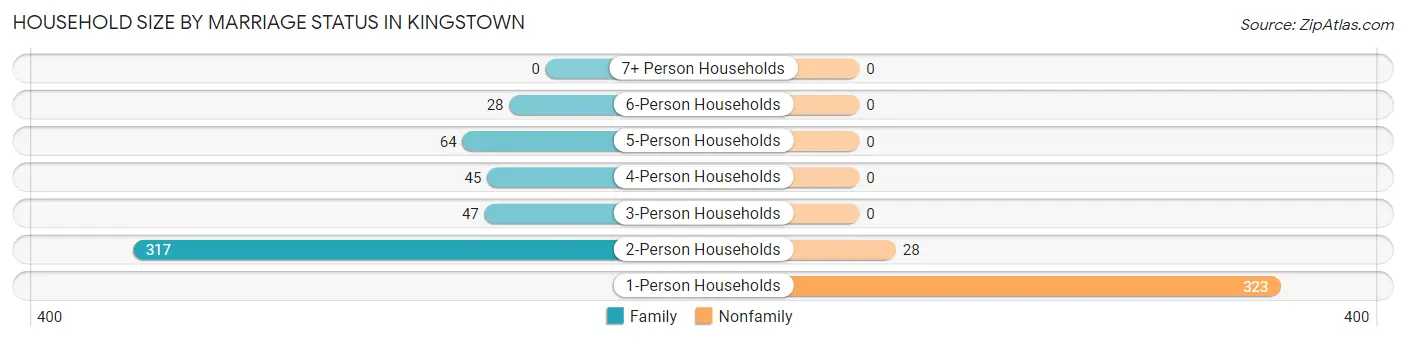
Household Size by Marriage Status in Kingstown
Out of a total of 852 households in Kingstown, 501 (58.8%) are family households, while 351 (41.2%) are nonfamily households. The most numerous type of family households are 2-person households, comprising 317, and the most common type of nonfamily households are 1-person households, comprising 323.
| Household Size | Family Households | Nonfamily Households |
| 1-Person Households | - | 323 (37.9%) |
| 2-Person Households | 317 (37.2%) | 28 (3.3%) |
| 3-Person Households | 47 (5.5%) | 0 (0.0%) |
| 4-Person Households | 45 (5.3%) | 0 (0.0%) |
| 5-Person Households | 64 (7.5%) | 0 (0.0%) |
| 6-Person Households | 28 (3.3%) | 0 (0.0%) |
| 7+ Person Households | 0 (0.0%) | 0 (0.0%) |
| Total | 501 (58.8%) | 351 (41.2%) |
Female Fertility in Kingstown
Fertility by Age in Kingstown
| Age Bracket | Women with Births | Births / 1,000 Women |
| 15 to 19 years | 0 (0.0%) | 0.0 |
| 20 to 34 years | 0 (0.0%) | 0.0 |
| 35 to 50 years | 0 (0.0%) | 0.0 |
| Total | 0 (0.0%) | 0.0 |
Fertility by Age by Marriage Status in Kingstown
| Age Bracket | Married | Unmarried |
| 15 to 19 years | 0 (0.0%) | 0 (0.0%) |
| 20 to 34 years | 0 (0.0%) | 0 (0.0%) |
| 35 to 50 years | 0 (0.0%) | 0 (0.0%) |
| Total | 0 (0.0%) | 0 (0.0%) |
Fertility by Education in Kingstown
| Educational Attainment | Women with Births | Births / 1,000 Women |
| Less than High School | 0 (0.0%) | 0.0 |
| High School Diploma | 0 (0.0%) | 0.0 |
| College or Associate's Degree | 0 (0.0%) | 0.0 |
| Bachelor's Degree | 0 (0.0%) | 0.0 |
| Graduate Degree | 0 (0.0%) | 0.0 |
| Total | 0 (0.0%) | 0.0 |
Fertility by Education by Marriage Status in Kingstown
| Educational Attainment | Married | Unmarried |
| Less than High School | 0 (0.0%) | 0 (0.0%) |
| High School Diploma | 0 (0.0%) | 0 (0.0%) |
| College or Associate's Degree | 0 (0.0%) | 0 (0.0%) |
| Bachelor's Degree | 0 (0.0%) | 0 (0.0%) |
| Graduate Degree | 0 (0.0%) | 0 (0.0%) |
| Total | 0 (0.0%) | 0 (0.0%) |
Income in Kingstown
Income Overview in Kingstown
Per Capita Income in Kingstown is $44,970, while median incomes of families and households are $126,319 and $88,214 respectively.
| Characteristic | Number | Measure |
| Per Capita Income | 1,874 | $44,970 |
| Median Family Income | 501 | $126,319 |
| Mean Family Income | 501 | $145,619 |
| Median Household Income | 852 | $88,214 |
| Mean Household Income | 852 | $97,449 |
| Income Deficit | 501 | $0 |
| Wage / Income Gap (%) | 1,874 | 15.71% |
| Wage / Income Gap ($) | 1,874 | 84.29¢ per $1 |
| Gini / Inequality Index | 1,874 | 0.49 |
Earnings by Sex in Kingstown
Average Earnings in Kingstown are $56,525, $65,469 for men and $55,183 for women, a difference of 15.7%.
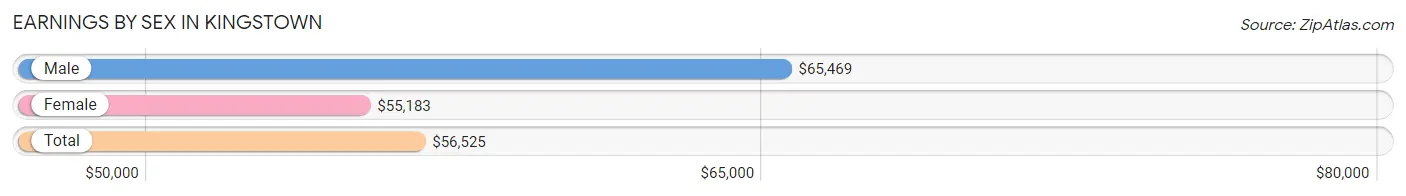
| Sex | Number | Average Earnings |
| Male | 399 (46.7%) | $65,469 |
| Female | 456 (53.3%) | $55,183 |
| Total | 855 (100.0%) | $56,525 |
Earnings by Sex by Income Bracket in Kingstown
The most common earnings brackets in Kingstown are $100,000+ for men (108 | 27.1%) and $55,000 to $64,999 for women (87 | 19.1%).
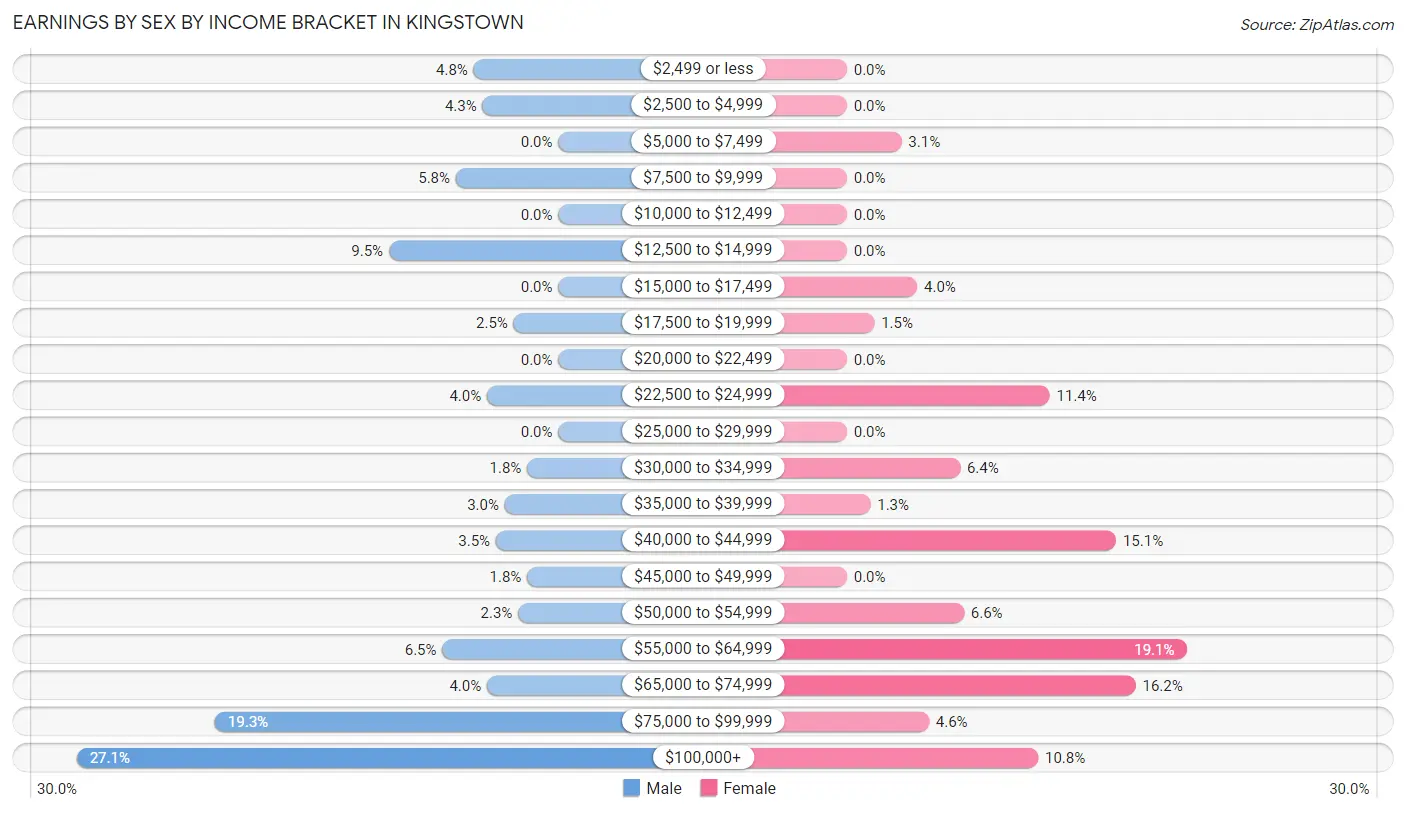
| Income | Male | Female |
| $2,499 or less | 19 (4.8%) | 0 (0.0%) |
| $2,500 to $4,999 | 17 (4.3%) | 0 (0.0%) |
| $5,000 to $7,499 | 0 (0.0%) | 14 (3.1%) |
| $7,500 to $9,999 | 23 (5.8%) | 0 (0.0%) |
| $10,000 to $12,499 | 0 (0.0%) | 0 (0.0%) |
| $12,500 to $14,999 | 38 (9.5%) | 0 (0.0%) |
| $15,000 to $17,499 | 0 (0.0%) | 18 (4.0%) |
| $17,500 to $19,999 | 10 (2.5%) | 7 (1.5%) |
| $20,000 to $22,499 | 0 (0.0%) | 0 (0.0%) |
| $22,500 to $24,999 | 16 (4.0%) | 52 (11.4%) |
| $25,000 to $29,999 | 0 (0.0%) | 0 (0.0%) |
| $30,000 to $34,999 | 7 (1.8%) | 29 (6.4%) |
| $35,000 to $39,999 | 12 (3.0%) | 6 (1.3%) |
| $40,000 to $44,999 | 14 (3.5%) | 69 (15.1%) |
| $45,000 to $49,999 | 7 (1.8%) | 0 (0.0%) |
| $50,000 to $54,999 | 9 (2.3%) | 30 (6.6%) |
| $55,000 to $64,999 | 26 (6.5%) | 87 (19.1%) |
| $65,000 to $74,999 | 16 (4.0%) | 74 (16.2%) |
| $75,000 to $99,999 | 77 (19.3%) | 21 (4.6%) |
| $100,000+ | 108 (27.1%) | 49 (10.7%) |
| Total | 399 (100.0%) | 456 (100.0%) |
Earnings by Sex by Educational Attainment in Kingstown
Average earnings in Kingstown are $82,500 for men and $55,183 for women, a difference of 33.1%. Men with an educational attainment of graduate degree enjoy the highest average annual earnings of $238,068, while those with high school diploma education earn the least with $63,603. Women with an educational attainment of college or associate's degree earn the most with the average annual earnings of $59,063, while those with bachelor's degree education have the smallest earnings of $41,930.
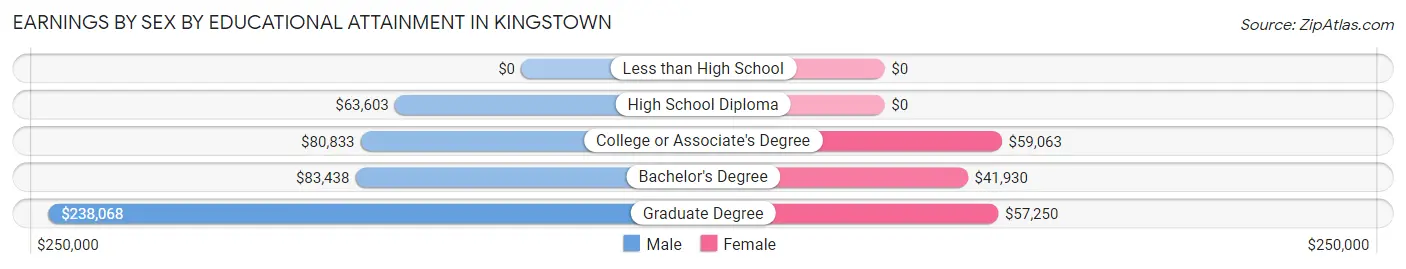
| Educational Attainment | Male Income | Female Income |
| Less than High School | - | - |
| High School Diploma | $63,603 | $0 |
| College or Associate's Degree | $80,833 | $59,063 |
| Bachelor's Degree | $83,438 | $41,930 |
| Graduate Degree | $238,068 | $57,250 |
| Total | $82,500 | $55,183 |
Family Income in Kingstown
Family Income Brackets in Kingstown
According to the Kingstown family income data, there are 180 families falling into the $100,000 to $149,999 income range, which is the most common income bracket and makes up 35.9% of all families.
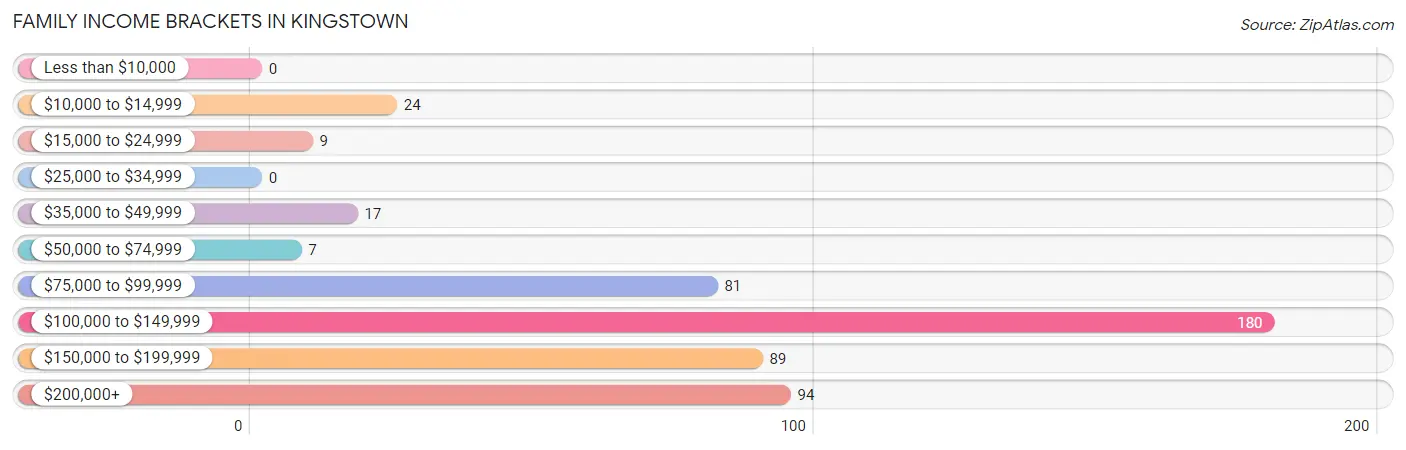
| Income Bracket | # Families | % Families |
| Less than $10,000 | 0 | 0.0% |
| $10,000 to $14,999 | 24 | 4.8% |
| $15,000 to $24,999 | 9 | 1.8% |
| $25,000 to $34,999 | 0 | 0.0% |
| $35,000 to $49,999 | 17 | 3.4% |
| $50,000 to $74,999 | 7 | 1.4% |
| $75,000 to $99,999 | 81 | 16.2% |
| $100,000 to $149,999 | 180 | 35.9% |
| $150,000 to $199,999 | 89 | 17.8% |
| $200,000+ | 94 | 18.8% |
Family Income by Famaliy Size in Kingstown
2-person families (334 | 66.7%) account for the highest median family income in Kingstown with $121,364 per family, while 2-person families (334 | 66.7%) have the highest median income of $60,682 per family member.
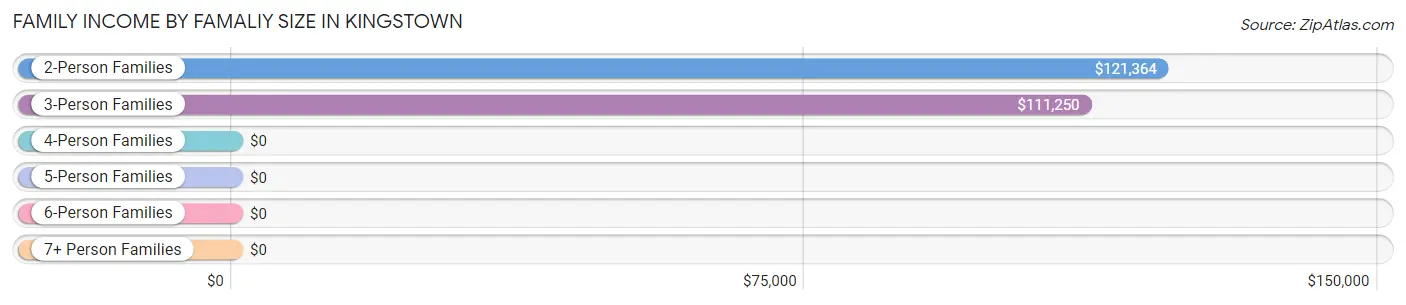
| Income Bracket | # Families | Median Income |
| 2-Person Families | 334 (66.7%) | $121,364 |
| 3-Person Families | 30 (6.0%) | $111,250 |
| 4-Person Families | 45 (9.0%) | $0 |
| 5-Person Families | 64 (12.8%) | $0 |
| 6-Person Families | 28 (5.6%) | $0 |
| 7+ Person Families | 0 (0.0%) | $0 |
| Total | 501 (100.0%) | $126,319 |
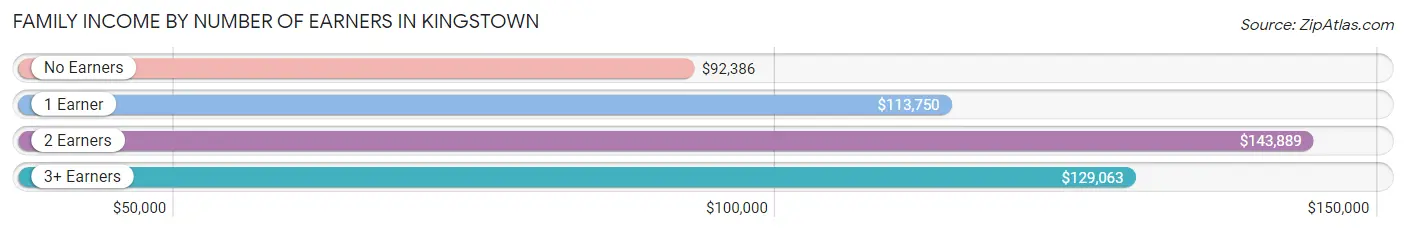
Family Income by Number of Earners in Kingstown
The median family income in Kingstown is $126,319, with families comprising 2 earners (244) having the highest median family income of $143,889, while families with no earners (141) have the lowest median family income of $92,386, accounting for 48.7% and 28.1% of families, respectively.
| Number of Earners | # Families | Median Income |
| No Earners | 141 (28.1%) | $92,386 |
| 1 Earner | 89 (17.8%) | $113,750 |
| 2 Earners | 244 (48.7%) | $143,889 |
| 3+ Earners | 27 (5.4%) | $129,063 |
| Total | 501 (100.0%) | $126,319 |
Household Income in Kingstown
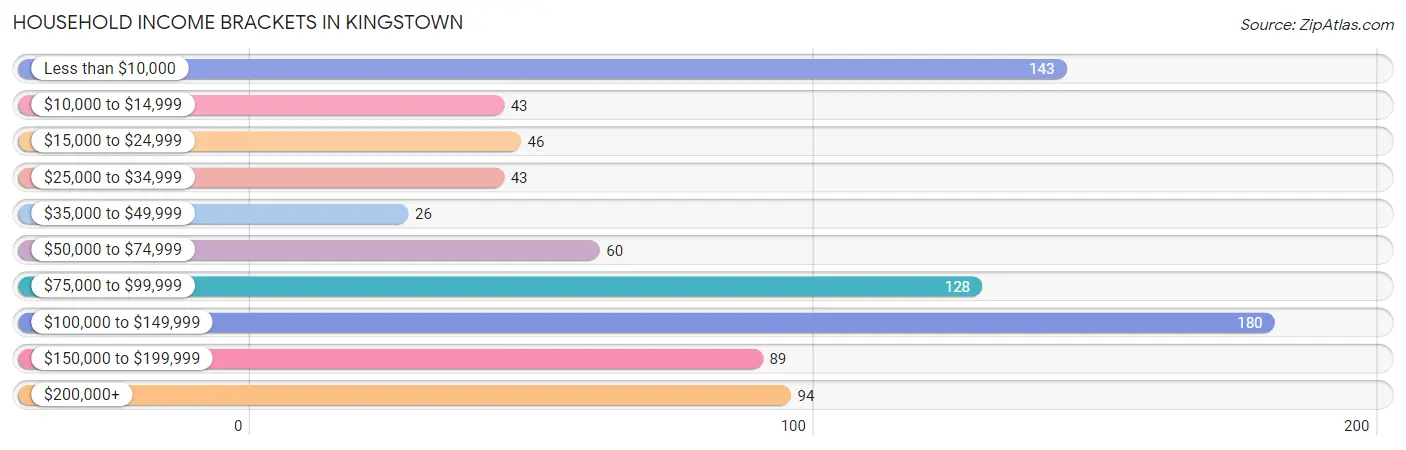
Household Income Brackets in Kingstown
With 180 households falling in the category, the $100,000 to $149,999 income range is the most frequent in Kingstown, accounting for 21.1% of all households. In contrast, only 26 households (3.0%) fall into the $35,000 to $49,999 income bracket, making it the least populous group.
| Income Bracket | # Households | % Households |
| Less than $10,000 | 143 | 16.8% |
| $10,000 to $14,999 | 43 | 5.0% |
| $15,000 to $24,999 | 46 | 5.4% |
| $25,000 to $34,999 | 43 | 5.0% |
| $35,000 to $49,999 | 26 | 3.1% |
| $50,000 to $74,999 | 60 | 7.0% |
| $75,000 to $99,999 | 128 | 15.0% |
| $100,000 to $149,999 | 180 | 21.1% |
| $150,000 to $199,999 | 89 | 10.4% |
| $200,000+ | 94 | 11.0% |
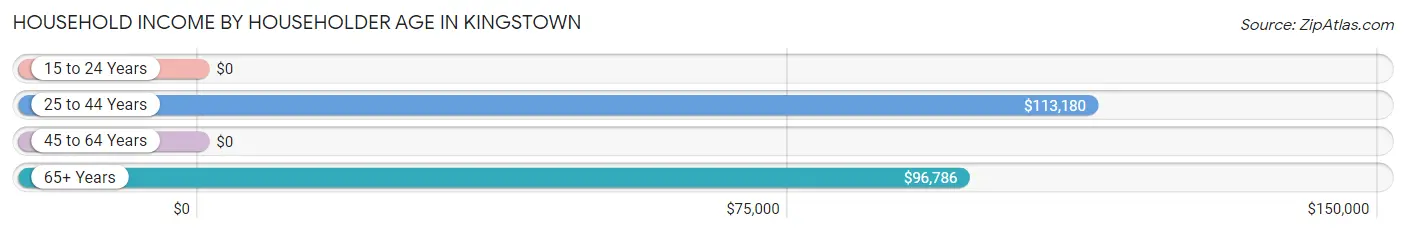
Household Income by Householder Age in Kingstown
The median household income in Kingstown is $88,214, with the highest median household income of $113,180 found in the 25 to 44 years age bracket for the primary householder. A total of 231 households (27.1%) fall into this category. Meanwhile, the 15 to 24 years age bracket for the primary householder has the lowest median household income of $0, with 19 households (2.2%) in this group.
| Income Bracket | # Households | Median Income |
| 15 to 24 Years | 19 (2.2%) | $0 |
| 25 to 44 Years | 231 (27.1%) | $113,180 |
| 45 to 64 Years | 362 (42.5%) | $0 |
| 65+ Years | 240 (28.2%) | $96,786 |
| Total | 852 (100.0%) | $88,214 |
Poverty in Kingstown
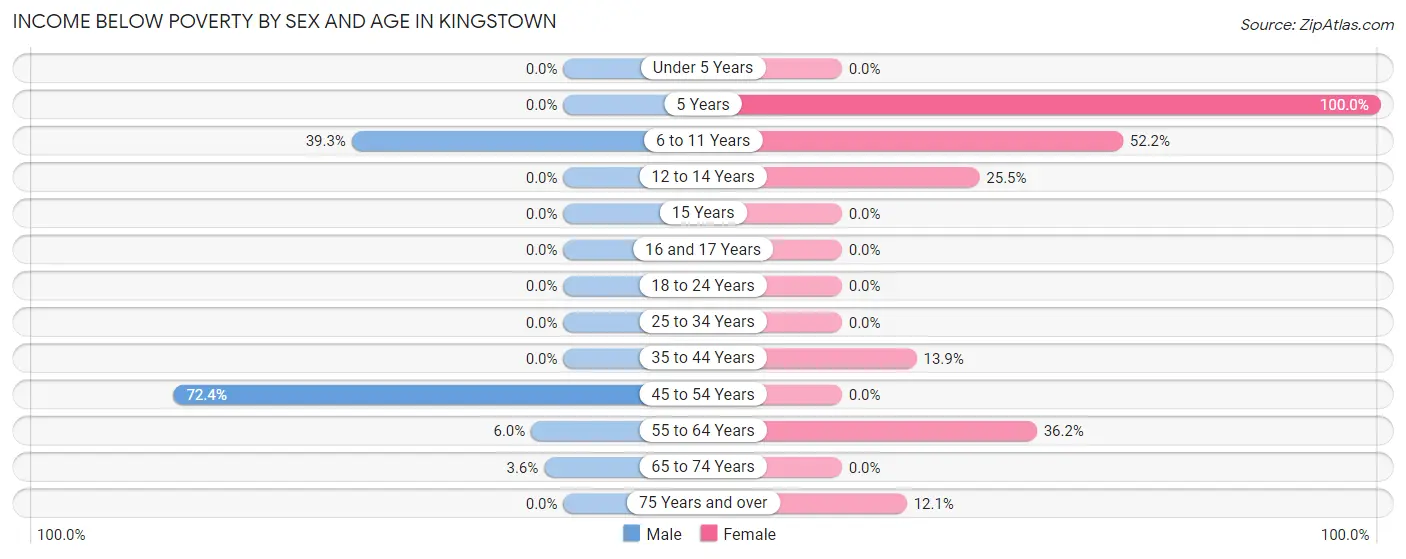
Income Below Poverty by Sex and Age in Kingstown
With 18.0% poverty level for males and 15.7% for females among the residents of Kingstown, 45 to 54 year old males and 5 year old females are the most vulnerable to poverty, with 144 males (72.4%) and 9 females (100.0%) in their respective age groups living below the poverty level.
| Age Bracket | Male | Female |
| Under 5 Years | 0 (0.0%) | 0 (0.0%) |
| 5 Years | 0 (0.0%) | 9 (100.0%) |
| 6 to 11 Years | 11 (39.3%) | 12 (52.2%) |
| 12 to 14 Years | 0 (0.0%) | 12 (25.5%) |
| 15 Years | 0 (0.0%) | 0 (0.0%) |
| 16 and 17 Years | 0 (0.0%) | 0 (0.0%) |
| 18 to 24 Years | 0 (0.0%) | 0 (0.0%) |
| 25 to 34 Years | 0 (0.0%) | 0 (0.0%) |
| 35 to 44 Years | 0 (0.0%) | 33 (13.9%) |
| 45 to 54 Years | 144 (72.4%) | 0 (0.0%) |
| 55 to 64 Years | 7 (6.0%) | 72 (36.2%) |
| 65 to 74 Years | 5 (3.6%) | 0 (0.0%) |
| 75 Years and over | 0 (0.0%) | 10 (12.0%) |
| Total | 167 (18.0%) | 148 (15.7%) |
Income Above Poverty by Sex and Age in Kingstown
According to the poverty statistics in Kingstown, males aged under 5 years and females aged under 5 years are the age groups that are most secure financially, with 100.0% of males and 100.0% of females in these age groups living above the poverty line.
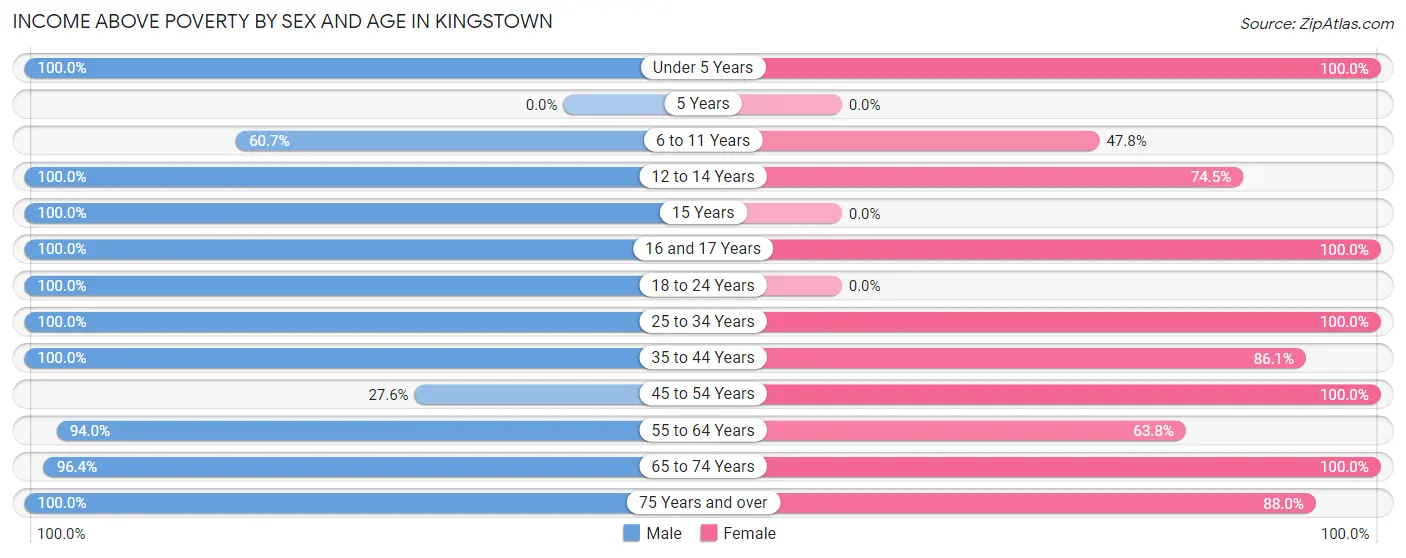
| Age Bracket | Male | Female |
| Under 5 Years | 21 (100.0%) | 63 (100.0%) |
| 5 Years | 0 (0.0%) | 0 (0.0%) |
| 6 to 11 Years | 17 (60.7%) | 11 (47.8%) |
| 12 to 14 Years | 40 (100.0%) | 35 (74.5%) |
| 15 Years | 17 (100.0%) | 0 (0.0%) |
| 16 and 17 Years | 30 (100.0%) | 47 (100.0%) |
| 18 to 24 Years | 143 (100.0%) | 0 (0.0%) |
| 25 to 34 Years | 59 (100.0%) | 80 (100.0%) |
| 35 to 44 Years | 54 (100.0%) | 205 (86.1%) |
| 45 to 54 Years | 55 (27.6%) | 75 (100.0%) |
| 55 to 64 Years | 110 (94.0%) | 127 (63.8%) |
| 65 to 74 Years | 135 (96.4%) | 80 (100.0%) |
| 75 Years and over | 82 (100.0%) | 73 (87.9%) |
| Total | 763 (82.0%) | 796 (84.3%) |
Income Below Poverty Among Married-Couple Families in Kingstown
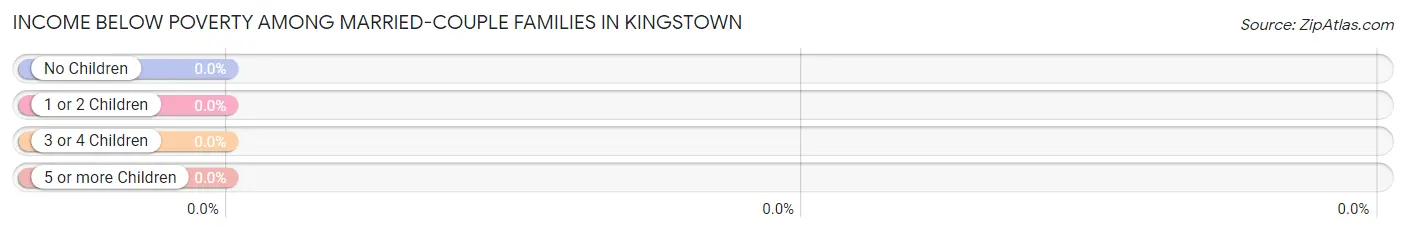
| Children | Above Poverty | Below Poverty |
| No Children | 303 (100.0%) | 0 (0.0%) |
| 1 or 2 Children | 82 (100.0%) | 0 (0.0%) |
| 3 or 4 Children | 40 (100.0%) | 0 (0.0%) |
| 5 or more Children | 0 (0.0%) | 0 (0.0%) |
| Total | 425 (100.0%) | 0 (0.0%) |
Income Below Poverty Among Single-Parent Households in Kingstown
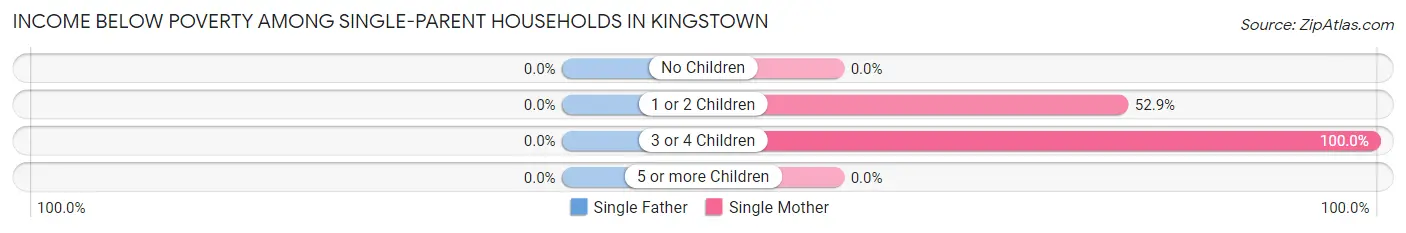
| Children | Single Father | Single Mother |
| No Children | 0 (0.0%) | 0 (0.0%) |
| 1 or 2 Children | 0 (0.0%) | 9 (52.9%) |
| 3 or 4 Children | 0 (0.0%) | 24 (100.0%) |
| 5 or more Children | 0 (0.0%) | 0 (0.0%) |
| Total | 0 (0.0%) | 33 (49.2%) |
Income Below Poverty Among Married-Couple vs Single-Parent Households in Kingstown
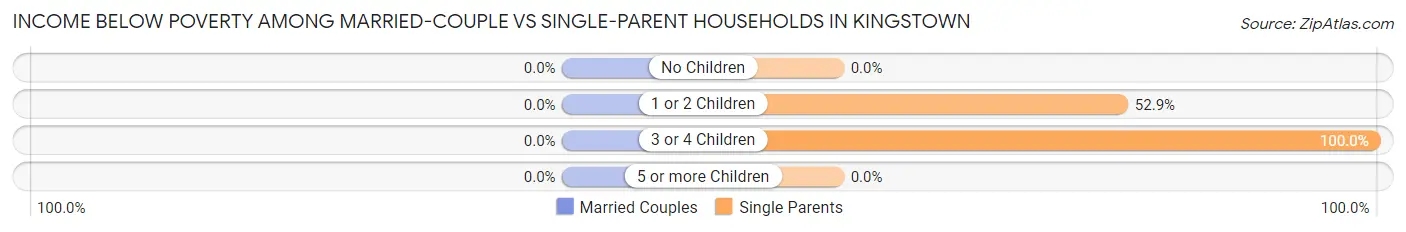
| Children | Married-Couple Families | Single-Parent Households |
| No Children | 0 (0.0%) | 0 (0.0%) |
| 1 or 2 Children | 0 (0.0%) | 9 (52.9%) |
| 3 or 4 Children | 0 (0.0%) | 24 (100.0%) |
| 5 or more Children | 0 (0.0%) | 0 (0.0%) |
| Total | 0 (0.0%) | 33 (43.4%) |
Employment Characteristics in Kingstown
Employment by Class of Employer in Kingstown
Among the 828 employed individuals in Kingstown, private company employees (359 | 43.4%), local government employees (162 | 19.6%), and not-for-profit organizations (107 | 12.9%) make up the most common classes of employment.
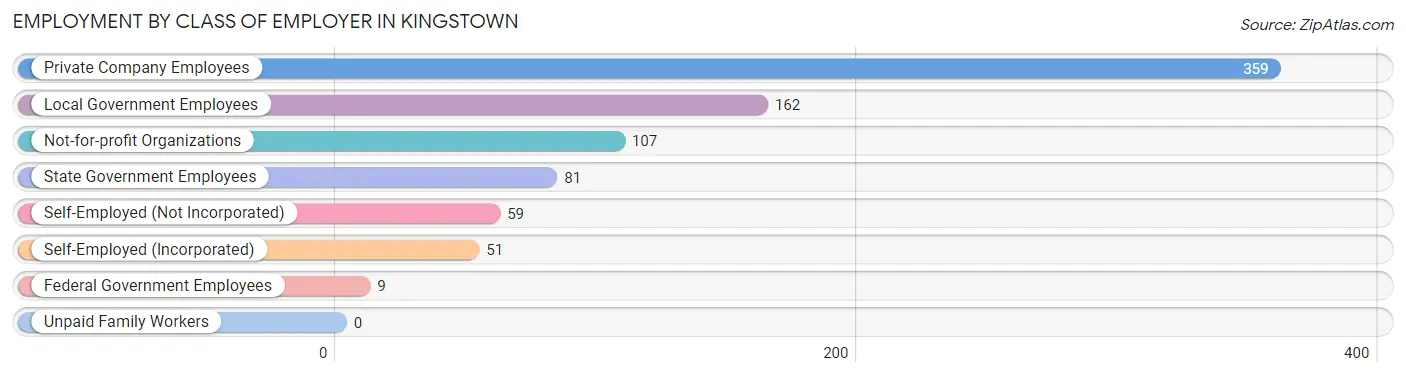
| Employer Class | # Employees | % Employees |
| Private Company Employees | 359 | 43.4% |
| Self-Employed (Incorporated) | 51 | 6.2% |
| Self-Employed (Not Incorporated) | 59 | 7.1% |
| Not-for-profit Organizations | 107 | 12.9% |
| Local Government Employees | 162 | 19.6% |
| State Government Employees | 81 | 9.8% |
| Federal Government Employees | 9 | 1.1% |
| Unpaid Family Workers | 0 | 0.0% |
| Total | 828 | 100.0% |
Employment Status by Age in Kingstown
According to the labor force statistics for Kingstown, out of the total population over 16 years of age (1,626), 51.6% or 839 individuals are in the labor force, with 1.3% or 11 of them unemployed. The age group with the highest labor force participation rate is 25 to 29 years, with 100.0% or 20 individuals in the labor force. Within the labor force, the 20 to 24 years age range has the highest percentage of unemployed individuals, with 18.3% or 11 of them being unemployed.
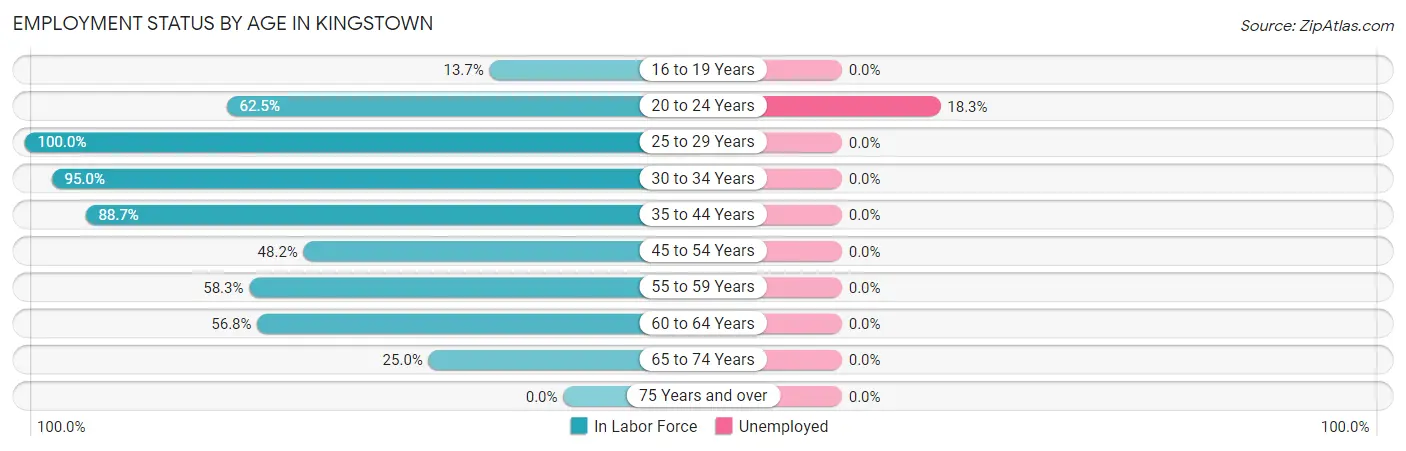
| Age Bracket | In Labor Force | Unemployed |
| 16 to 19 Years | 17 (13.7%) | 0 (0.0%) |
| 20 to 24 Years | 60 (62.5%) | 11 (18.3%) |
| 25 to 29 Years | 20 (100.0%) | 0 (0.0%) |
| 30 to 34 Years | 113 (95.0%) | 0 (0.0%) |
| 35 to 44 Years | 259 (88.7%) | 0 (0.0%) |
| 45 to 54 Years | 132 (48.2%) | 0 (0.0%) |
| 55 to 59 Years | 137 (58.3%) | 0 (0.0%) |
| 60 to 64 Years | 46 (56.8%) | 0 (0.0%) |
| 65 to 74 Years | 55 (25.0%) | 0 (0.0%) |
| 75 Years and over | 0 (0.0%) | 0 (0.0%) |
| Total | 839 (51.6%) | 11 (1.3%) |
Employment Status by Educational Attainment in Kingstown
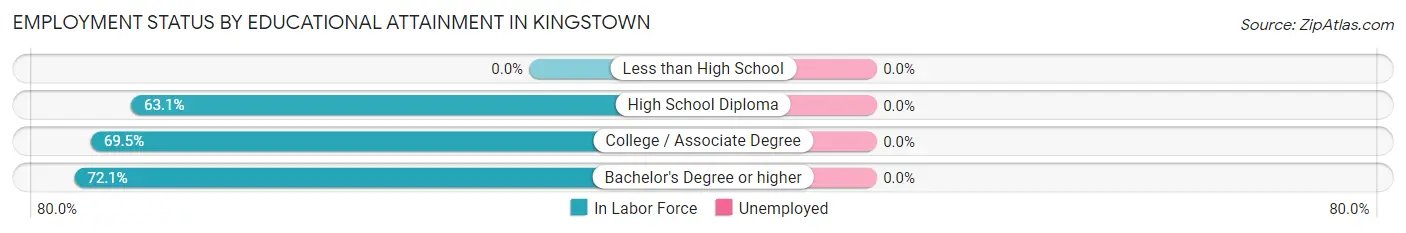
| Educational Attainment | In Labor Force | Unemployed |
| Less than High School | 0 (0.0%) | 0 (0.0%) |
| High School Diploma | 65 (63.1%) | 0 (0.0%) |
| College / Associate Degree | 273 (69.5%) | 0 (0.0%) |
| Bachelor's Degree or higher | 369 (72.1%) | 0 (0.0%) |
| Total | 707 (69.2%) | 0 (0.0%) |
Employment Occupations by Sex in Kingstown
Management, Business, Science and Arts Occupations
The most common Management, Business, Science and Arts occupations in Kingstown are Community & Social Service (144 | 17.4%), Management (129 | 15.6%), Business & Financial (81 | 9.8%), Health Diagnosing & Treating (72 | 8.7%), and Education Instruction & Library (68 | 8.2%).
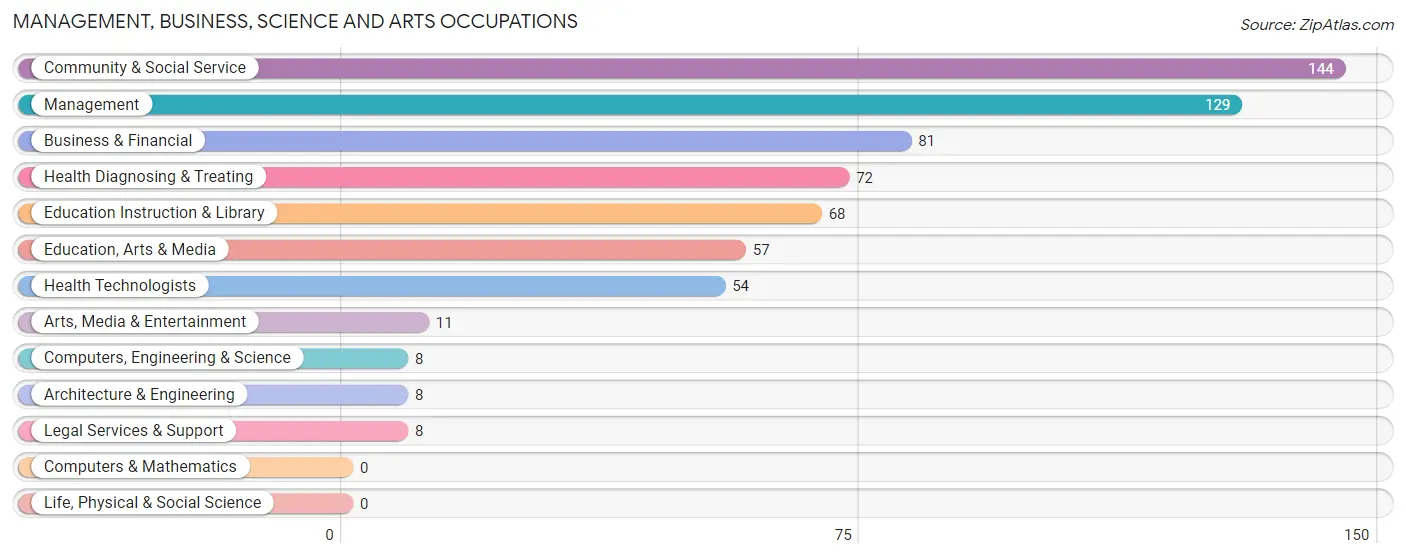
Management, Business, Science and Arts Occupations by Sex
Within the Management, Business, Science and Arts occupations in Kingstown, the most male-oriented occupations are Computers, Engineering & Science (100.0%), Architecture & Engineering (100.0%), and Management (47.3%), while the most female-oriented occupations are Education, Arts & Media (100.0%), Legal Services & Support (100.0%), and Arts, Media & Entertainment (100.0%).
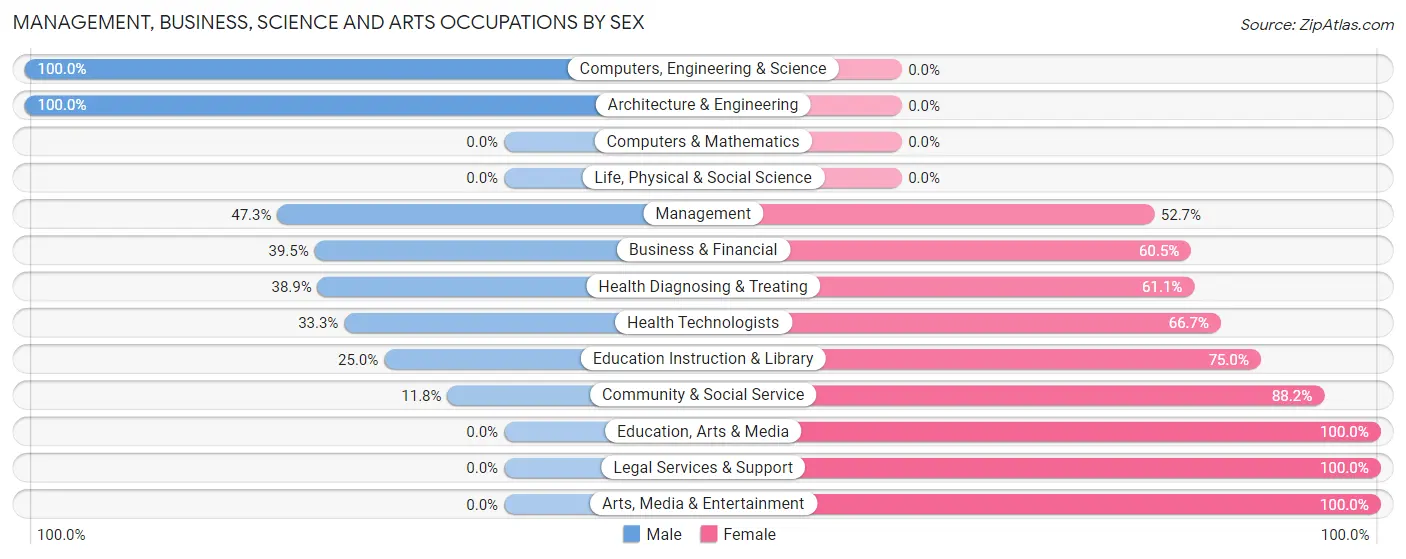
| Occupation | Male | Female |
| Management | 61 (47.3%) | 68 (52.7%) |
| Business & Financial | 32 (39.5%) | 49 (60.5%) |
| Computers, Engineering & Science | 8 (100.0%) | 0 (0.0%) |
| Computers & Mathematics | 0 (0.0%) | 0 (0.0%) |
| Architecture & Engineering | 8 (100.0%) | 0 (0.0%) |
| Life, Physical & Social Science | 0 (0.0%) | 0 (0.0%) |
| Community & Social Service | 17 (11.8%) | 127 (88.2%) |
| Education, Arts & Media | 0 (0.0%) | 57 (100.0%) |
| Legal Services & Support | 0 (0.0%) | 8 (100.0%) |
| Education Instruction & Library | 17 (25.0%) | 51 (75.0%) |
| Arts, Media & Entertainment | 0 (0.0%) | 11 (100.0%) |
| Health Diagnosing & Treating | 28 (38.9%) | 44 (61.1%) |
| Health Technologists | 18 (33.3%) | 36 (66.7%) |
| Total (Category) | 146 (33.6%) | 288 (66.4%) |
| Total (Overall) | 372 (44.9%) | 456 (55.1%) |
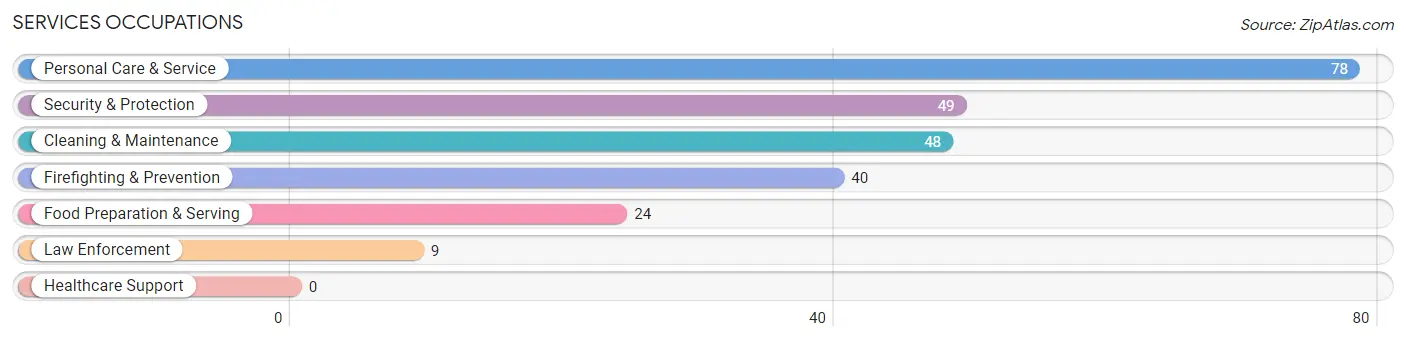
Services Occupations
The most common Services occupations in Kingstown are Personal Care & Service (78 | 9.4%), Security & Protection (49 | 5.9%), Cleaning & Maintenance (48 | 5.8%), Firefighting & Prevention (40 | 4.8%), and Food Preparation & Serving (24 | 2.9%).
Services Occupations by Sex
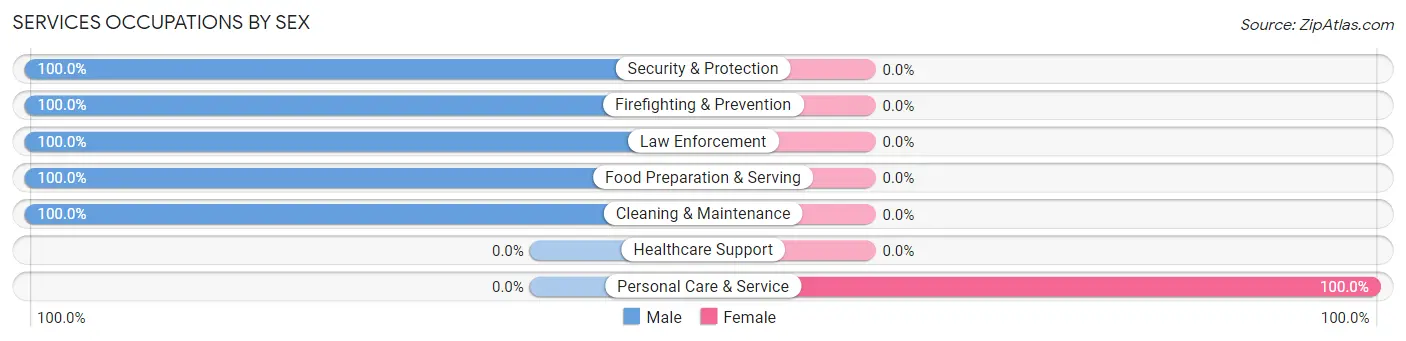
| Occupation | Male | Female |
| Healthcare Support | 0 (0.0%) | 0 (0.0%) |
| Security & Protection | 49 (100.0%) | 0 (0.0%) |
| Firefighting & Prevention | 40 (100.0%) | 0 (0.0%) |
| Law Enforcement | 9 (100.0%) | 0 (0.0%) |
| Food Preparation & Serving | 24 (100.0%) | 0 (0.0%) |
| Cleaning & Maintenance | 48 (100.0%) | 0 (0.0%) |
| Personal Care & Service | 0 (0.0%) | 78 (100.0%) |
| Total (Category) | 121 (60.8%) | 78 (39.2%) |
| Total (Overall) | 372 (44.9%) | 456 (55.1%) |
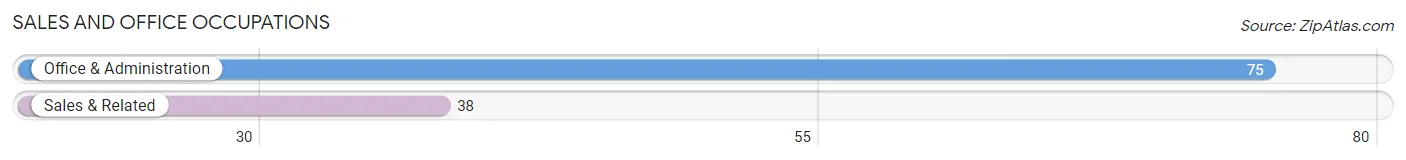
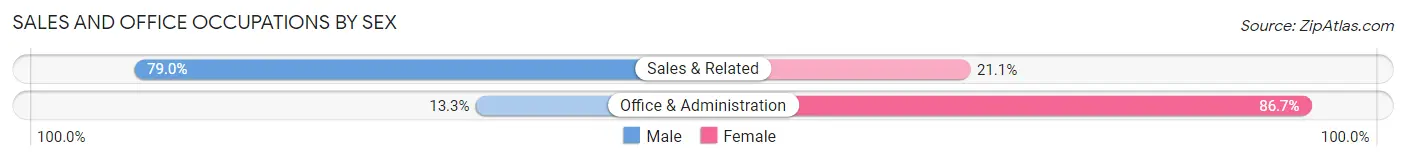
Sales and Office Occupations
The most common Sales and Office occupations in Kingstown are Office & Administration (75 | 9.1%), and Sales & Related (38 | 4.6%).
Sales and Office Occupations by Sex
| Occupation | Male | Female |
| Sales & Related | 30 (78.9%) | 8 (21.0%) |
| Office & Administration | 10 (13.3%) | 65 (86.7%) |
| Total (Category) | 40 (35.4%) | 73 (64.6%) |
| Total (Overall) | 372 (44.9%) | 456 (55.1%) |
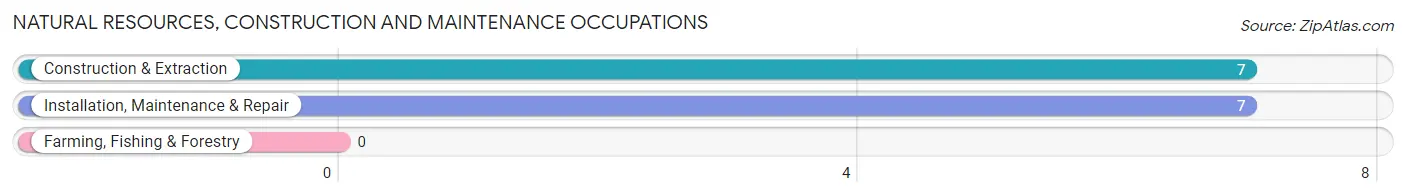
Natural Resources, Construction and Maintenance Occupations
The most common Natural Resources, Construction and Maintenance occupations in Kingstown are Construction & Extraction (7 | 0.9%), and Installation, Maintenance & Repair (7 | 0.9%).
Natural Resources, Construction and Maintenance Occupations by Sex
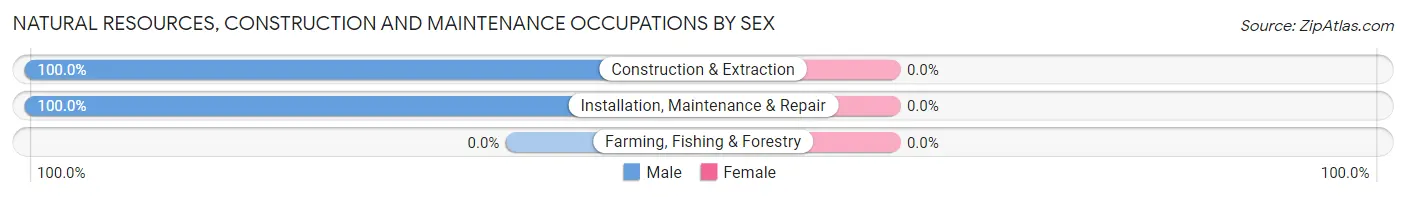
| Occupation | Male | Female |
| Farming, Fishing & Forestry | 0 (0.0%) | 0 (0.0%) |
| Construction & Extraction | 7 (100.0%) | 0 (0.0%) |
| Installation, Maintenance & Repair | 7 (100.0%) | 0 (0.0%) |
| Total (Category) | 14 (100.0%) | 0 (0.0%) |
| Total (Overall) | 372 (44.9%) | 456 (55.1%) |
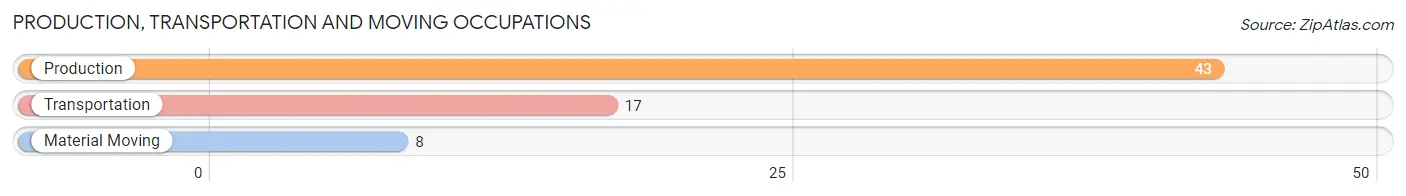
Production, Transportation and Moving Occupations
The most common Production, Transportation and Moving occupations in Kingstown are Production (43 | 5.2%), Transportation (17 | 2.1%), and Material Moving (8 | 1.0%).
Production, Transportation and Moving Occupations by Sex
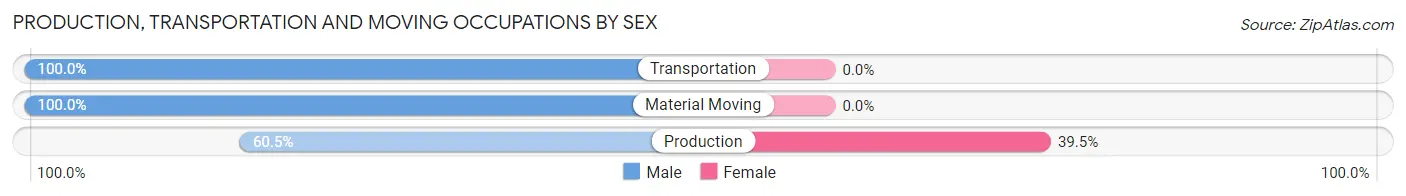
| Occupation | Male | Female |
| Production | 26 (60.5%) | 17 (39.5%) |
| Transportation | 17 (100.0%) | 0 (0.0%) |
| Material Moving | 8 (100.0%) | 0 (0.0%) |
| Total (Category) | 51 (75.0%) | 17 (25.0%) |
| Total (Overall) | 372 (44.9%) | 456 (55.1%) |
Employment Industries by Sex in Kingstown
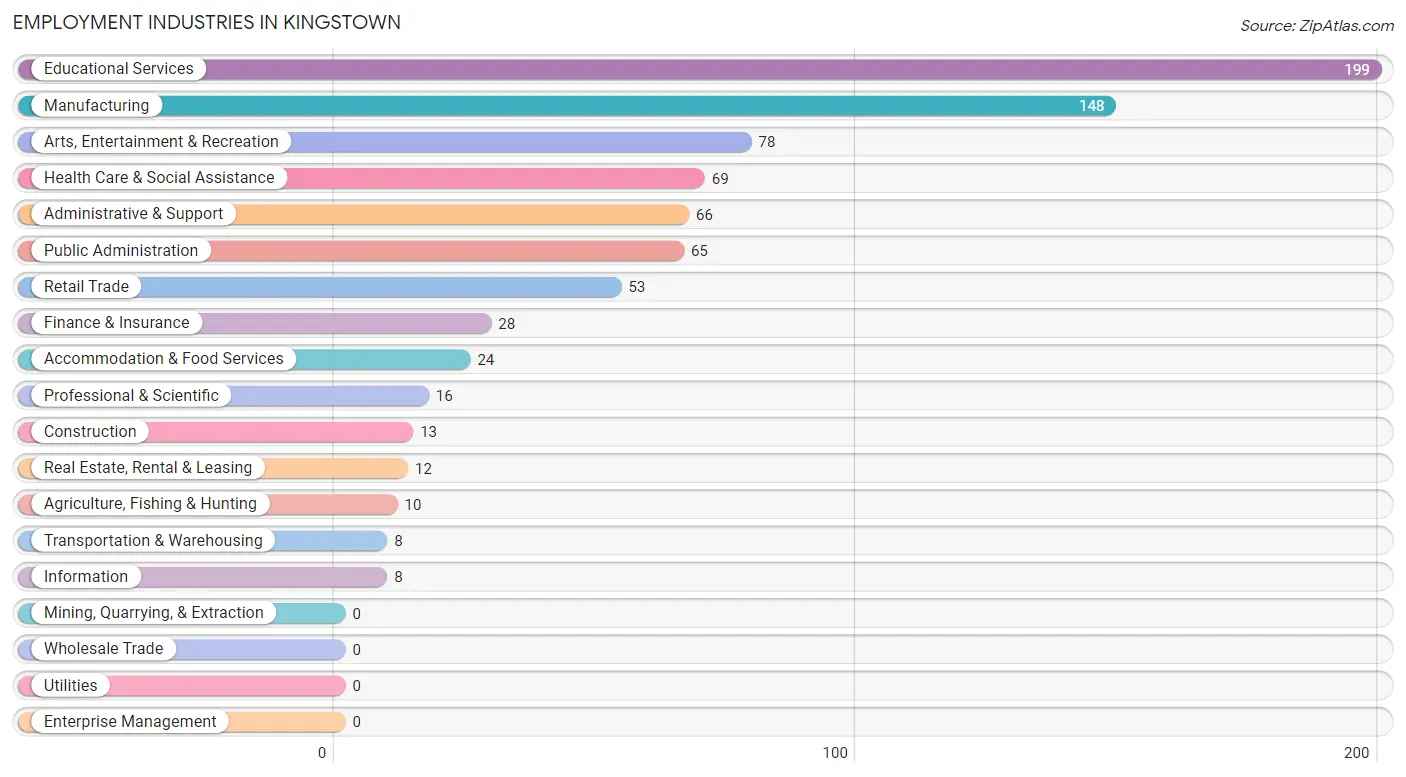
Employment Industries in Kingstown
The major employment industries in Kingstown include Educational Services (199 | 24.0%), Manufacturing (148 | 17.9%), Arts, Entertainment & Recreation (78 | 9.4%), Health Care & Social Assistance (69 | 8.3%), and Administrative & Support (66 | 8.0%).
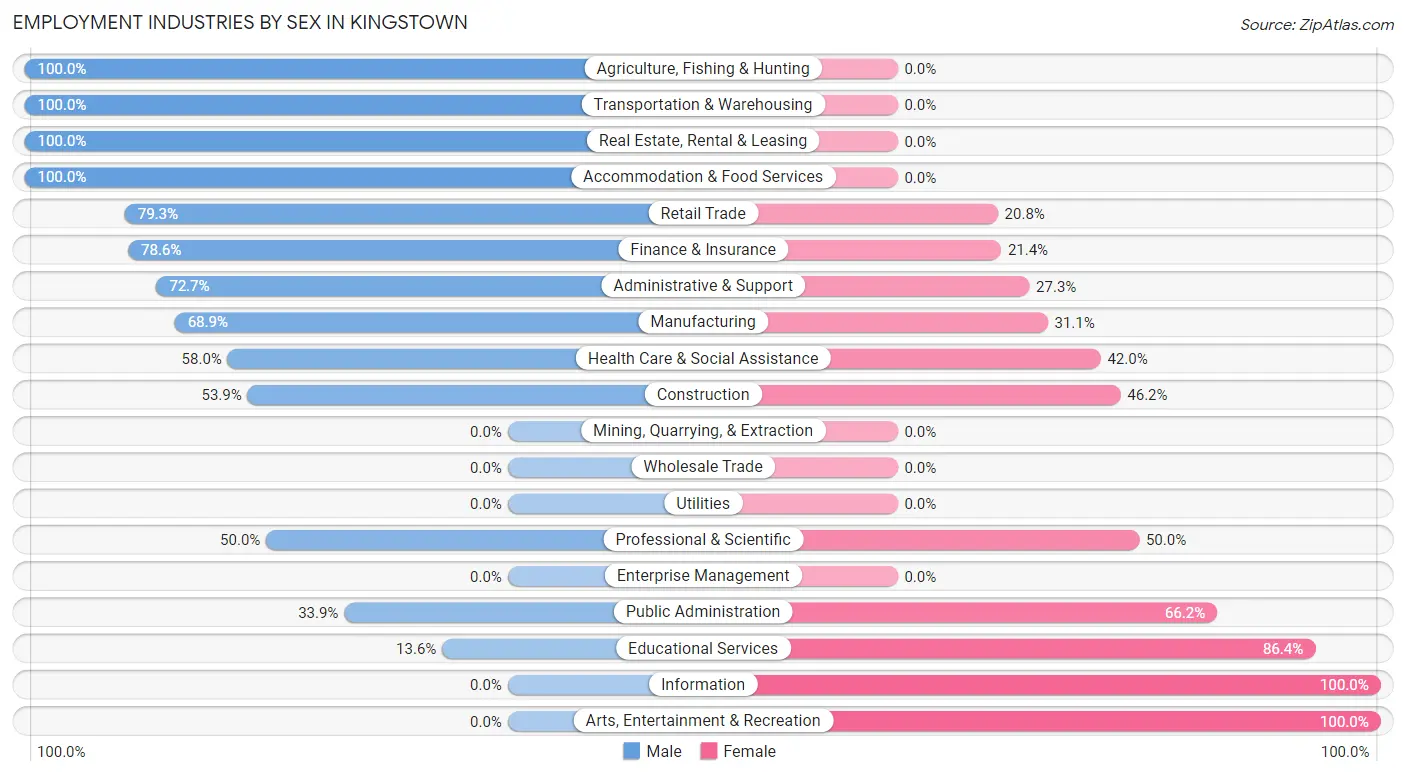
Employment Industries by Sex in Kingstown
The Kingstown industries that see more men than women are Agriculture, Fishing & Hunting (100.0%), Transportation & Warehousing (100.0%), and Real Estate, Rental & Leasing (100.0%), whereas the industries that tend to have a higher number of women are Information (100.0%), Arts, Entertainment & Recreation (100.0%), and Educational Services (86.4%).
| Industry | Male | Female |
| Agriculture, Fishing & Hunting | 10 (100.0%) | 0 (0.0%) |
| Mining, Quarrying, & Extraction | 0 (0.0%) | 0 (0.0%) |
| Construction | 7 (53.8%) | 6 (46.2%) |
| Manufacturing | 102 (68.9%) | 46 (31.1%) |
| Wholesale Trade | 0 (0.0%) | 0 (0.0%) |
| Retail Trade | 42 (79.2%) | 11 (20.7%) |
| Transportation & Warehousing | 8 (100.0%) | 0 (0.0%) |
| Utilities | 0 (0.0%) | 0 (0.0%) |
| Information | 0 (0.0%) | 8 (100.0%) |
| Finance & Insurance | 22 (78.6%) | 6 (21.4%) |
| Real Estate, Rental & Leasing | 12 (100.0%) | 0 (0.0%) |
| Professional & Scientific | 8 (50.0%) | 8 (50.0%) |
| Enterprise Management | 0 (0.0%) | 0 (0.0%) |
| Administrative & Support | 48 (72.7%) | 18 (27.3%) |
| Educational Services | 27 (13.6%) | 172 (86.4%) |
| Health Care & Social Assistance | 40 (58.0%) | 29 (42.0%) |
| Arts, Entertainment & Recreation | 0 (0.0%) | 78 (100.0%) |
| Accommodation & Food Services | 24 (100.0%) | 0 (0.0%) |
| Public Administration | 22 (33.9%) | 43 (66.1%) |
| Total | 372 (44.9%) | 456 (55.1%) |
Education in Kingstown
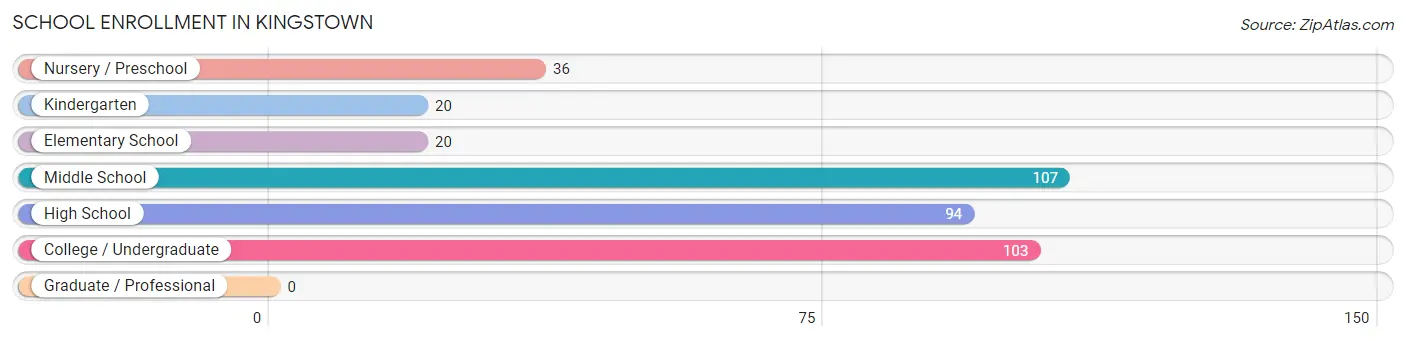
School Enrollment in Kingstown
The most common levels of schooling among the 380 students in Kingstown are middle school (107 | 28.2%), college / undergraduate (103 | 27.1%), and high school (94 | 24.7%).
| School Level | # Students | % Students |
| Nursery / Preschool | 36 | 9.5% |
| Kindergarten | 20 | 5.3% |
| Elementary School | 20 | 5.3% |
| Middle School | 107 | 28.2% |
| High School | 94 | 24.7% |
| College / Undergraduate | 103 | 27.1% |
| Graduate / Professional | 0 | 0.0% |
| Total | 380 | 100.0% |
School Enrollment by Age by Funding Source in Kingstown
Out of a total of 380 students who are enrolled in schools in Kingstown, 157 (41.3%) attend a private institution, while the remaining 223 (58.7%) are enrolled in public schools. The age group of 18 to 19 year olds has the highest likelihood of being enrolled in private schools, with 47 (100.0% in the age bracket) enrolled. Conversely, the age group of 35 years and over has the lowest likelihood of being enrolled in a private school, with 9 (100.0% in the age bracket) attending a public institution.
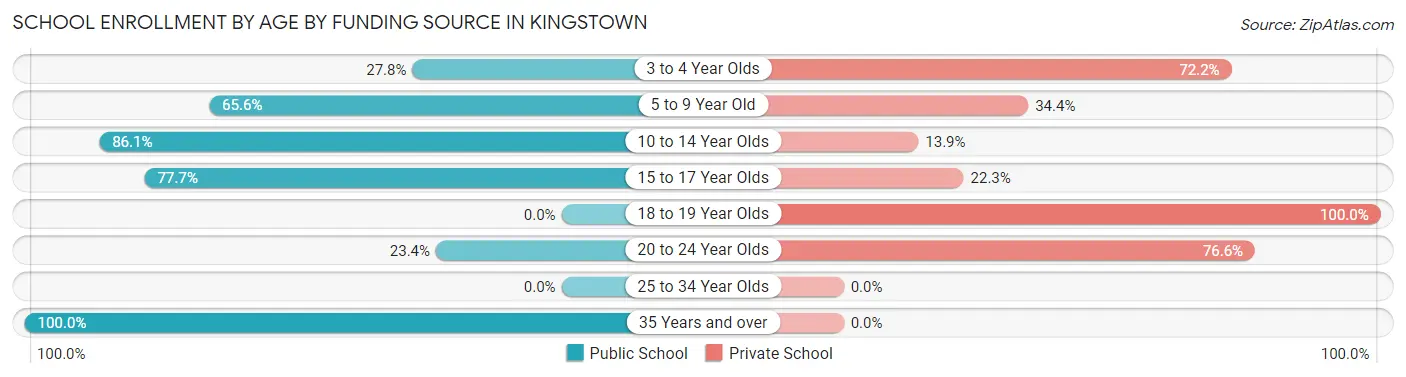
| Age Bracket | Public School | Private School |
| 3 to 4 Year Olds | 10 (27.8%) | 26 (72.2%) |
| 5 to 9 Year Old | 21 (65.6%) | 11 (34.4%) |
| 10 to 14 Year Olds | 99 (86.1%) | 16 (13.9%) |
| 15 to 17 Year Olds | 73 (77.7%) | 21 (22.3%) |
| 18 to 19 Year Olds | 0 (0.0%) | 47 (100.0%) |
| 20 to 24 Year Olds | 11 (23.4%) | 36 (76.6%) |
| 25 to 34 Year Olds | 0 (0.0%) | 0 (0.0%) |
| 35 Years and over | 9 (100.0%) | 0 (0.0%) |
| Total | 223 (58.7%) | 157 (41.3%) |
Educational Attainment by Field of Study in Kingstown
Science & technology (223 | 28.1%), social sciences (121 | 15.3%), psychology (107 | 13.5%), business (84 | 10.6%), and education (52 | 6.6%) are the most common fields of study among 793 individuals in Kingstown who have obtained a bachelor's degree or higher.
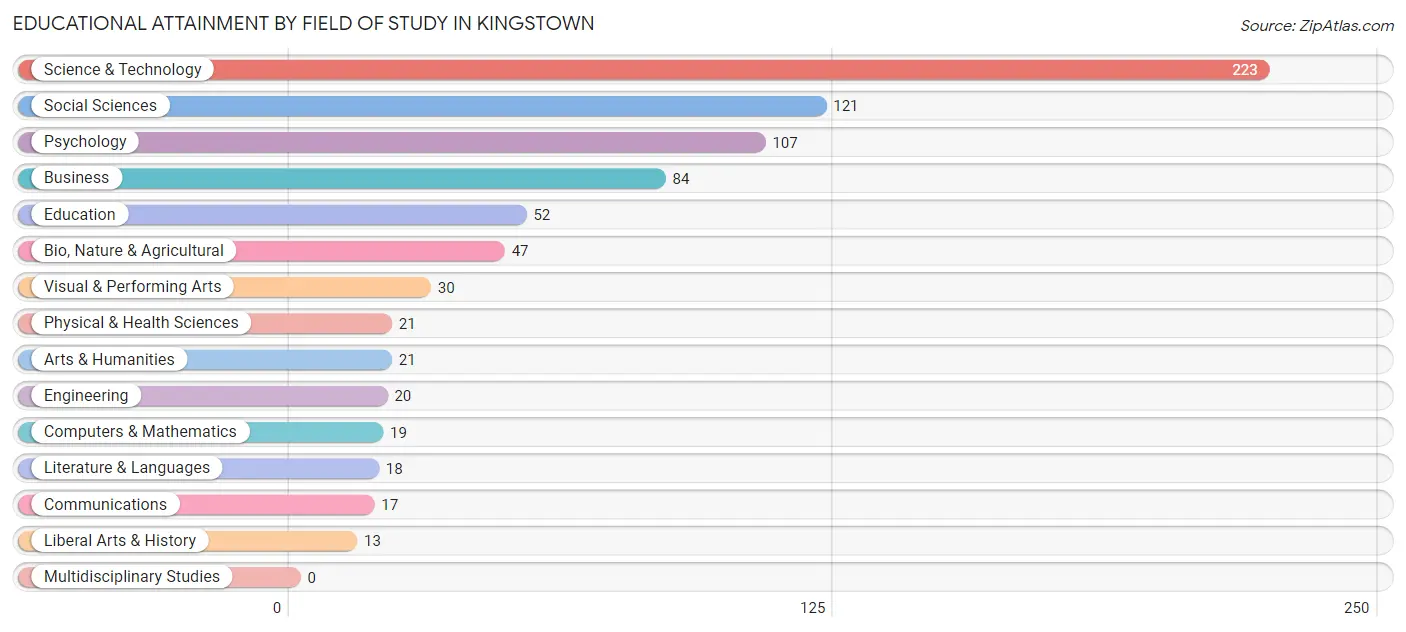
| Field of Study | # Graduates | % Graduates |
| Computers & Mathematics | 19 | 2.4% |
| Bio, Nature & Agricultural | 47 | 5.9% |
| Physical & Health Sciences | 21 | 2.6% |
| Psychology | 107 | 13.5% |
| Social Sciences | 121 | 15.3% |
| Engineering | 20 | 2.5% |
| Multidisciplinary Studies | 0 | 0.0% |
| Science & Technology | 223 | 28.1% |
| Business | 84 | 10.6% |
| Education | 52 | 6.6% |
| Literature & Languages | 18 | 2.3% |
| Liberal Arts & History | 13 | 1.6% |
| Visual & Performing Arts | 30 | 3.8% |
| Communications | 17 | 2.1% |
| Arts & Humanities | 21 | 2.6% |
| Total | 793 | 100.0% |
Transportation & Commute in Kingstown
Vehicle Availability by Sex in Kingstown
The most prevalent vehicle ownership categories in Kingstown are males with 3 vehicles (115, accounting for 30.9%) and females with 3 vehicles (65, making up 25.2%).
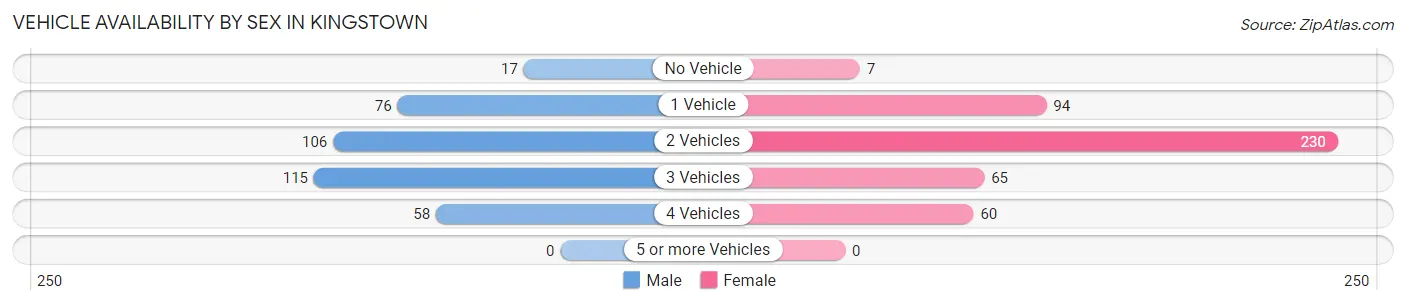
| Vehicles Available | Male | Female |
| No Vehicle | 17 (4.6%) | 7 (1.5%) |
| 1 Vehicle | 76 (20.4%) | 94 (20.6%) |
| 2 Vehicles | 106 (28.5%) | 230 (50.4%) |
| 3 Vehicles | 115 (30.9%) | 65 (14.2%) |
| 4 Vehicles | 58 (15.6%) | 60 (13.2%) |
| 5 or more Vehicles | 0 (0.0%) | 0 (0.0%) |
| Total | 372 (100.0%) | 456 (100.0%) |
Commute Time in Kingstown
The most frequently occuring commute durations in Kingstown are 5 to 9 minutes (265 commuters, 33.8%), 10 to 14 minutes (138 commuters, 17.6%), and 20 to 24 minutes (137 commuters, 17.4%).
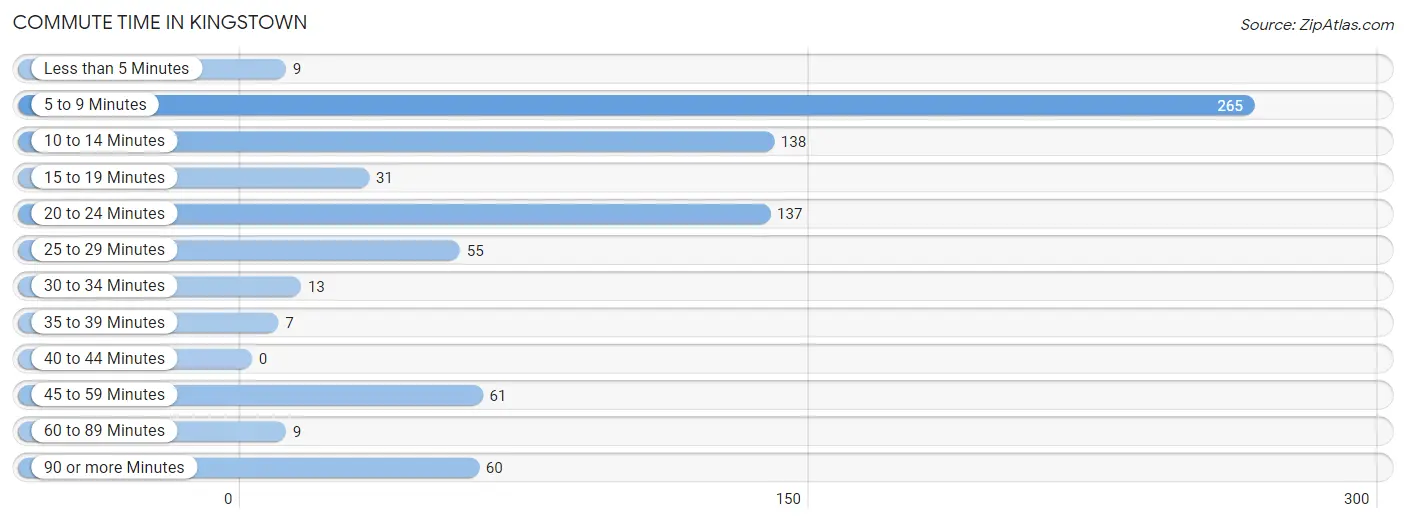
| Commute Time | # Commuters | % Commuters |
| Less than 5 Minutes | 9 | 1.1% |
| 5 to 9 Minutes | 265 | 33.8% |
| 10 to 14 Minutes | 138 | 17.6% |
| 15 to 19 Minutes | 31 | 4.0% |
| 20 to 24 Minutes | 137 | 17.4% |
| 25 to 29 Minutes | 55 | 7.0% |
| 30 to 34 Minutes | 13 | 1.7% |
| 35 to 39 Minutes | 7 | 0.9% |
| 40 to 44 Minutes | 0 | 0.0% |
| 45 to 59 Minutes | 61 | 7.8% |
| 60 to 89 Minutes | 9 | 1.1% |
| 90 or more Minutes | 60 | 7.6% |
Commute Time by Sex in Kingstown
The most common commute times in Kingstown are 5 to 9 minutes (104 commuters, 30.2%) for males and 5 to 9 minutes (161 commuters, 36.5%) for females.
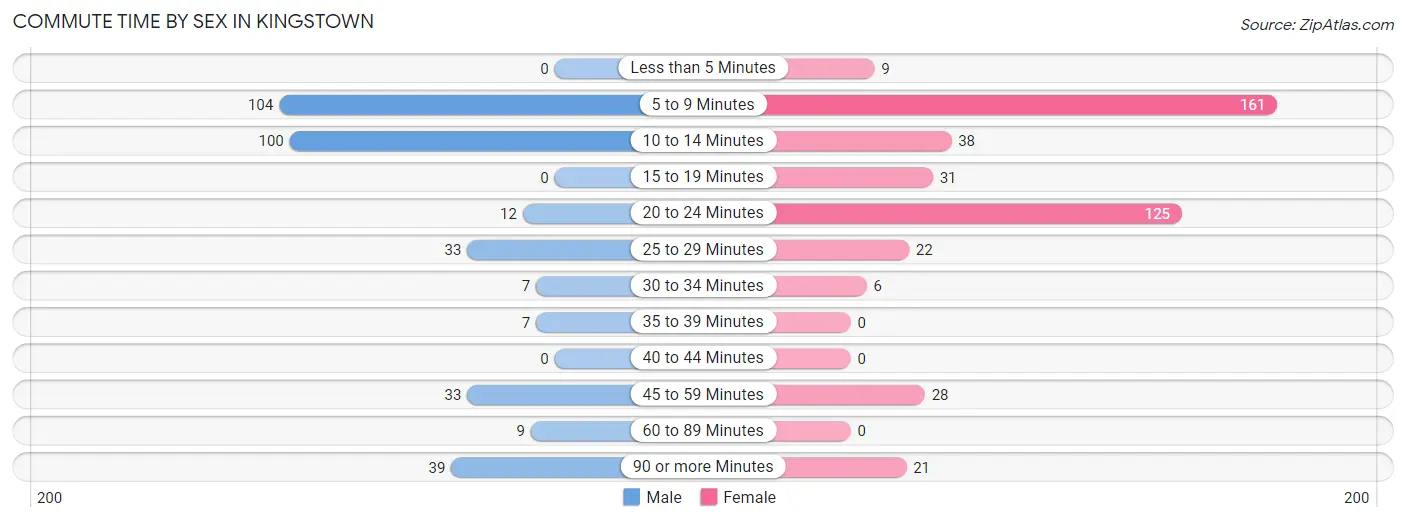
| Commute Time | Male | Female |
| Less than 5 Minutes | 0 (0.0%) | 9 (2.0%) |
| 5 to 9 Minutes | 104 (30.2%) | 161 (36.5%) |
| 10 to 14 Minutes | 100 (29.1%) | 38 (8.6%) |
| 15 to 19 Minutes | 0 (0.0%) | 31 (7.0%) |
| 20 to 24 Minutes | 12 (3.5%) | 125 (28.3%) |
| 25 to 29 Minutes | 33 (9.6%) | 22 (5.0%) |
| 30 to 34 Minutes | 7 (2.0%) | 6 (1.4%) |
| 35 to 39 Minutes | 7 (2.0%) | 0 (0.0%) |
| 40 to 44 Minutes | 0 (0.0%) | 0 (0.0%) |
| 45 to 59 Minutes | 33 (9.6%) | 28 (6.4%) |
| 60 to 89 Minutes | 9 (2.6%) | 0 (0.0%) |
| 90 or more Minutes | 39 (11.3%) | 21 (4.8%) |
Time of Departure to Work by Sex in Kingstown
The most frequent times of departure to work in Kingstown are 7:30 AM to 7:59 AM (58, 16.9%) for males and 8:30 AM to 8:59 AM (169, 38.3%) for females.
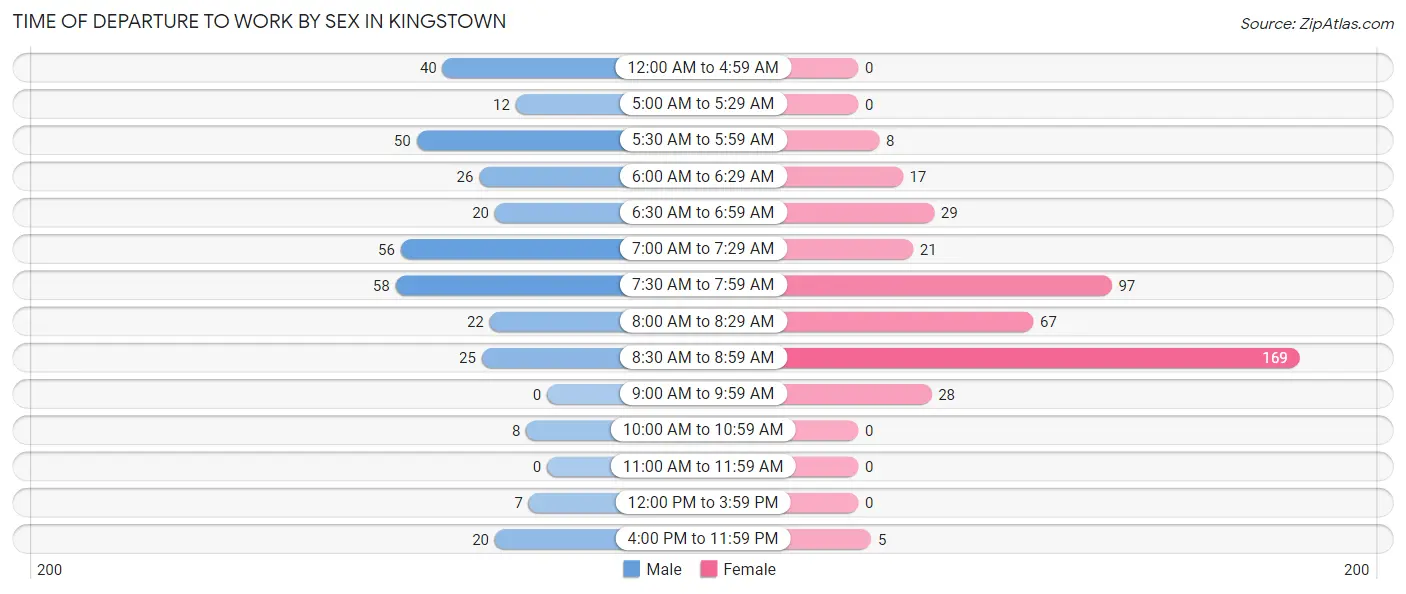
| Time of Departure | Male | Female |
| 12:00 AM to 4:59 AM | 40 (11.6%) | 0 (0.0%) |
| 5:00 AM to 5:29 AM | 12 (3.5%) | 0 (0.0%) |
| 5:30 AM to 5:59 AM | 50 (14.5%) | 8 (1.8%) |
| 6:00 AM to 6:29 AM | 26 (7.6%) | 17 (3.8%) |
| 6:30 AM to 6:59 AM | 20 (5.8%) | 29 (6.6%) |
| 7:00 AM to 7:29 AM | 56 (16.3%) | 21 (4.8%) |
| 7:30 AM to 7:59 AM | 58 (16.9%) | 97 (22.0%) |
| 8:00 AM to 8:29 AM | 22 (6.4%) | 67 (15.2%) |
| 8:30 AM to 8:59 AM | 25 (7.3%) | 169 (38.3%) |
| 9:00 AM to 9:59 AM | 0 (0.0%) | 28 (6.4%) |
| 10:00 AM to 10:59 AM | 8 (2.3%) | 0 (0.0%) |
| 11:00 AM to 11:59 AM | 0 (0.0%) | 0 (0.0%) |
| 12:00 PM to 3:59 PM | 7 (2.0%) | 0 (0.0%) |
| 4:00 PM to 11:59 PM | 20 (5.8%) | 5 (1.1%) |
| Total | 344 (100.0%) | 441 (100.0%) |
Housing Occupancy in Kingstown
Occupancy by Ownership in Kingstown
Of the total 852 dwellings in Kingstown, owner-occupied units account for 747 (87.7%), while renter-occupied units make up 105 (12.3%).
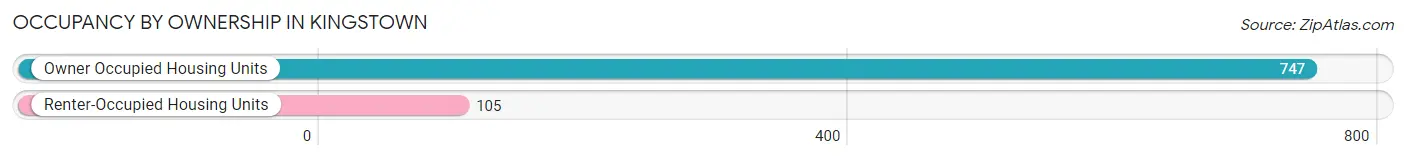
| Occupancy | # Housing Units | % Housing Units |
| Owner Occupied Housing Units | 747 | 87.7% |
| Renter-Occupied Housing Units | 105 | 12.3% |
| Total Occupied Housing Units | 852 | 100.0% |
Occupancy by Household Size in Kingstown
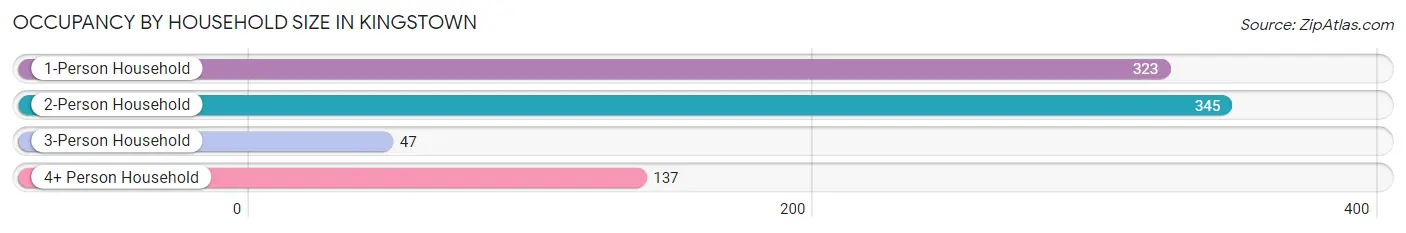
| Household Size | # Housing Units | % Housing Units |
| 1-Person Household | 323 | 37.9% |
| 2-Person Household | 345 | 40.5% |
| 3-Person Household | 47 | 5.5% |
| 4+ Person Household | 137 | 16.1% |
| Total Housing Units | 852 | 100.0% |
Occupancy by Ownership by Household Size in Kingstown
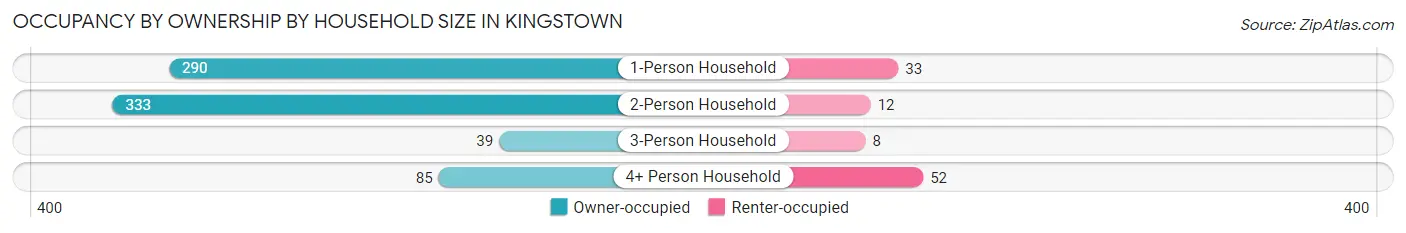
| Household Size | Owner-occupied | Renter-occupied |
| 1-Person Household | 290 (89.8%) | 33 (10.2%) |
| 2-Person Household | 333 (96.5%) | 12 (3.5%) |
| 3-Person Household | 39 (83.0%) | 8 (17.0%) |
| 4+ Person Household | 85 (62.0%) | 52 (38.0%) |
| Total Housing Units | 747 (87.7%) | 105 (12.3%) |
Occupancy by Educational Attainment in Kingstown
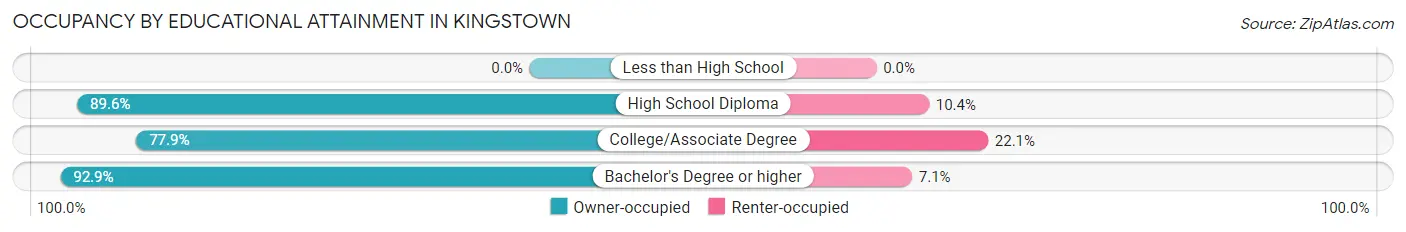
| Household Size | Owner-occupied | Renter-occupied |
| Less than High School | 0 (0.0%) | 0 (0.0%) |
| High School Diploma | 103 (89.6%) | 12 (10.4%) |
| College/Associate Degree | 211 (77.9%) | 60 (22.1%) |
| Bachelor's Degree or higher | 433 (92.9%) | 33 (7.1%) |
Occupancy by Age of Householder in Kingstown
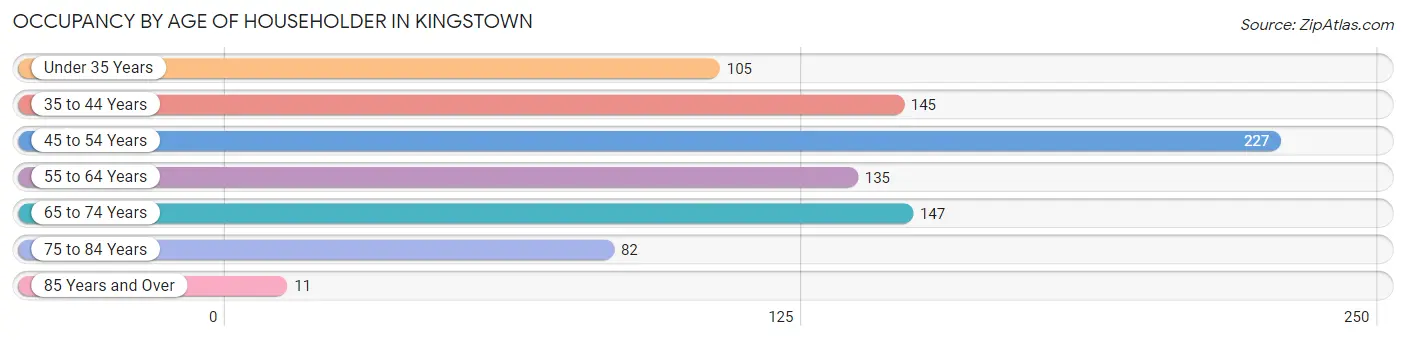
| Age Bracket | # Households | % Households |
| Under 35 Years | 105 | 12.3% |
| 35 to 44 Years | 145 | 17.0% |
| 45 to 54 Years | 227 | 26.6% |
| 55 to 64 Years | 135 | 15.9% |
| 65 to 74 Years | 147 | 17.2% |
| 75 to 84 Years | 82 | 9.6% |
| 85 Years and Over | 11 | 1.3% |
| Total | 852 | 100.0% |
Housing Finances in Kingstown
Median Income by Occupancy in Kingstown
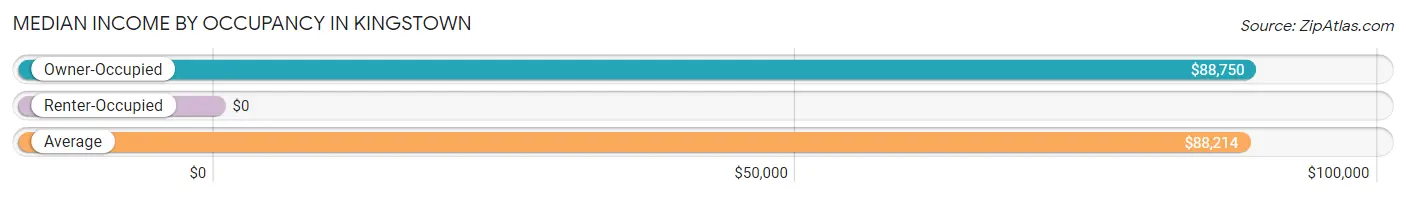
| Occupancy Type | # Households | Median Income |
| Owner-Occupied | 747 (87.7%) | $88,750 |
| Renter-Occupied | 105 (12.3%) | $0 |
| Average | 852 (100.0%) | $88,214 |
Occupancy by Householder Income Bracket in Kingstown
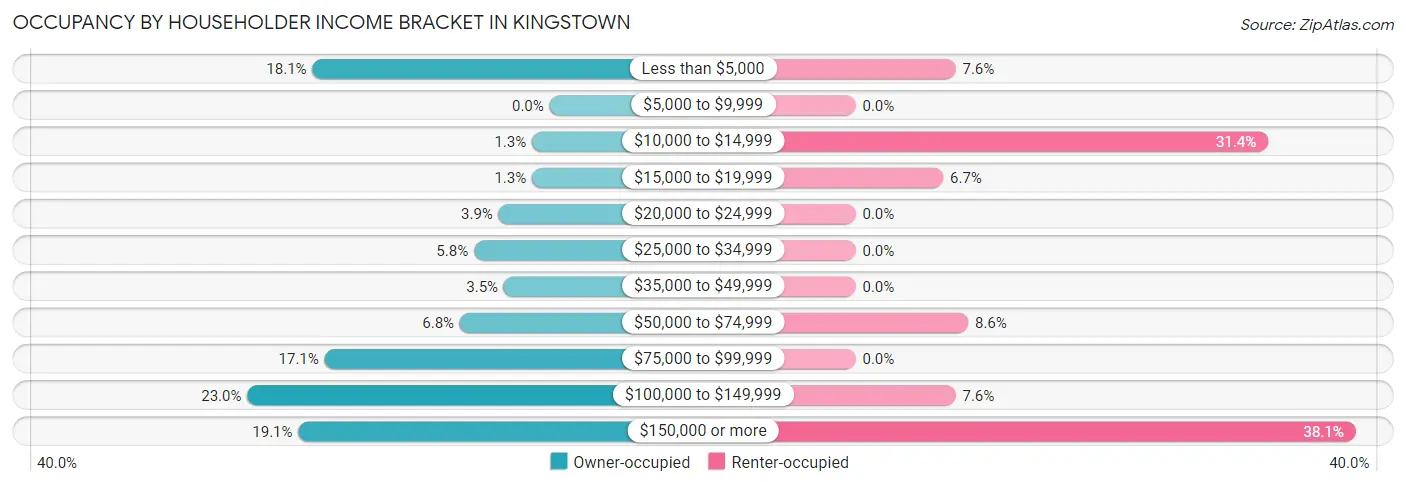
| Income Bracket | Owner-occupied | Renter-occupied |
| Less than $5,000 | 135 (18.1%) | 8 (7.6%) |
| $5,000 to $9,999 | 0 (0.0%) | 0 (0.0%) |
| $10,000 to $14,999 | 10 (1.3%) | 33 (31.4%) |
| $15,000 to $19,999 | 10 (1.3%) | 7 (6.7%) |
| $20,000 to $24,999 | 29 (3.9%) | 0 (0.0%) |
| $25,000 to $34,999 | 43 (5.8%) | 0 (0.0%) |
| $35,000 to $49,999 | 26 (3.5%) | 0 (0.0%) |
| $50,000 to $74,999 | 51 (6.8%) | 9 (8.6%) |
| $75,000 to $99,999 | 128 (17.1%) | 0 (0.0%) |
| $100,000 to $149,999 | 172 (23.0%) | 8 (7.6%) |
| $150,000 or more | 143 (19.1%) | 40 (38.1%) |
| Total | 747 (100.0%) | 105 (100.0%) |
Monthly Housing Cost Tiers in Kingstown
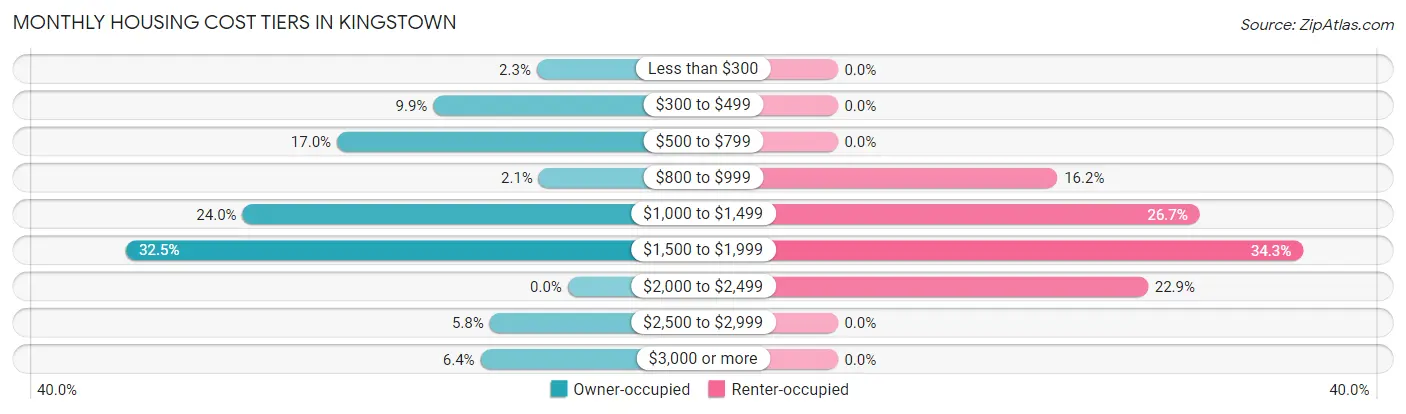
| Monthly Cost | Owner-occupied | Renter-occupied |
| Less than $300 | 17 (2.3%) | 0 (0.0%) |
| $300 to $499 | 74 (9.9%) | 0 (0.0%) |
| $500 to $799 | 127 (17.0%) | 0 (0.0%) |
| $800 to $999 | 16 (2.1%) | 17 (16.2%) |
| $1,000 to $1,499 | 179 (24.0%) | 28 (26.7%) |
| $1,500 to $1,999 | 243 (32.5%) | 36 (34.3%) |
| $2,000 to $2,499 | 0 (0.0%) | 24 (22.9%) |
| $2,500 to $2,999 | 43 (5.8%) | 0 (0.0%) |
| $3,000 or more | 48 (6.4%) | 0 (0.0%) |
| Total | 747 (100.0%) | 105 (100.0%) |
Physical Housing Characteristics in Kingstown
Housing Structures in Kingstown
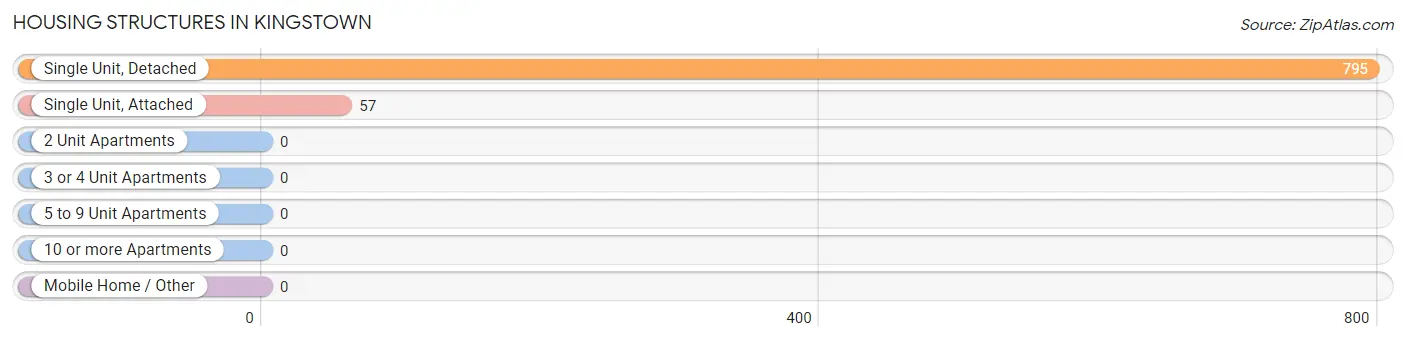
| Structure Type | # Housing Units | % Housing Units |
| Single Unit, Detached | 795 | 93.3% |
| Single Unit, Attached | 57 | 6.7% |
| 2 Unit Apartments | 0 | 0.0% |
| 3 or 4 Unit Apartments | 0 | 0.0% |
| 5 to 9 Unit Apartments | 0 | 0.0% |
| 10 or more Apartments | 0 | 0.0% |
| Mobile Home / Other | 0 | 0.0% |
| Total | 852 | 100.0% |
Housing Structures by Occupancy in Kingstown
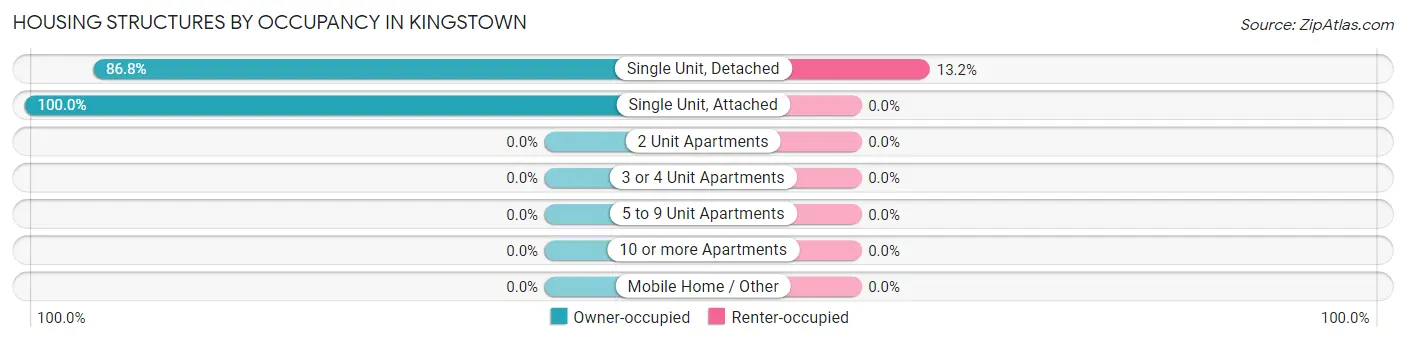
| Structure Type | Owner-occupied | Renter-occupied |
| Single Unit, Detached | 690 (86.8%) | 105 (13.2%) |
| Single Unit, Attached | 57 (100.0%) | 0 (0.0%) |
| 2 Unit Apartments | 0 (0.0%) | 0 (0.0%) |
| 3 or 4 Unit Apartments | 0 (0.0%) | 0 (0.0%) |
| 5 to 9 Unit Apartments | 0 (0.0%) | 0 (0.0%) |
| 10 or more Apartments | 0 (0.0%) | 0 (0.0%) |
| Mobile Home / Other | 0 (0.0%) | 0 (0.0%) |
| Total | 747 (87.7%) | 105 (12.3%) |
Housing Structures by Number of Rooms in Kingstown
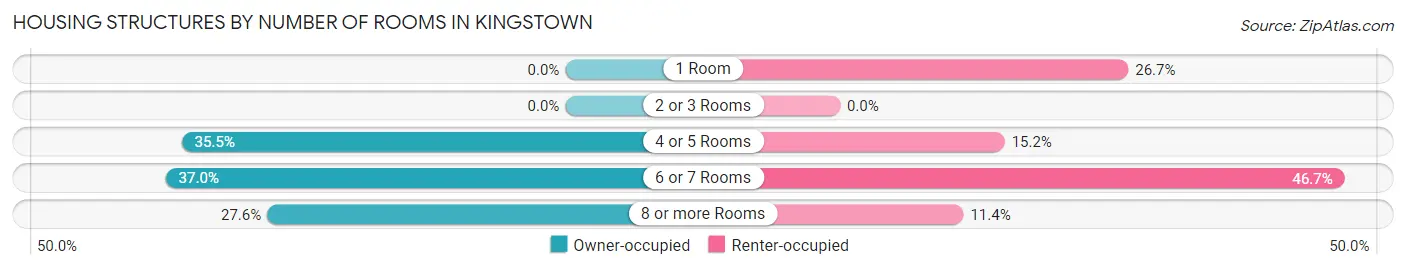
| Number of Rooms | Owner-occupied | Renter-occupied |
| 1 Room | 0 (0.0%) | 28 (26.7%) |
| 2 or 3 Rooms | 0 (0.0%) | 0 (0.0%) |
| 4 or 5 Rooms | 265 (35.5%) | 16 (15.2%) |
| 6 or 7 Rooms | 276 (36.9%) | 49 (46.7%) |
| 8 or more Rooms | 206 (27.6%) | 12 (11.4%) |
| Total | 747 (100.0%) | 105 (100.0%) |
Housing Structure by Heating Type in Kingstown
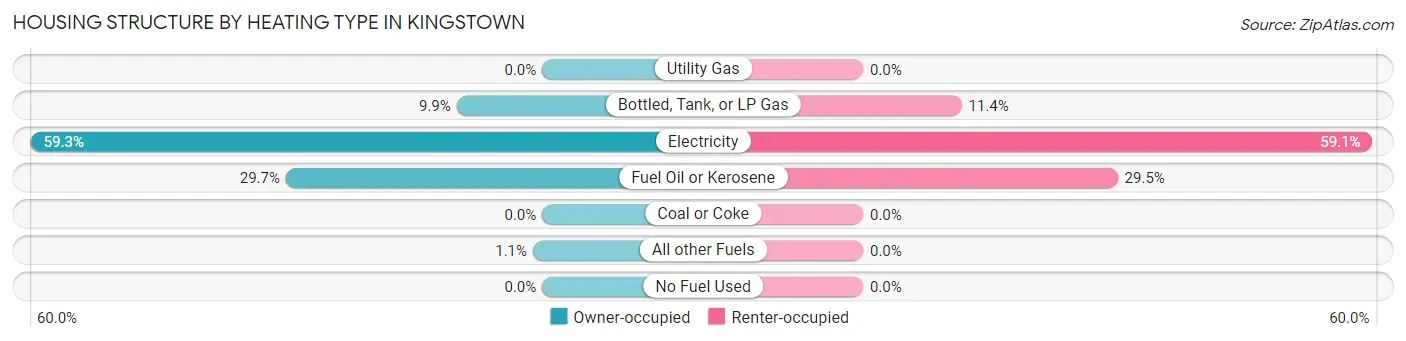
| Heating Type | Owner-occupied | Renter-occupied |
| Utility Gas | 0 (0.0%) | 0 (0.0%) |
| Bottled, Tank, or LP Gas | 74 (9.9%) | 12 (11.4%) |
| Electricity | 443 (59.3%) | 62 (59.1%) |
| Fuel Oil or Kerosene | 222 (29.7%) | 31 (29.5%) |
| Coal or Coke | 0 (0.0%) | 0 (0.0%) |
| All other Fuels | 8 (1.1%) | 0 (0.0%) |
| No Fuel Used | 0 (0.0%) | 0 (0.0%) |
| Total | 747 (100.0%) | 105 (100.0%) |
Household Vehicle Usage in Kingstown
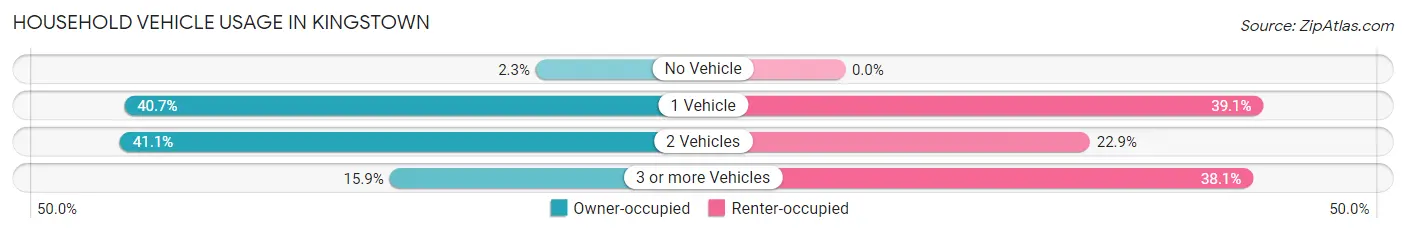
| Vehicles per Household | Owner-occupied | Renter-occupied |
| No Vehicle | 17 (2.3%) | 0 (0.0%) |
| 1 Vehicle | 304 (40.7%) | 41 (39.1%) |
| 2 Vehicles | 307 (41.1%) | 24 (22.9%) |
| 3 or more Vehicles | 119 (15.9%) | 40 (38.1%) |
| Total | 747 (100.0%) | 105 (100.0%) |
Real Estate & Mortgages in Kingstown
Real Estate and Mortgage Overview in Kingstown
| Characteristic | Without Mortgage | With Mortgage |
| Housing Units | 220 | 527 |
| Median Property Value | $288,500 | $242,700 |
| Median Household Income | $95,000 | $90 |
| Monthly Housing Costs | $531 | $48 |
| Real Estate Taxes | $2,446 | $0 |
Property Value by Mortgage Status in Kingstown
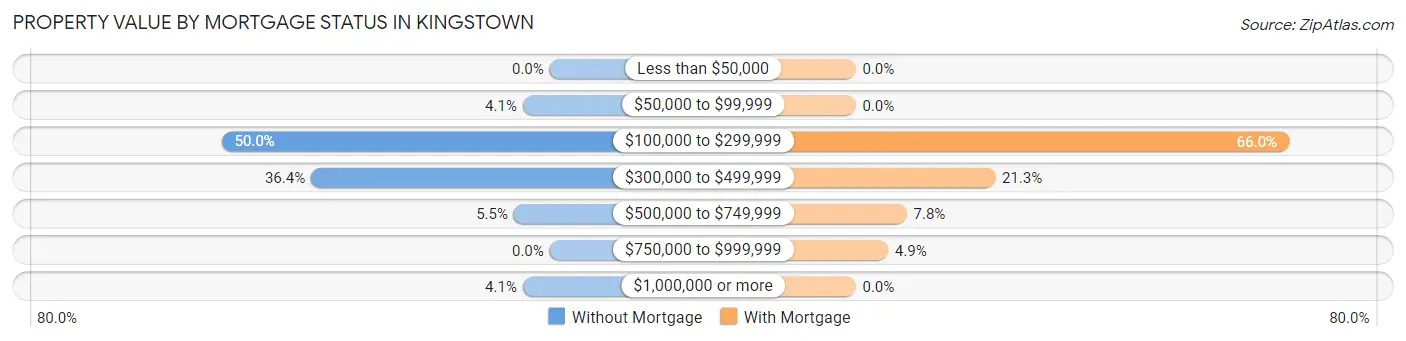
| Property Value | Without Mortgage | With Mortgage |
| Less than $50,000 | 0 (0.0%) | 0 (0.0%) |
| $50,000 to $99,999 | 9 (4.1%) | 0 (0.0%) |
| $100,000 to $299,999 | 110 (50.0%) | 348 (66.0%) |
| $300,000 to $499,999 | 80 (36.4%) | 112 (21.2%) |
| $500,000 to $749,999 | 12 (5.4%) | 41 (7.8%) |
| $750,000 to $999,999 | 0 (0.0%) | 26 (4.9%) |
| $1,000,000 or more | 9 (4.1%) | 0 (0.0%) |
| Total | 220 (100.0%) | 527 (100.0%) |
Household Income by Mortgage Status in Kingstown
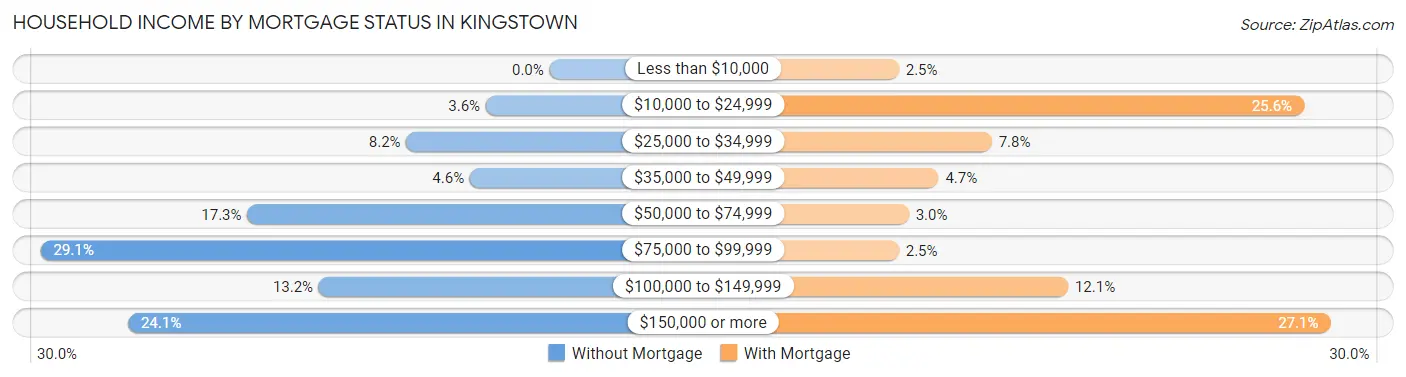
| Household Income | Without Mortgage | With Mortgage |
| Less than $10,000 | 0 (0.0%) | 13 (2.5%) |
| $10,000 to $24,999 | 8 (3.6%) | 135 (25.6%) |
| $25,000 to $34,999 | 18 (8.2%) | 41 (7.8%) |
| $35,000 to $49,999 | 10 (4.5%) | 25 (4.7%) |
| $50,000 to $74,999 | 38 (17.3%) | 16 (3.0%) |
| $75,000 to $99,999 | 64 (29.1%) | 13 (2.5%) |
| $100,000 to $149,999 | 29 (13.2%) | 64 (12.1%) |
| $150,000 or more | 53 (24.1%) | 143 (27.1%) |
| Total | 220 (100.0%) | 527 (100.0%) |
Property Value to Household Income Ratio in Kingstown
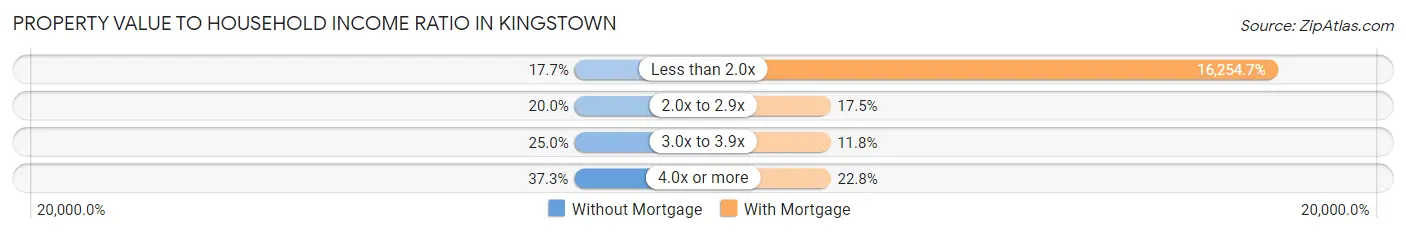
| Value-to-Income Ratio | Without Mortgage | With Mortgage |
| Less than 2.0x | 39 (17.7%) | 85,662 (16,254.7%) |
| 2.0x to 2.9x | 44 (20.0%) | 92 (17.5%) |
| 3.0x to 3.9x | 55 (25.0%) | 62 (11.8%) |
| 4.0x or more | 82 (37.3%) | 120 (22.8%) |
| Total | 220 (100.0%) | 527 (100.0%) |
Real Estate Taxes by Mortgage Status in Kingstown
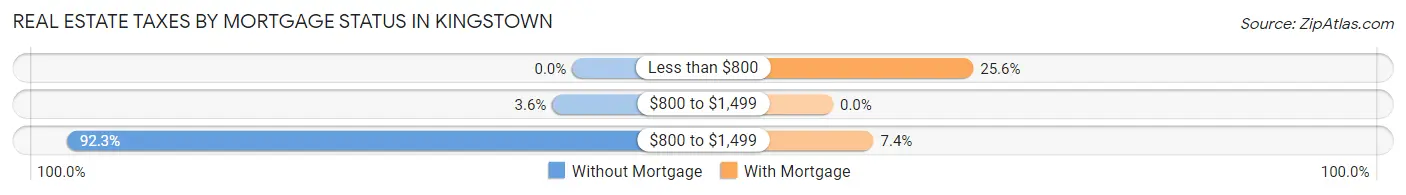
| Property Taxes | Without Mortgage | With Mortgage |
| Less than $800 | 0 (0.0%) | 135 (25.6%) |
| $800 to $1,499 | 8 (3.6%) | 0 (0.0%) |
| $800 to $1,499 | 203 (92.3%) | 39 (7.4%) |
| Total | 220 (100.0%) | 527 (100.0%) |
Health & Disability in Kingstown
Health Insurance Coverage by Age in Kingstown
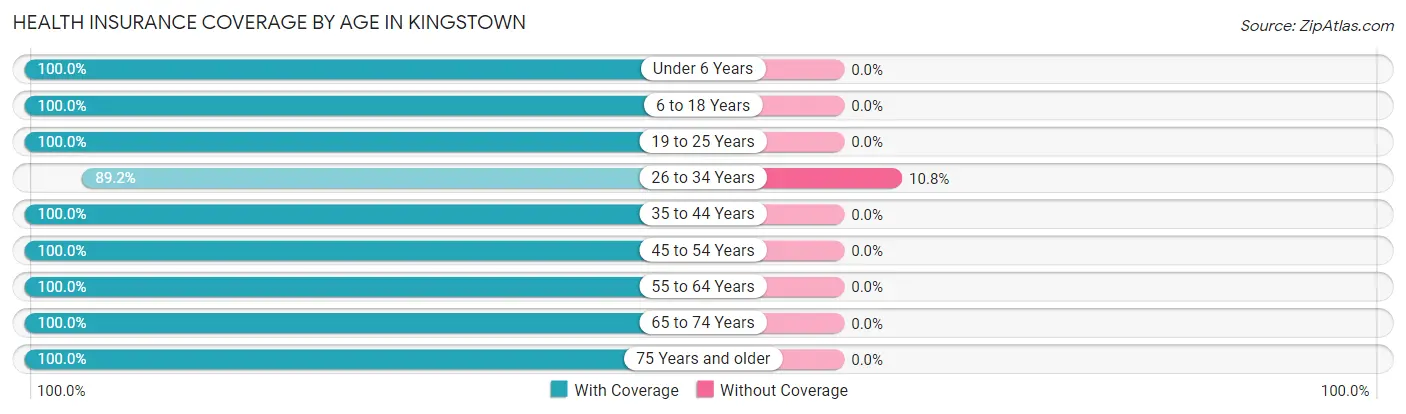
| Age Bracket | With Coverage | Without Coverage |
| Under 6 Years | 93 (100.0%) | 0 (0.0%) |
| 6 to 18 Years | 232 (100.0%) | 0 (0.0%) |
| 19 to 25 Years | 143 (100.0%) | 0 (0.0%) |
| 26 to 34 Years | 124 (89.2%) | 15 (10.8%) |
| 35 to 44 Years | 292 (100.0%) | 0 (0.0%) |
| 45 to 54 Years | 274 (100.0%) | 0 (0.0%) |
| 55 to 64 Years | 316 (100.0%) | 0 (0.0%) |
| 65 to 74 Years | 220 (100.0%) | 0 (0.0%) |
| 75 Years and older | 165 (100.0%) | 0 (0.0%) |
| Total | 1,859 (99.2%) | 15 (0.8%) |
Health Insurance Coverage by Citizenship Status in Kingstown
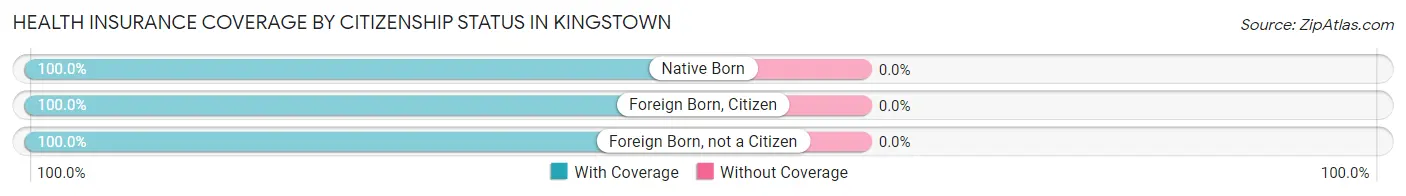
| Citizenship Status | With Coverage | Without Coverage |
| Native Born | 93 (100.0%) | 0 (0.0%) |
| Foreign Born, Citizen | 232 (100.0%) | 0 (0.0%) |
| Foreign Born, not a Citizen | 143 (100.0%) | 0 (0.0%) |
Health Insurance Coverage by Household Income in Kingstown
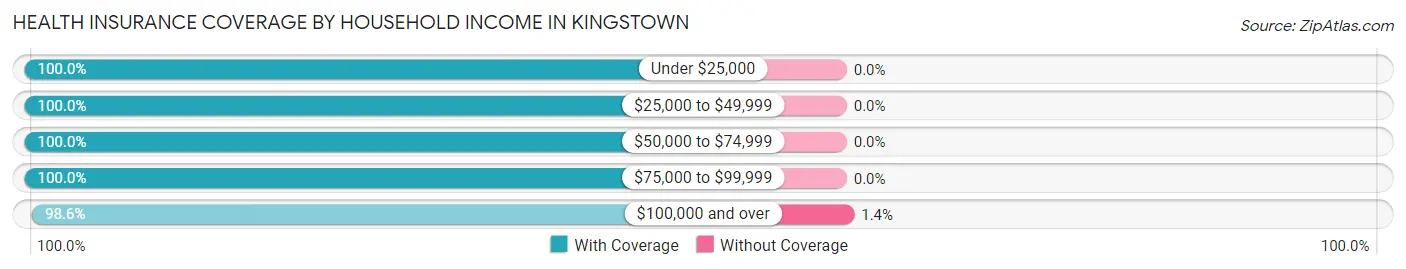
| Household Income | With Coverage | Without Coverage |
| Under $25,000 | 331 (100.0%) | 0 (0.0%) |
| $25,000 to $49,999 | 130 (100.0%) | 0 (0.0%) |
| $50,000 to $74,999 | 73 (100.0%) | 0 (0.0%) |
| $75,000 to $99,999 | 265 (100.0%) | 0 (0.0%) |
| $100,000 and over | 1,055 (98.6%) | 15 (1.4%) |
Public vs Private Health Insurance Coverage by Age in Kingstown
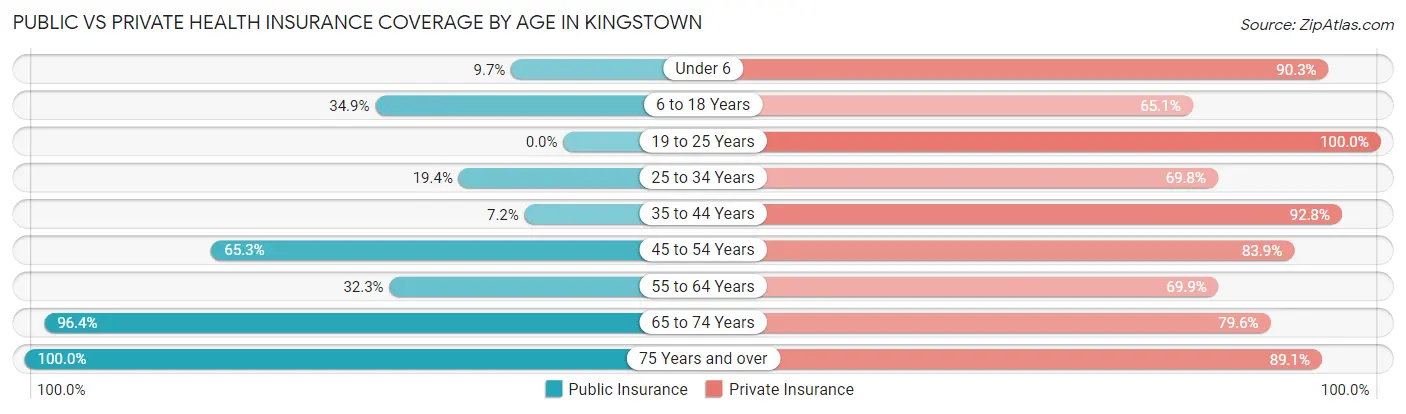
| Age Bracket | Public Insurance | Private Insurance |
| Under 6 | 9 (9.7%) | 84 (90.3%) |
| 6 to 18 Years | 81 (34.9%) | 151 (65.1%) |
| 19 to 25 Years | 0 (0.0%) | 143 (100.0%) |
| 25 to 34 Years | 27 (19.4%) | 97 (69.8%) |
| 35 to 44 Years | 21 (7.2%) | 271 (92.8%) |
| 45 to 54 Years | 179 (65.3%) | 230 (83.9%) |
| 55 to 64 Years | 102 (32.3%) | 221 (69.9%) |
| 65 to 74 Years | 212 (96.4%) | 175 (79.5%) |
| 75 Years and over | 165 (100.0%) | 147 (89.1%) |
| Total | 796 (42.5%) | 1,519 (81.1%) |
Disability Status by Sex by Age in Kingstown
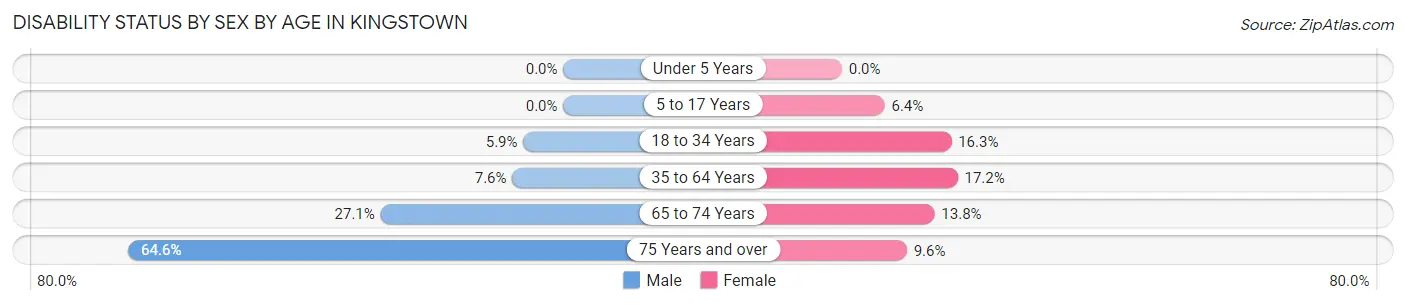
| Age Bracket | Male | Female |
| Under 5 Years | 0 (0.0%) | 0 (0.0%) |
| 5 to 17 Years | 0 (0.0%) | 8 (6.4%) |
| 18 to 34 Years | 12 (5.9%) | 13 (16.3%) |
| 35 to 64 Years | 28 (7.6%) | 88 (17.2%) |
| 65 to 74 Years | 38 (27.1%) | 11 (13.8%) |
| 75 Years and over | 53 (64.6%) | 8 (9.6%) |
Disability Class by Sex by Age in Kingstown
Disability Class: Hearing Difficulty
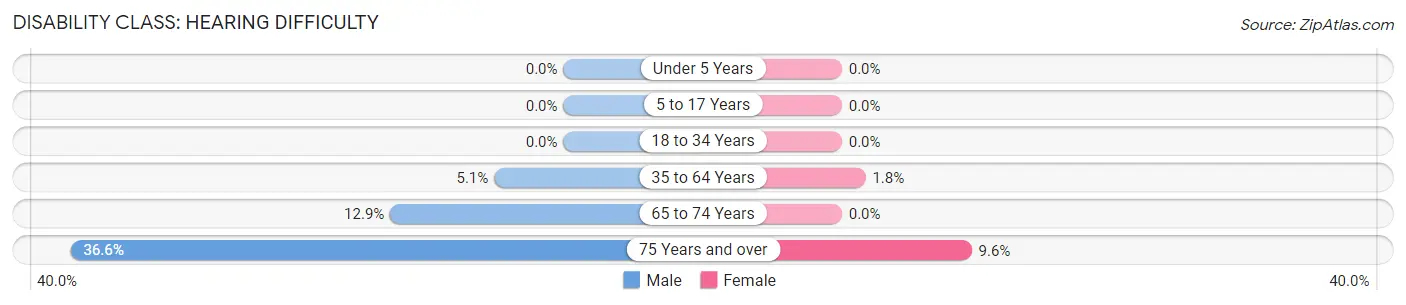
| Age Bracket | Male | Female |
| Under 5 Years | 0 (0.0%) | 0 (0.0%) |
| 5 to 17 Years | 0 (0.0%) | 0 (0.0%) |
| 18 to 34 Years | 0 (0.0%) | 0 (0.0%) |
| 35 to 64 Years | 19 (5.1%) | 9 (1.8%) |
| 65 to 74 Years | 18 (12.9%) | 0 (0.0%) |
| 75 Years and over | 30 (36.6%) | 8 (9.6%) |
Disability Class: Vision Difficulty
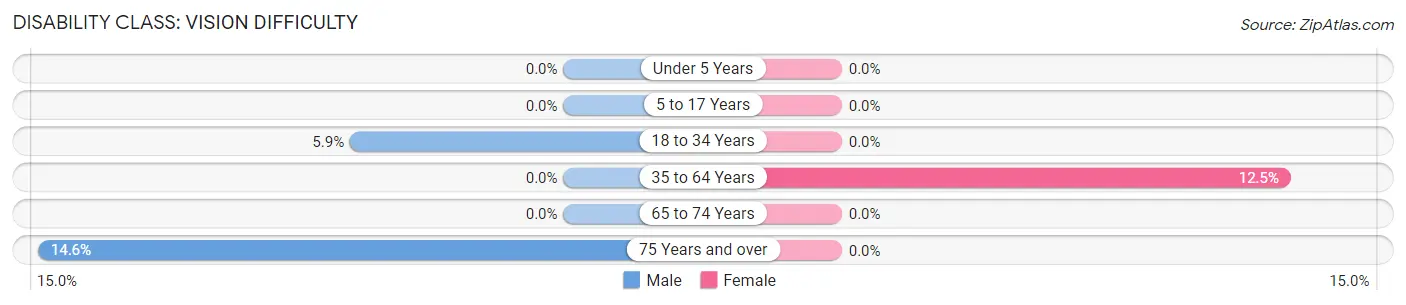
| Age Bracket | Male | Female |
| Under 5 Years | 0 (0.0%) | 0 (0.0%) |
| 5 to 17 Years | 0 (0.0%) | 0 (0.0%) |
| 18 to 34 Years | 12 (5.9%) | 0 (0.0%) |
| 35 to 64 Years | 0 (0.0%) | 64 (12.5%) |
| 65 to 74 Years | 0 (0.0%) | 0 (0.0%) |
| 75 Years and over | 12 (14.6%) | 0 (0.0%) |
Disability Class: Cognitive Difficulty
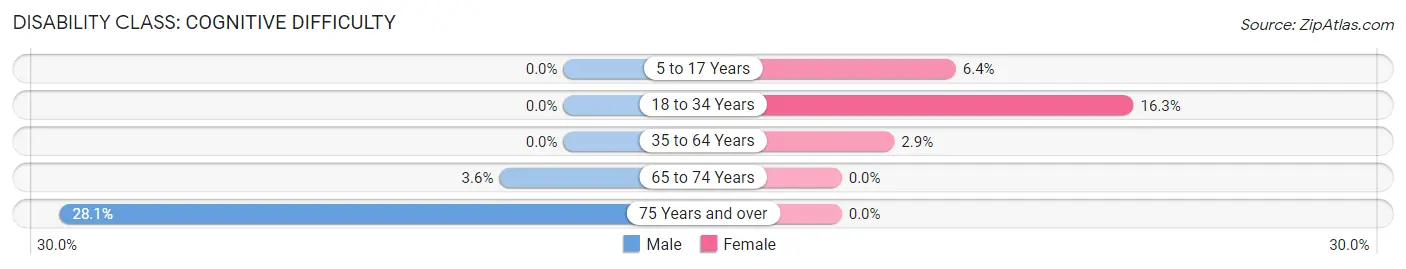
| Age Bracket | Male | Female |
| 5 to 17 Years | 0 (0.0%) | 8 (6.4%) |
| 18 to 34 Years | 0 (0.0%) | 13 (16.3%) |
| 35 to 64 Years | 0 (0.0%) | 15 (2.9%) |
| 65 to 74 Years | 5 (3.6%) | 0 (0.0%) |
| 75 Years and over | 23 (28.1%) | 0 (0.0%) |
Disability Class: Ambulatory Difficulty
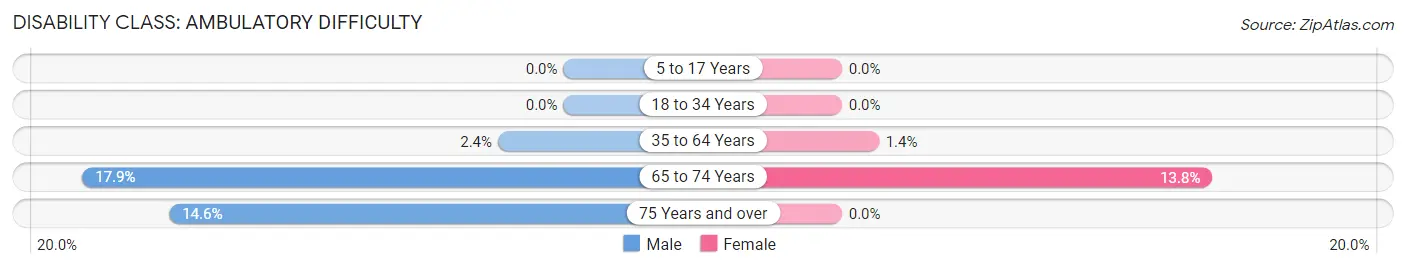
| Age Bracket | Male | Female |
| 5 to 17 Years | 0 (0.0%) | 0 (0.0%) |
| 18 to 34 Years | 0 (0.0%) | 0 (0.0%) |
| 35 to 64 Years | 9 (2.4%) | 7 (1.4%) |
| 65 to 74 Years | 25 (17.9%) | 11 (13.8%) |
| 75 Years and over | 12 (14.6%) | 0 (0.0%) |
Disability Class: Self-Care Difficulty
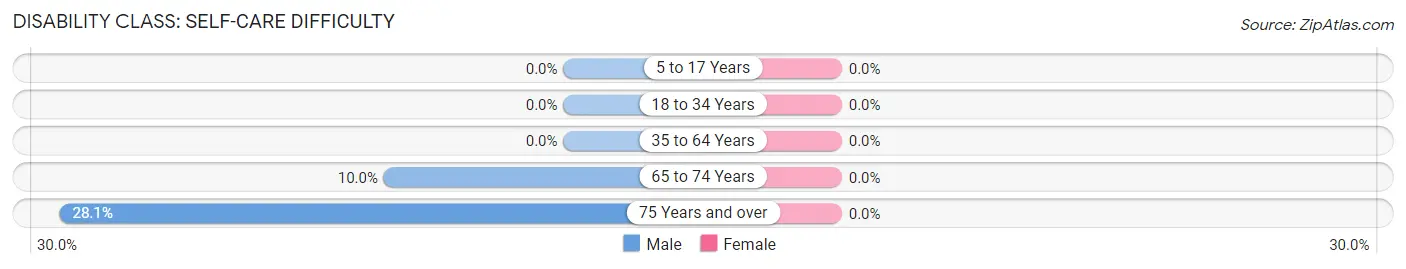
| Age Bracket | Male | Female |
| 5 to 17 Years | 0 (0.0%) | 0 (0.0%) |
| 18 to 34 Years | 0 (0.0%) | 0 (0.0%) |
| 35 to 64 Years | 0 (0.0%) | 0 (0.0%) |
| 65 to 74 Years | 14 (10.0%) | 0 (0.0%) |
| 75 Years and over | 23 (28.1%) | 0 (0.0%) |
Technology Access in Kingstown
Computing Device Access in Kingstown
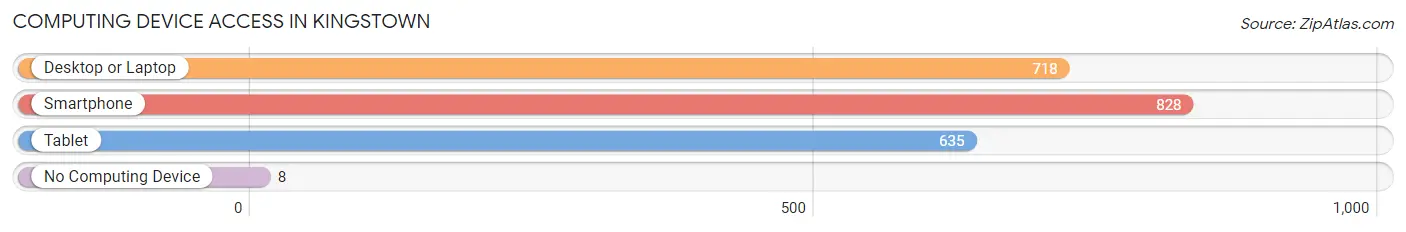
| Device Type | # Households | % Households |
| Desktop or Laptop | 718 | 84.3% |
| Smartphone | 828 | 97.2% |
| Tablet | 635 | 74.5% |
| No Computing Device | 8 | 0.9% |
| Total | 852 | 100.0% |
Internet Access in Kingstown
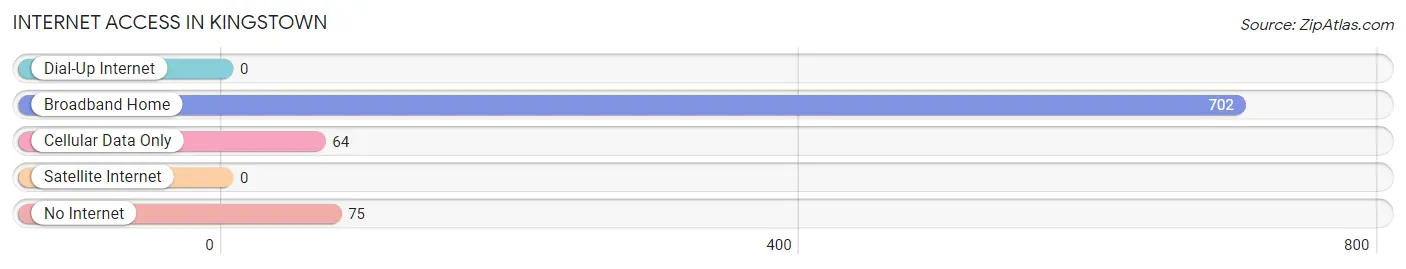
| Internet Type | # Households | % Households |
| Dial-Up Internet | 0 | 0.0% |
| Broadband Home | 702 | 82.4% |
| Cellular Data Only | 64 | 7.5% |
| Satellite Internet | 0 | 0.0% |
| No Internet | 75 | 8.8% |
| Total | 852 | 100.0% |
Kingstown Summary
Kingstown, Maryland is a small town located in the northern part of the state, in Queen Anne’s County. It is situated on the banks of the Chester River, and is home to a population of just over 1,000 people. The town was founded in 1706, and has a rich history that is intertwined with the history of the state of Maryland.
Geography
Kingstown is located in the northern part of Queen Anne’s County, Maryland. It is situated on the banks of the Chester River, and is bordered by the towns of Centreville, Sudlersville, and Queenstown. The town is located approximately 25 miles from the state capital of Annapolis, and is part of the Chesapeake Bay watershed. The town is situated on a peninsula, and is surrounded by water on three sides. The town is located in a rural area, and is surrounded by farmland and woodlands.
Economy
The economy of Kingstown is largely based on agriculture and tourism. The town is home to several farms, which produce a variety of crops, including corn, soybeans, wheat, and hay. The town is also home to several wineries, which produce a variety of wines. Tourism is also an important part of the local economy, as the town is home to several historic sites, including the Kingstown Manor House, the Kingstown Historic District, and the Kingstown Cemetery.
Demographics
As of the 2010 census, the population of Kingstown was 1,072. The racial makeup of the town was 94.3% White, 2.2% African American, 0.3% Native American, 0.7% Asian, 0.1% Pacific Islander, 0.7% from other races, and 1.7% from two or more races. Hispanic or Latino of any race were 2.2% of the population. The median age of the town was 43.7 years, and the median household income was $50,938.
History
Kingstown was founded in 1706 by William King, a Quaker settler from England. The town was originally known as King’s Town, and was the first settlement in Queen Anne’s County. The town was named after King, and was the first town in the county to be incorporated. The town was an important port during the colonial era, and was a major trading center for the region. During the Revolutionary War, the town was the site of several skirmishes between the British and American forces.
In the 19th century, Kingstown became an important center for shipbuilding and oyster harvesting. The town was also home to several mills, which produced a variety of goods, including flour, lumber, and paper. The town was also home to several canneries, which canned a variety of fruits and vegetables.
In the 20th century, Kingstown continued to be an important center for agriculture and industry. The town was home to several factories, which produced a variety of goods, including furniture, clothing, and paper products. The town was also home to several shipyards, which built a variety of vessels, including fishing boats and pleasure craft.
Today, Kingstown is a small town with a rich history. The town is home to several historic sites, including the Kingstown Manor House, the Kingstown Historic District, and the Kingstown Cemetery. The town is also home to several wineries, which produce a variety of wines. The town is also home to several farms, which produce a variety of crops, including corn, soybeans, wheat, and hay. Tourism is also an important part of the local economy, as the town is home to several historic sites, including the Kingstown Manor House, the Kingstown Historic District, and the Kingstown Cemetery.
Common Questions
What is the Total Population of Kingstown?
Total Population of Kingstown is 1,874.
What is the Total Male Population of Kingstown?
Total Male Population of Kingstown is 930.
What is the Total Female Population of Kingstown?
Total Female Population of Kingstown is 944.
What is the Ratio of Males per 100 Females in Kingstown?
There are 98.52 Males per 100 Females in Kingstown.
What is the Ratio of Females per 100 Males in Kingstown?
There are 101.51 Females per 100 Males in Kingstown.
What is the Median Population Age in Kingstown?
Median Population Age in Kingstown is 49.3 Years.
What is the Average Family Size in Kingstown
Average Family Size in Kingstown is 2.9 People.
What is the Average Household Size in Kingstown
Average Household Size in Kingstown is 2.2 People.
What is Per Capita Income in Kingstown?
Per Capita income in Kingstown is $44,970.
What is the Median Family Income in Kingstown?
Median Family Income in Kingstown is $126,319.
What is the Median Household income in Kingstown?
Median Household Income in Kingstown is $88,214.
What is Income or Wage Gap in Kingstown?
Income or Wage Gap in Kingstown is 15.7%.
Women in Kingstown earn 84.3 cents for every dollar earned by a man.
What is Inequality or Gini Index in Kingstown?
Inequality or Gini Index in Kingstown is 0.49.
How Large is the Labor Force in Kingstown?
There are 839 People in the Labor Forcein in Kingstown.
What is the Percentage of People in the Labor Force in Kingstown?
51.6% of People are in the Labor Force in Kingstown.
What is the Unemployment Rate in Kingstown?
Unemployment Rate in Kingstown is 1.3%.