Cities with the Highest Percentage of Population Employed in Business & Financial in Kentucky
RELATED REPORTS & OPTIONS
Business & Financial
Kentucky
Compare Cities
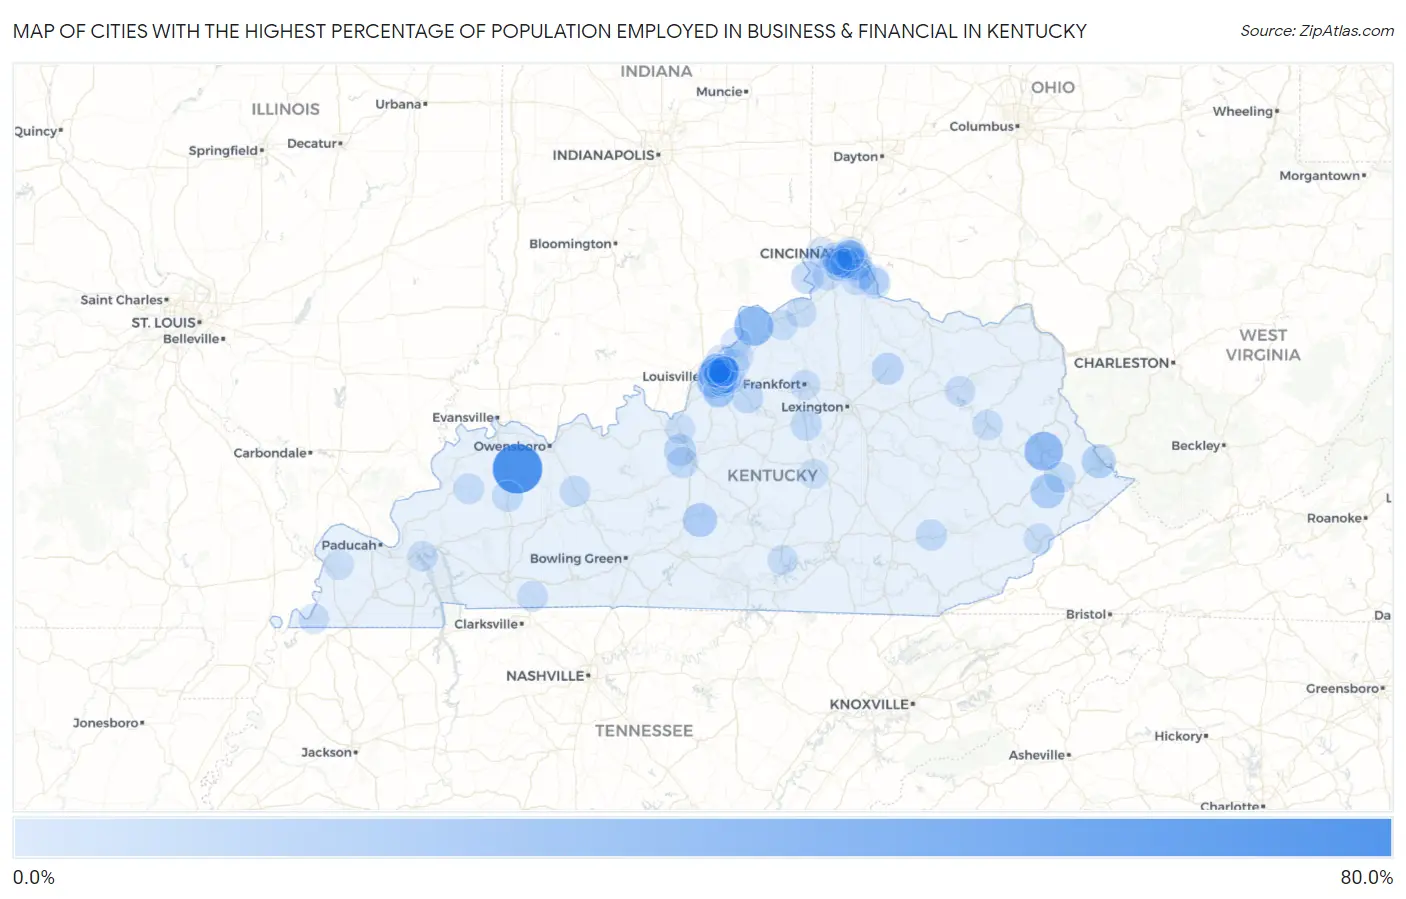
Map of Cities with the Highest Percentage of Population Employed in Business & Financial in Kentucky
0.0%
80.0%
Cities with the Highest Percentage of Population Employed in Business & Financial in Kentucky
| City | % Employed | vs State | vs National | |
| 1. | Beech Grove | 75.0% | 4.6%(+70.4)#1 | 5.8%(+69.2)#24 |
| 2. | Bedford | 38.0% | 4.6%(+33.4)#2 | 5.8%(+32.2)#97 |
| 3. | Auxier | 36.2% | 4.6%(+31.6)#3 | 5.8%(+30.4)#111 |
| 4. | Maryhill Estates | 22.6% | 4.6%(+18.0)#4 | 5.8%(+16.8)#304 |
| 5. | Mcdowell | 21.5% | 4.6%(+16.9)#5 | 5.8%(+15.8)#333 |
| 6. | Hardyville | 20.3% | 4.6%(+15.6)#6 | 5.8%(+14.5)#377 |
| 7. | Riverwood | 19.5% | 4.6%(+14.8)#7 | 5.8%(+13.7)#415 |
| 8. | South Williamson | 19.4% | 4.6%(+14.8)#8 | 5.8%(+13.6)#419 |
| 9. | Glenview Hills | 17.6% | 4.6%(+13.0)#9 | 5.8%(+11.8)#518 |
| 10. | Brownsboro Village | 16.7% | 4.6%(+12.0)#10 | 5.8%(+10.9)#586 |
| 11. | Wilder | 16.6% | 4.6%(+11.9)#11 | 5.8%(+10.8)#606 |
| 12. | Bellewood | 16.3% | 4.6%(+11.6)#12 | 5.8%(+10.5)#637 |
| 13. | Ten Broeck | 16.1% | 4.6%(+11.5)#13 | 5.8%(+10.4)#651 |
| 14. | Philpot | 16.1% | 4.6%(+11.5)#14 | 5.8%(+10.4)#653 |
| 15. | Briarwood | 15.3% | 4.6%(+10.7)#15 | 5.8%(+9.55)#765 |
| 16. | Rabbit Hash | 15.3% | 4.6%(+10.7)#16 | 5.8%(+9.53)#770 |
| 17. | Bellemeade | 15.1% | 4.6%(+10.4)#17 | 5.8%(+9.29)#794 |
| 18. | Villa Hills | 14.6% | 4.6%(+9.96)#18 | 5.8%(+8.82)#863 |
| 19. | Old Brownsboro Place | 14.5% | 4.6%(+9.83)#19 | 5.8%(+8.69)#880 |
| 20. | Wellington | 14.0% | 4.6%(+9.33)#20 | 5.8%(+8.19)#959 |
| 21. | Cold Spring | 13.8% | 4.6%(+9.21)#21 | 5.8%(+8.07)#984 |
| 22. | Goose Creek | 13.6% | 4.6%(+8.94)#22 | 5.8%(+7.80)#1,039 |
| 23. | Millersburg | 13.3% | 4.6%(+8.68)#23 | 5.8%(+7.53)#1,114 |
| 24. | Rineyville | 13.3% | 4.6%(+8.67)#24 | 5.8%(+7.53)#1,116 |
| 25. | Fort Wright | 13.0% | 4.6%(+8.39)#25 | 5.8%(+7.25)#1,195 |
| 26. | Westwood | 12.8% | 4.6%(+8.22)#26 | 5.8%(+7.08)#1,241 |
| 27. | Elk Creek | 12.5% | 4.6%(+7.85)#27 | 5.8%(+6.70)#1,344 |
| 28. | Blue Ridge Manor | 12.0% | 4.6%(+7.43)#28 | 5.8%(+6.29)#1,477 |
| 29. | Barbourmeade | 12.0% | 4.6%(+7.39)#29 | 5.8%(+6.24)#1,490 |
| 30. | Norbourne Estates | 11.8% | 4.6%(+7.23)#30 | 5.8%(+6.09)#1,542 |
| 31. | Druid Hills | 11.6% | 4.6%(+6.94)#31 | 5.8%(+5.80)#1,660 |
| 32. | Broeck Pointe | 11.5% | 4.6%(+6.83)#32 | 5.8%(+5.69)#1,704 |
| 33. | West Van Lear | 11.4% | 4.6%(+6.81)#33 | 5.8%(+5.67)#1,716 |
| 34. | Salvisa | 11.3% | 4.6%(+6.70)#34 | 5.8%(+5.56)#1,762 |
| 35. | Crestview | 11.2% | 4.6%(+6.62)#35 | 5.8%(+5.48)#1,789 |
| 36. | Cecilia | 11.2% | 4.6%(+6.56)#36 | 5.8%(+5.42)#1,816 |
| 37. | Rolling Fields | 11.1% | 4.6%(+6.49)#37 | 5.8%(+5.35)#1,841 |
| 38. | Manchester | 11.1% | 4.6%(+6.48)#38 | 5.8%(+5.33)#1,863 |
| 39. | Spring Mill | 11.0% | 4.6%(+6.37)#39 | 5.8%(+5.23)#1,913 |
| 40. | Houston Acres | 10.8% | 4.6%(+6.13)#40 | 5.8%(+4.99)#2,022 |
| 41. | Hanson | 10.7% | 4.6%(+6.12)#41 | 5.8%(+4.98)#2,025 |
| 42. | Wildwood | 10.5% | 4.6%(+5.90)#42 | 5.8%(+4.76)#2,149 |
| 43. | Strathmoor Village | 10.4% | 4.6%(+5.75)#43 | 5.8%(+4.61)#2,218 |
| 44. | Hartford | 10.3% | 4.6%(+5.69)#44 | 5.8%(+4.55)#2,249 |
| 45. | Hollow Creek | 10.3% | 4.6%(+5.68)#45 | 5.8%(+4.54)#2,254 |
| 46. | Bellevue | 10.2% | 4.6%(+5.62)#46 | 5.8%(+4.48)#2,295 |
| 47. | St Regis Park | 10.2% | 4.6%(+5.60)#47 | 5.8%(+4.46)#2,305 |
| 48. | Beechwood Village | 10.0% | 4.6%(+5.36)#48 | 5.8%(+4.22)#2,451 |
| 49. | Mentor | 9.9% | 4.6%(+5.30)#49 | 5.8%(+4.15)#2,496 |
| 50. | Betsy Layne | 9.9% | 4.6%(+5.23)#50 | 5.8%(+4.09)#2,535 |
| 51. | Crestwood | 9.8% | 4.6%(+5.13)#51 | 5.8%(+3.99)#2,599 |
| 52. | River Bluff | 9.5% | 4.6%(+4.83)#52 | 5.8%(+3.69)#2,786 |
| 53. | Trenton | 9.4% | 4.6%(+4.81)#53 | 5.8%(+3.67)#2,810 |
| 54. | Union | 9.4% | 4.6%(+4.81)#54 | 5.8%(+3.67)#2,813 |
| 55. | West Liberty | 9.4% | 4.6%(+4.80)#55 | 5.8%(+3.66)#2,820 |
| 56. | Erlanger | 9.4% | 4.6%(+4.77)#56 | 5.8%(+3.63)#2,843 |
| 57. | Clay | 9.4% | 4.6%(+4.77)#57 | 5.8%(+3.63)#2,848 |
| 58. | Fort Thomas | 9.4% | 4.6%(+4.75)#58 | 5.8%(+3.61)#2,876 |
| 59. | Alexandria | 9.3% | 4.6%(+4.66)#59 | 5.8%(+3.51)#2,948 |
| 60. | Whitesburg | 9.2% | 4.6%(+4.60)#60 | 5.8%(+3.45)#2,998 |
| 61. | Middletown | 9.1% | 4.6%(+4.49)#61 | 5.8%(+3.35)#3,076 |
| 62. | Richlawn | 9.1% | 4.6%(+4.47)#62 | 5.8%(+3.33)#3,094 |
| 63. | Plantation | 8.9% | 4.6%(+4.29)#63 | 5.8%(+3.15)#3,254 |
| 64. | Sparta | 8.8% | 4.6%(+4.15)#64 | 5.8%(+3.01)#3,384 |
| 65. | Sycamore | 8.7% | 4.6%(+4.13)#65 | 5.8%(+2.99)#3,410 |
| 66. | Hurstbourne Acres | 8.7% | 4.6%(+4.07)#66 | 5.8%(+2.93)#3,471 |
| 67. | Grand Rivers | 8.6% | 4.6%(+4.00)#67 | 5.8%(+2.86)#3,530 |
| 68. | Edgewood | 8.3% | 4.6%(+3.70)#68 | 5.8%(+2.56)#3,828 |
| 69. | Manor Creek | 8.3% | 4.6%(+3.66)#69 | 5.8%(+2.52)#3,856 |
| 70. | Meadow Vale | 8.2% | 4.6%(+3.62)#70 | 5.8%(+2.48)#3,885 |
| 71. | Worthville | 8.2% | 4.6%(+3.60)#71 | 5.8%(+2.46)#3,915 |
| 72. | Northfield | 8.2% | 4.6%(+3.60)#72 | 5.8%(+2.45)#3,920 |
| 73. | Frankfort | 8.2% | 4.6%(+3.58)#73 | 5.8%(+2.44)#3,939 |
| 74. | Westport | 8.1% | 4.6%(+3.53)#74 | 5.8%(+2.39)#3,996 |
| 75. | Francisville | 8.1% | 4.6%(+3.50)#75 | 5.8%(+2.35)#4,030 |
| 76. | Lakeview Heights | 8.1% | 4.6%(+3.47)#76 | 5.8%(+2.33)#4,073 |
| 77. | Hickman | 7.9% | 4.6%(+3.32)#77 | 5.8%(+2.18)#4,241 |
| 78. | Crossgate | 7.9% | 4.6%(+3.30)#78 | 5.8%(+2.16)#4,279 |
| 79. | Claryville | 7.9% | 4.6%(+3.28)#79 | 5.8%(+2.14)#4,300 |
| 80. | California | 7.9% | 4.6%(+3.27)#80 | 5.8%(+2.13)#4,319 |
| 81. | Lyndon | 7.8% | 4.6%(+3.17)#81 | 5.8%(+2.03)#4,433 |
| 82. | Jamestown | 7.6% | 4.6%(+3.02)#82 | 5.8%(+1.87)#4,639 |
| 83. | Creekside | 7.5% | 4.6%(+2.89)#83 | 5.8%(+1.75)#4,779 |
| 84. | Lakeside Park | 7.5% | 4.6%(+2.86)#84 | 5.8%(+1.72)#4,811 |
| 85. | Fort Knox | 7.4% | 4.6%(+2.78)#85 | 5.8%(+1.64)#4,907 |
| 86. | Hurstbourne | 7.4% | 4.6%(+2.75)#86 | 5.8%(+1.61)#4,934 |
| 87. | Woodlawn | 7.3% | 4.6%(+2.72)#87 | 5.8%(+1.58)#4,967 |
| 88. | Woodlawn Park | 7.3% | 4.6%(+2.71)#88 | 5.8%(+1.57)#4,970 |
| 89. | Crescent Springs | 7.3% | 4.6%(+2.68)#89 | 5.8%(+1.54)#5,030 |
| 90. | Newport | 7.3% | 4.6%(+2.67)#90 | 5.8%(+1.53)#5,039 |
| 91. | Junction City | 7.3% | 4.6%(+2.65)#91 | 5.8%(+1.51)#5,074 |
| 92. | Brownsboro Farm | 7.3% | 4.6%(+2.65)#92 | 5.8%(+1.50)#5,080 |
| 93. | Graymoor Devondale | 7.2% | 4.6%(+2.55)#93 | 5.8%(+1.41)#5,207 |
| 94. | Murray Hill | 7.1% | 4.6%(+2.52)#94 | 5.8%(+1.38)#5,247 |
| 95. | Blandville | 7.1% | 4.6%(+2.52)#95 | 5.8%(+1.38)#5,258 |
| 96. | Covington | 7.0% | 4.6%(+2.41)#96 | 5.8%(+1.27)#5,384 |
| 97. | Indian Hills | 7.0% | 4.6%(+2.36)#97 | 5.8%(+1.22)#5,470 |
| 98. | Langdon Place | 7.0% | 4.6%(+2.36)#98 | 5.8%(+1.22)#5,475 |
| 99. | Buckner | 7.0% | 4.6%(+2.35)#99 | 5.8%(+1.21)#5,496 |
| 100. | Glenview | 7.0% | 4.6%(+2.35)#100 | 5.8%(+1.21)#5,497 |
Common Questions
What are the Top 10 Cities with the Highest Percentage of Population Employed in Business & Financial in Kentucky?
Top 10 Cities with the Highest Percentage of Population Employed in Business & Financial in Kentucky are:
#1
75.0%
#2
38.0%
#3
36.2%
#4
22.6%
#5
21.5%
#6
20.3%
#7
19.5%
#8
19.4%
#9
17.6%
#10
16.7%
What city has the Highest Percentage of Population Employed in Business & Financial in Kentucky?
Beech Grove has the Highest Percentage of Population Employed in Business & Financial in Kentucky with 75.0%.
What is the Percentage of Population Employed in Business & Financial in the State of Kentucky?
Percentage of Population Employed in Business & Financial in Kentucky is 4.6%.
What is the Percentage of Population Employed in Business & Financial in the United States?
Percentage of Population Employed in Business & Financial in the United States is 5.8%.