Cities with the Highest Percentage of Population Employed in Business & Financial in Pennsylvania
RELATED REPORTS & OPTIONS
Business & Financial
Pennsylvania
Compare Cities
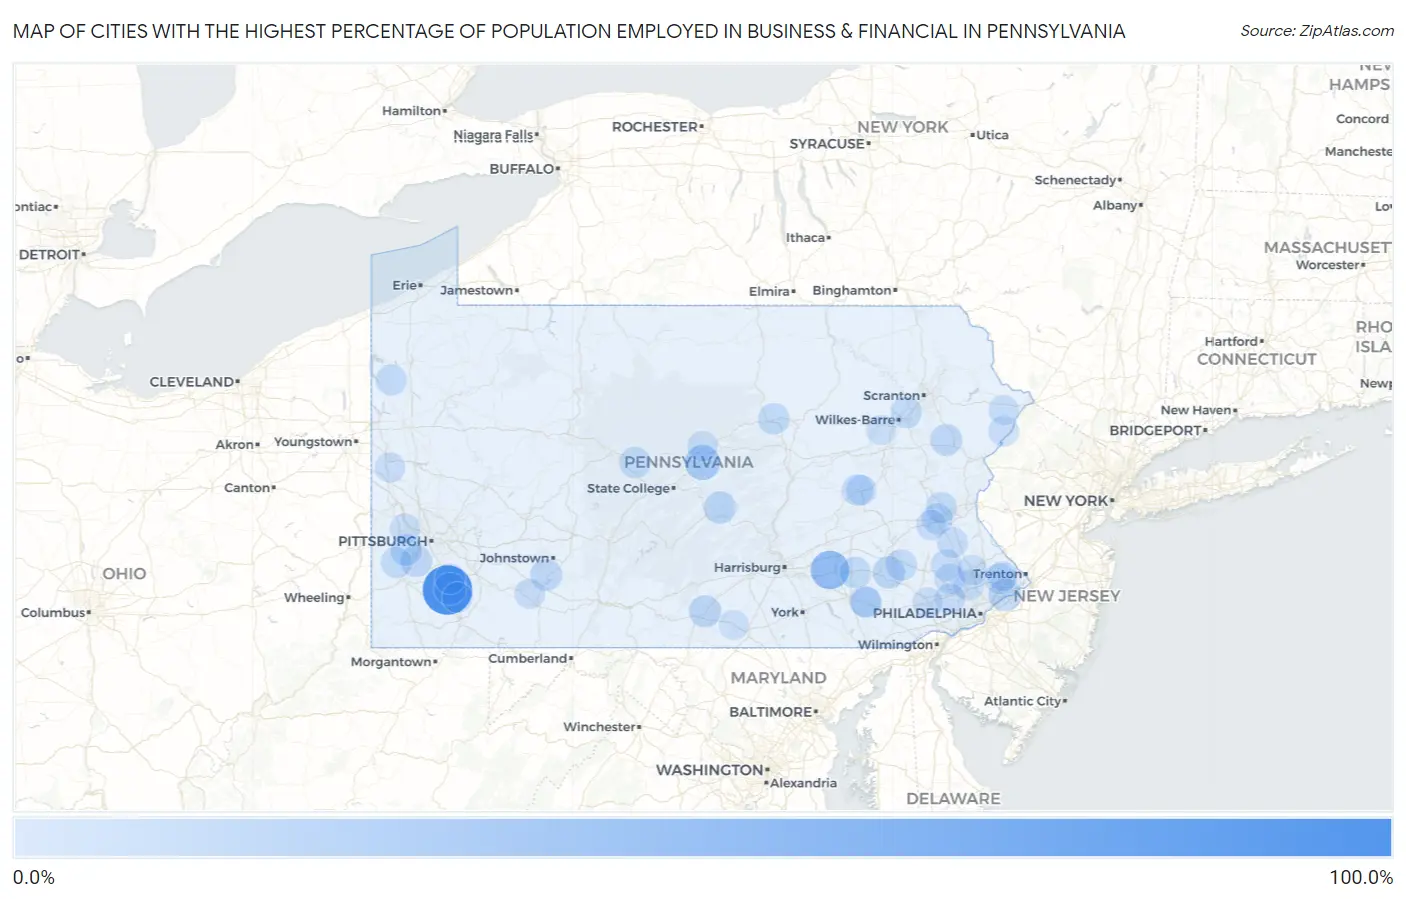
Map of Cities with the Highest Percentage of Population Employed in Business & Financial in Pennsylvania
0.0%
100.0%
Cities with the Highest Percentage of Population Employed in Business & Financial in Pennsylvania
| City | % Employed | vs State | vs National | |
| 1. | Naomi | 100.0% | 5.9%(+94.1)#1 | 5.8%(+94.2)#7 |
| 2. | Timber Hills | 49.5% | 5.9%(+43.6)#2 | 5.8%(+43.7)#61 |
| 3. | Eagles Mere Borough | 36.4% | 5.9%(+30.5)#3 | 5.8%(+30.6)#110 |
| 4. | Sunbrook | 35.1% | 5.9%(+29.2)#4 | 5.8%(+29.3)#117 |
| 5. | New Hope Borough | 33.9% | 5.9%(+28.0)#5 | 5.8%(+28.1)#130 |
| 6. | Hublersburg | 33.8% | 5.9%(+27.9)#6 | 5.8%(+28.1)#131 |
| 7. | Seven Springs Borough | 31.2% | 5.9%(+25.4)#7 | 5.8%(+25.5)#160 |
| 8. | Gray | 30.0% | 5.9%(+24.1)#8 | 5.8%(+24.2)#167 |
| 9. | Fort Fetter | 27.5% | 5.9%(+21.6)#9 | 5.8%(+21.7)#196 |
| 10. | Le Raysville Borough | 27.3% | 5.9%(+21.4)#10 | 5.8%(+21.6)#201 |
| 11. | Friesville | 27.3% | 5.9%(+21.4)#11 | 5.8%(+21.5)#203 |
| 12. | Mount Gretna Borough | 23.9% | 5.9%(+18.0)#12 | 5.8%(+18.2)#266 |
| 13. | Cornwells Heights | 23.3% | 5.9%(+17.4)#13 | 5.8%(+17.5)#283 |
| 14. | Haysville Borough | 22.4% | 5.9%(+16.6)#14 | 5.8%(+16.7)#308 |
| 15. | Maxatawny | 21.9% | 5.9%(+16.0)#15 | 5.8%(+16.1)#325 |
| 16. | Alfarata | 21.7% | 5.9%(+15.8)#16 | 5.8%(+15.9)#331 |
| 17. | Alleghenyville | 21.2% | 5.9%(+15.3)#17 | 5.8%(+15.4)#347 |
| 18. | Glen Osborne Borough | 21.1% | 5.9%(+15.2)#18 | 5.8%(+15.4)#349 |
| 19. | Yarnell | 20.6% | 5.9%(+14.7)#19 | 5.8%(+14.9)#365 |
| 20. | Scotland | 20.4% | 5.9%(+14.5)#20 | 5.8%(+14.7)#371 |
| 21. | Arnold City | 20.0% | 5.9%(+14.1)#21 | 5.8%(+14.2)#386 |
| 22. | Pocono Pines | 19.6% | 5.9%(+13.7)#22 | 5.8%(+13.9)#407 |
| 23. | Lawrence | 19.5% | 5.9%(+13.6)#23 | 5.8%(+13.7)#412 |
| 24. | Fredericksburg Cdp Crawford County | 19.2% | 5.9%(+13.3)#24 | 5.8%(+13.4)#436 |
| 25. | Jerome | 19.0% | 5.9%(+13.1)#25 | 5.8%(+13.2)#446 |
| 26. | Sturgeon | 18.8% | 5.9%(+13.0)#26 | 5.8%(+13.1)#452 |
| 27. | Benson Borough | 18.8% | 5.9%(+12.9)#27 | 5.8%(+13.0)#456 |
| 28. | Faxon | 18.1% | 5.9%(+12.2)#28 | 5.8%(+12.3)#491 |
| 29. | Leetsdale Borough | 17.9% | 5.9%(+12.0)#29 | 5.8%(+12.2)#498 |
| 30. | Hopeland | 17.8% | 5.9%(+11.9)#30 | 5.8%(+12.0)#504 |
| 31. | Allport | 17.7% | 5.9%(+11.8)#31 | 5.8%(+12.0)#508 |
| 32. | Dilworthtown | 17.4% | 5.9%(+11.5)#32 | 5.8%(+11.7)#528 |
| 33. | Englewood | 17.3% | 5.9%(+11.4)#33 | 5.8%(+11.5)#540 |
| 34. | Churchville | 17.1% | 5.9%(+11.2)#34 | 5.8%(+11.4)#551 |
| 35. | Bird In Hand | 17.1% | 5.9%(+11.2)#35 | 5.8%(+11.3)#553 |
| 36. | Inkerman | 17.1% | 5.9%(+11.2)#36 | 5.8%(+11.3)#555 |
| 37. | Gibraltar | 17.0% | 5.9%(+11.1)#37 | 5.8%(+11.3)#560 |
| 38. | Hickory | 17.0% | 5.9%(+11.1)#38 | 5.8%(+11.2)#564 |
| 39. | Atlantic | 16.7% | 5.9%(+10.8)#39 | 5.8%(+10.9)#593 |
| 40. | Stiles | 16.6% | 5.9%(+10.7)#40 | 5.8%(+10.8)#604 |
| 41. | Ore Hill | 16.4% | 5.9%(+10.5)#41 | 5.8%(+10.6)#616 |
| 42. | Cetronia | 16.3% | 5.9%(+10.4)#42 | 5.8%(+10.6)#629 |
| 43. | Merion Station | 16.3% | 5.9%(+10.4)#43 | 5.8%(+10.5)#638 |
| 44. | Hookstown Borough | 15.7% | 5.9%(+9.79)#44 | 5.8%(+9.92)#692 |
| 45. | Shiremanstown Borough | 15.6% | 5.9%(+9.73)#45 | 5.8%(+9.86)#705 |
| 46. | Potters Mills | 15.4% | 5.9%(+9.49)#46 | 5.8%(+9.62)#751 |
| 47. | Blue Bell | 15.3% | 5.9%(+9.44)#47 | 5.8%(+9.57)#761 |
| 48. | Middleport Borough | 15.3% | 5.9%(+9.36)#48 | 5.8%(+9.49)#775 |
| 49. | Spring Mount | 15.2% | 5.9%(+9.32)#49 | 5.8%(+9.45)#781 |
| 50. | Millerstown Borough | 15.2% | 5.9%(+9.27)#50 | 5.8%(+9.40)#783 |
| 51. | Ronks | 15.0% | 5.9%(+9.06)#51 | 5.8%(+9.19)#809 |
| 52. | Dauphin Borough | 14.9% | 5.9%(+8.98)#52 | 5.8%(+9.11)#820 |
| 53. | Kimberton | 14.7% | 5.9%(+8.78)#53 | 5.8%(+8.91)#847 |
| 54. | West Conshohocken Borough | 14.6% | 5.9%(+8.69)#54 | 5.8%(+8.83)#860 |
| 55. | Eagle | 14.5% | 5.9%(+8.65)#55 | 5.8%(+8.78)#867 |
| 56. | New Boston | 14.5% | 5.9%(+8.62)#56 | 5.8%(+8.75)#871 |
| 57. | Burlington Borough | 14.5% | 5.9%(+8.60)#57 | 5.8%(+8.73)#875 |
| 58. | Milford Square | 14.5% | 5.9%(+8.58)#58 | 5.8%(+8.72)#877 |
| 59. | Alba Borough | 14.5% | 5.9%(+8.58)#59 | 5.8%(+8.71)#878 |
| 60. | Pocono Ranch Lands | 14.0% | 5.9%(+8.09)#60 | 5.8%(+8.22)#955 |
| 61. | Skelp | 13.9% | 5.9%(+8.03)#61 | 5.8%(+8.16)#967 |
| 62. | Evansburg | 13.9% | 5.9%(+8.02)#62 | 5.8%(+8.15)#971 |
| 63. | Fellsburg | 13.9% | 5.9%(+8.00)#63 | 5.8%(+8.13)#973 |
| 64. | Devon | 13.9% | 5.9%(+7.98)#64 | 5.8%(+8.11)#979 |
| 65. | Cassandra Borough | 13.8% | 5.9%(+7.90)#65 | 5.8%(+8.03)#991 |
| 66. | Frazer | 13.7% | 5.9%(+7.81)#66 | 5.8%(+7.94)#1,002 |
| 67. | Star Junction | 13.7% | 5.9%(+7.80)#67 | 5.8%(+7.93)#1,007 |
| 68. | Bell Acres Borough | 13.7% | 5.9%(+7.78)#68 | 5.8%(+7.91)#1,014 |
| 69. | Green Lane Borough | 13.6% | 5.9%(+7.74)#69 | 5.8%(+7.87)#1,020 |
| 70. | Edie | 13.5% | 5.9%(+7.62)#70 | 5.8%(+7.75)#1,056 |
| 71. | Trexlertown | 13.5% | 5.9%(+7.61)#71 | 5.8%(+7.74)#1,058 |
| 72. | Montgomeryville | 13.5% | 5.9%(+7.61)#72 | 5.8%(+7.74)#1,061 |
| 73. | Marion Center Borough | 13.4% | 5.9%(+7.51)#73 | 5.8%(+7.64)#1,089 |
| 74. | Carnot Moon | 13.4% | 5.9%(+7.51)#74 | 5.8%(+7.64)#1,091 |
| 75. | Export Borough | 13.3% | 5.9%(+7.44)#75 | 5.8%(+7.57)#1,102 |
| 76. | Delmont Borough | 13.3% | 5.9%(+7.44)#76 | 5.8%(+7.57)#1,109 |
| 77. | Mars Borough | 13.3% | 5.9%(+7.41)#77 | 5.8%(+7.54)#1,113 |
| 78. | Blanchard | 13.3% | 5.9%(+7.37)#78 | 5.8%(+7.50)#1,123 |
| 79. | Sadsburyville | 13.3% | 5.9%(+7.36)#79 | 5.8%(+7.50)#1,124 |
| 80. | Narberth Borough | 13.2% | 5.9%(+7.33)#80 | 5.8%(+7.46)#1,136 |
| 81. | Starrucca Borough | 13.2% | 5.9%(+7.29)#81 | 5.8%(+7.42)#1,147 |
| 82. | Clintondale | 13.2% | 5.9%(+7.29)#82 | 5.8%(+7.42)#1,148 |
| 83. | Exton | 13.2% | 5.9%(+7.26)#83 | 5.8%(+7.39)#1,155 |
| 84. | Edgeworth Borough | 13.1% | 5.9%(+7.22)#84 | 5.8%(+7.35)#1,165 |
| 85. | Sunrise Lake | 13.0% | 5.9%(+7.14)#85 | 5.8%(+7.27)#1,193 |
| 86. | Altamont | 13.0% | 5.9%(+7.07)#86 | 5.8%(+7.20)#1,209 |
| 87. | West Pittsburg | 12.9% | 5.9%(+6.97)#87 | 5.8%(+7.10)#1,232 |
| 88. | St. Davids | 12.8% | 5.9%(+6.94)#88 | 5.8%(+7.07)#1,242 |
| 89. | Glenmoore | 12.8% | 5.9%(+6.94)#89 | 5.8%(+7.07)#1,243 |
| 90. | Langhorne Borough | 12.8% | 5.9%(+6.89)#90 | 5.8%(+7.02)#1,256 |
| 91. | Yatesville Borough | 12.8% | 5.9%(+6.86)#91 | 5.8%(+6.99)#1,270 |
| 92. | Swedeland | 12.7% | 5.9%(+6.79)#92 | 5.8%(+6.93)#1,280 |
| 93. | Wanamie | 12.7% | 5.9%(+6.78)#93 | 5.8%(+6.91)#1,283 |
| 94. | Wampum Borough | 12.5% | 5.9%(+6.65)#94 | 5.8%(+6.78)#1,312 |
| 95. | Connoquenessing Borough | 12.5% | 5.9%(+6.61)#95 | 5.8%(+6.74)#1,321 |
| 96. | Oakland Cdp Cambria County | 12.4% | 5.9%(+6.53)#96 | 5.8%(+6.66)#1,357 |
| 97. | Chadds Ford | 12.4% | 5.9%(+6.52)#97 | 5.8%(+6.65)#1,359 |
| 98. | Village Shires | 12.3% | 5.9%(+6.40)#98 | 5.8%(+6.53)#1,389 |
| 99. | Spring City Borough | 12.2% | 5.9%(+6.27)#99 | 5.8%(+6.40)#1,428 |
| 100. | Mcknightstown | 12.1% | 5.9%(+6.19)#100 | 5.8%(+6.33)#1,460 |
Common Questions
What are the Top 10 Cities with the Highest Percentage of Population Employed in Business & Financial in Pennsylvania?
Top 10 Cities with the Highest Percentage of Population Employed in Business & Financial in Pennsylvania are:
#1
100.0%
#2
49.5%
#3
33.8%
#4
23.3%
#5
21.7%
#6
21.2%
#7
20.4%
#8
20.0%
#9
19.6%
#10
19.5%
What city has the Highest Percentage of Population Employed in Business & Financial in Pennsylvania?
Naomi has the Highest Percentage of Population Employed in Business & Financial in Pennsylvania with 100.0%.
What is the Percentage of Population Employed in Business & Financial in the State of Pennsylvania?
Percentage of Population Employed in Business & Financial in Pennsylvania is 5.9%.
What is the Percentage of Population Employed in Business & Financial in the United States?
Percentage of Population Employed in Business & Financial in the United States is 5.8%.