Zihlman, MD
Zihlman Map
Zihlman Overview
316
TOTAL POPULATION
189
MALE POPULATION
127
FEMALE POPULATION
148.82
MALES / 100 FEMALES
67.20
FEMALES / 100 MALES
47.6
MEDIAN AGE
2.3
AVG FAMILY SIZE
2.0
AVG HOUSEHOLD SIZE
$25,734
PER CAPITA INCOME
$47,969
AVG FAMILY INCOME
$48,073
AVG HOUSEHOLD INCOME
4.5%
WAGE / INCOME GAP [ % ]
95.5¢/ $1
WAGE / INCOME GAP [ $ ]
0.21
INEQUALITY / GINI INDEX
123
LABOR FORCE [ PEOPLE ]
43.8%
PERCENT IN LABOR FORCE
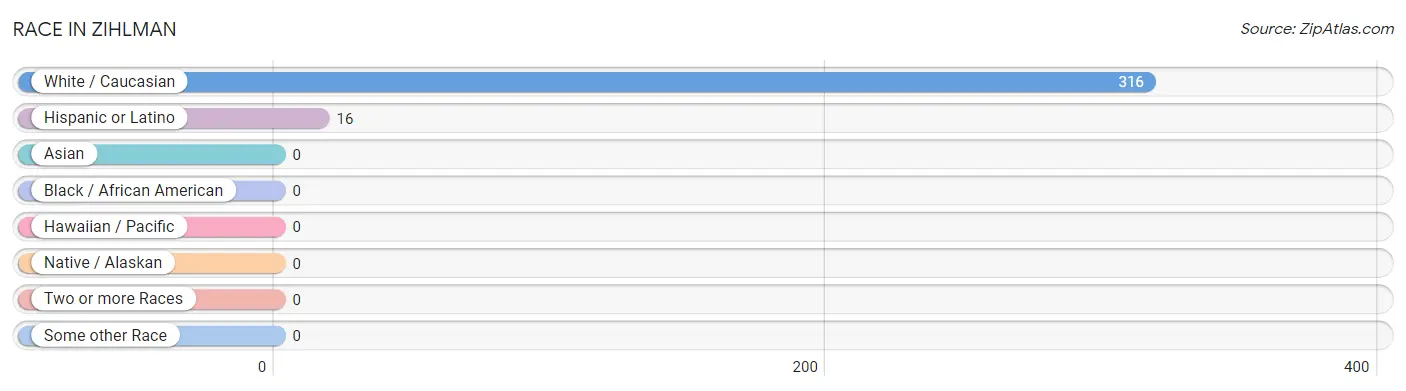
Race in Zihlman
The most populous races in Zihlman are White / Caucasian (316 | 100.0%), and Hispanic or Latino (16 | 5.1%).
| Race | # Population | % Population |
| Asian | 0 | 0.0% |
| Black / African American | 0 | 0.0% |
| Hawaiian / Pacific | 0 | 0.0% |
| Hispanic or Latino | 16 | 5.1% |
| Native / Alaskan | 0 | 0.0% |
| White / Caucasian | 316 | 100.0% |
| Two or more Races | 0 | 0.0% |
| Some other Race | 0 | 0.0% |
| Total | 316 | 100.0% |
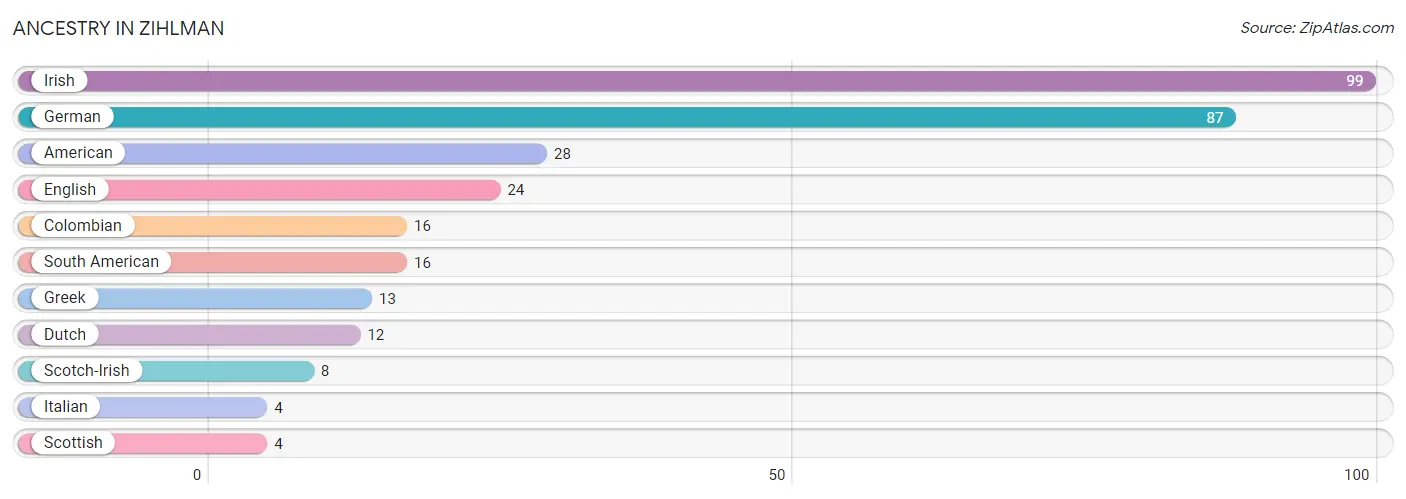
Ancestry in Zihlman
The most populous ancestries reported in Zihlman are Irish (99 | 31.3%), German (87 | 27.5%), American (28 | 8.9%), English (24 | 7.6%), and Colombian (16 | 5.1%), together accounting for 80.4% of all Zihlman residents.
| Ancestry | # Population | % Population |
| American | 28 | 8.9% |
| Colombian | 16 | 5.1% |
| Dutch | 12 | 3.8% |
| English | 24 | 7.6% |
| German | 87 | 27.5% |
| Greek | 13 | 4.1% |
| Irish | 99 | 31.3% |
| Italian | 4 | 1.3% |
| Scotch-Irish | 8 | 2.5% |
| Scottish | 4 | 1.3% |
| South American | 16 | 5.1% | View All 11 Rows |
Immigrants in Zihlman

| Immigration Origin | # Population | % Population | View All 0 Rows |
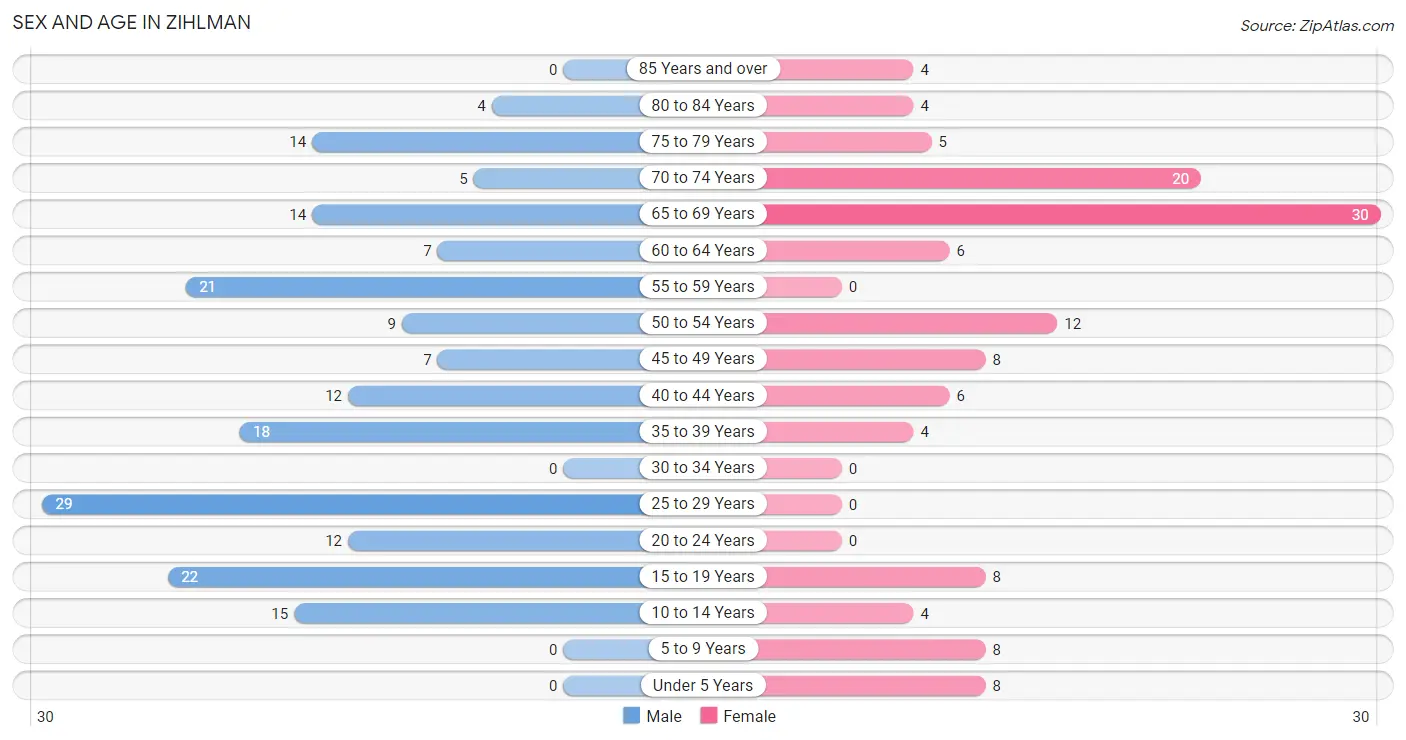
Sex and Age in Zihlman
Sex and Age in Zihlman
The most populous age groups in Zihlman are 25 to 29 Years (29 | 15.3%) for men and 65 to 69 Years (30 | 23.6%) for women.
| Age Bracket | Male | Female |
| Under 5 Years | 0 (0.0%) | 8 (6.3%) |
| 5 to 9 Years | 0 (0.0%) | 8 (6.3%) |
| 10 to 14 Years | 15 (7.9%) | 4 (3.2%) |
| 15 to 19 Years | 22 (11.6%) | 8 (6.3%) |
| 20 to 24 Years | 12 (6.4%) | 0 (0.0%) |
| 25 to 29 Years | 29 (15.3%) | 0 (0.0%) |
| 30 to 34 Years | 0 (0.0%) | 0 (0.0%) |
| 35 to 39 Years | 18 (9.5%) | 4 (3.2%) |
| 40 to 44 Years | 12 (6.4%) | 6 (4.7%) |
| 45 to 49 Years | 7 (3.7%) | 8 (6.3%) |
| 50 to 54 Years | 9 (4.8%) | 12 (9.5%) |
| 55 to 59 Years | 21 (11.1%) | 0 (0.0%) |
| 60 to 64 Years | 7 (3.7%) | 6 (4.7%) |
| 65 to 69 Years | 14 (7.4%) | 30 (23.6%) |
| 70 to 74 Years | 5 (2.6%) | 20 (15.8%) |
| 75 to 79 Years | 14 (7.4%) | 5 (3.9%) |
| 80 to 84 Years | 4 (2.1%) | 4 (3.2%) |
| 85 Years and over | 0 (0.0%) | 4 (3.2%) |
| Total | 189 (100.0%) | 127 (100.0%) |
Families and Households in Zihlman
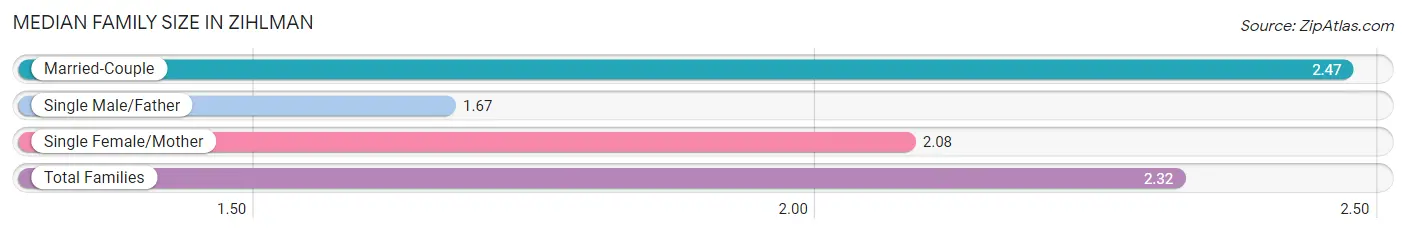
Median Family Size in Zihlman
The median family size in Zihlman is 2.32 persons per family, with married-couple families (70 | 68.6%) accounting for the largest median family size of 2.47 persons per family. On the other hand, single male/father families (6 | 5.9%) represent the smallest median family size with 1.67 persons per family.
| Family Type | # Families | Family Size |
| Married-Couple | 70 (68.6%) | 2.47 |
| Single Male/Father | 6 (5.9%) | 1.67 |
| Single Female/Mother | 26 (25.5%) | 2.08 |
| Total Families | 102 (100.0%) | 2.32 |
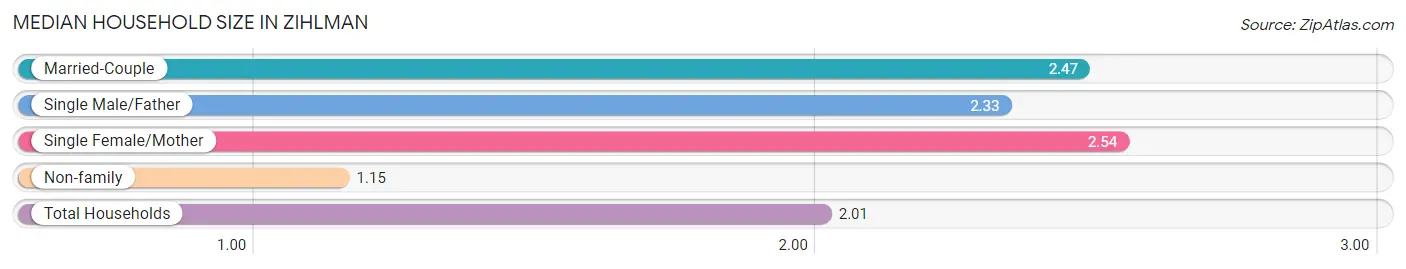
Median Household Size in Zihlman
The median household size in Zihlman is 2.01 persons per household, with single female/mother households (26 | 16.6%) accounting for the largest median household size of 2.54 persons per household. non-family households (55 | 35.0%) represent the smallest median household size with 1.15 persons per household.
| Household Type | # Households | Household Size |
| Married-Couple | 70 (44.6%) | 2.47 |
| Single Male/Father | 6 (3.8%) | 2.33 |
| Single Female/Mother | 26 (16.6%) | 2.54 |
| Non-family | 55 (35.0%) | 1.15 |
| Total Households | 157 (100.0%) | 2.01 |
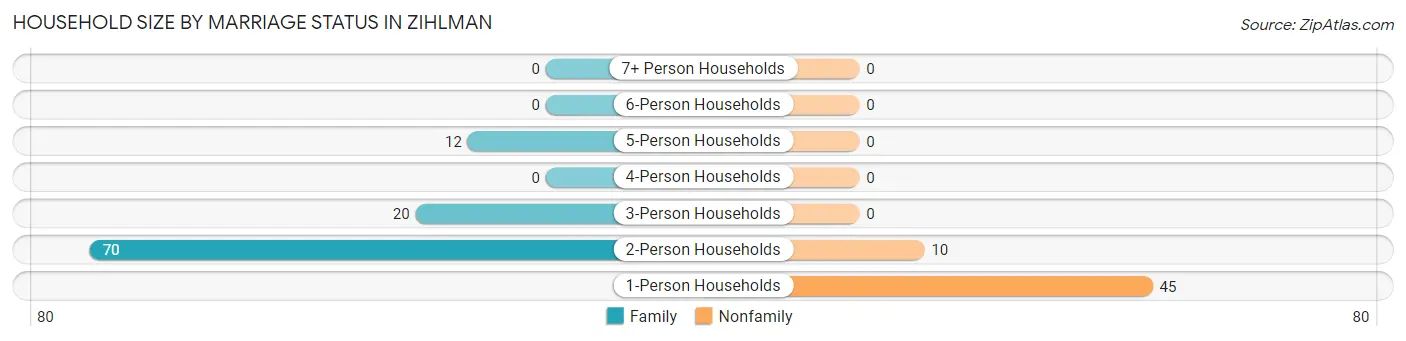
Household Size by Marriage Status in Zihlman
Out of a total of 157 households in Zihlman, 102 (65.0%) are family households, while 55 (35.0%) are nonfamily households. The most numerous type of family households are 2-person households, comprising 70, and the most common type of nonfamily households are 1-person households, comprising 45.
| Household Size | Family Households | Nonfamily Households |
| 1-Person Households | - | 45 (28.7%) |
| 2-Person Households | 70 (44.6%) | 10 (6.4%) |
| 3-Person Households | 20 (12.7%) | 0 (0.0%) |
| 4-Person Households | 0 (0.0%) | 0 (0.0%) |
| 5-Person Households | 12 (7.6%) | 0 (0.0%) |
| 6-Person Households | 0 (0.0%) | 0 (0.0%) |
| 7+ Person Households | 0 (0.0%) | 0 (0.0%) |
| Total | 102 (65.0%) | 55 (35.0%) |
Female Fertility in Zihlman
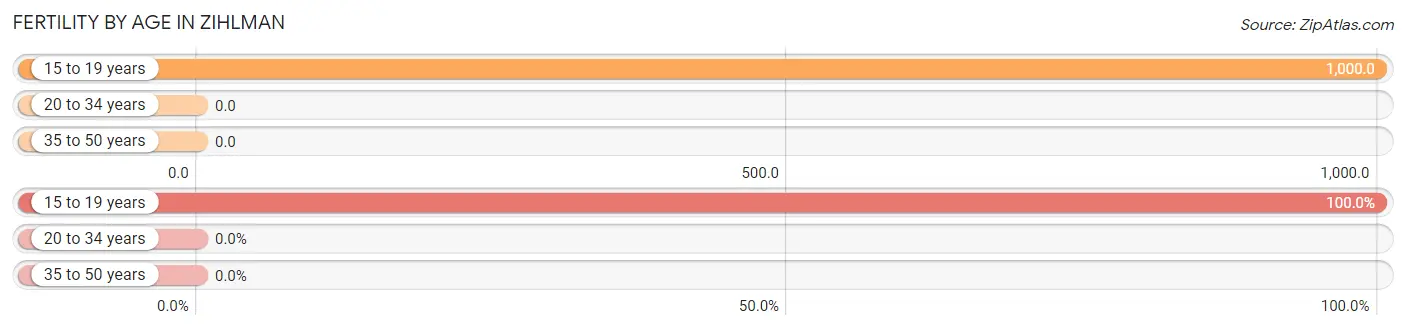
Fertility by Age in Zihlman
Average fertility rate in Zihlman is 235.0 births per 1,000 women. Women in the age bracket of 15 to 19 years have the highest fertility rate with 1,000.0 births per 1,000 women. Women in the age bracket of 15 to 19 years acount for 100.0% of all women with births.
| Age Bracket | Women with Births | Births / 1,000 Women |
| 15 to 19 years | 8 (100.0%) | 1,000.0 |
| 20 to 34 years | 0 (0.0%) | 0.0 |
| 35 to 50 years | 0 (0.0%) | 0.0 |
| Total | 8 (100.0%) | 235.0 |
Fertility by Age by Marriage Status in Zihlman
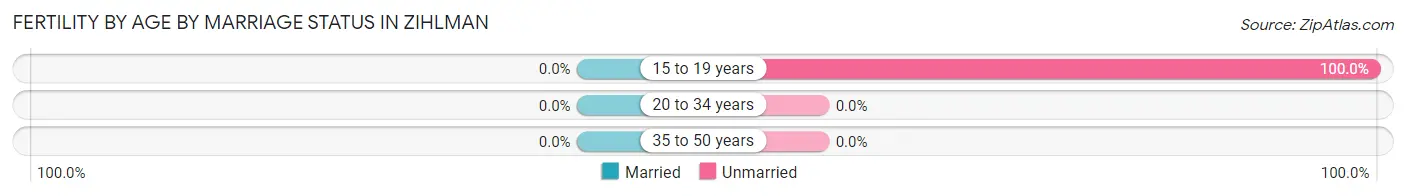
| Age Bracket | Married | Unmarried |
| 15 to 19 years | 0 (0.0%) | 8 (100.0%) |
| 20 to 34 years | 0 (0.0%) | 0 (0.0%) |
| 35 to 50 years | 0 (0.0%) | 0 (0.0%) |
| Total | 0 (0.0%) | 8 (100.0%) |
Fertility by Education in Zihlman
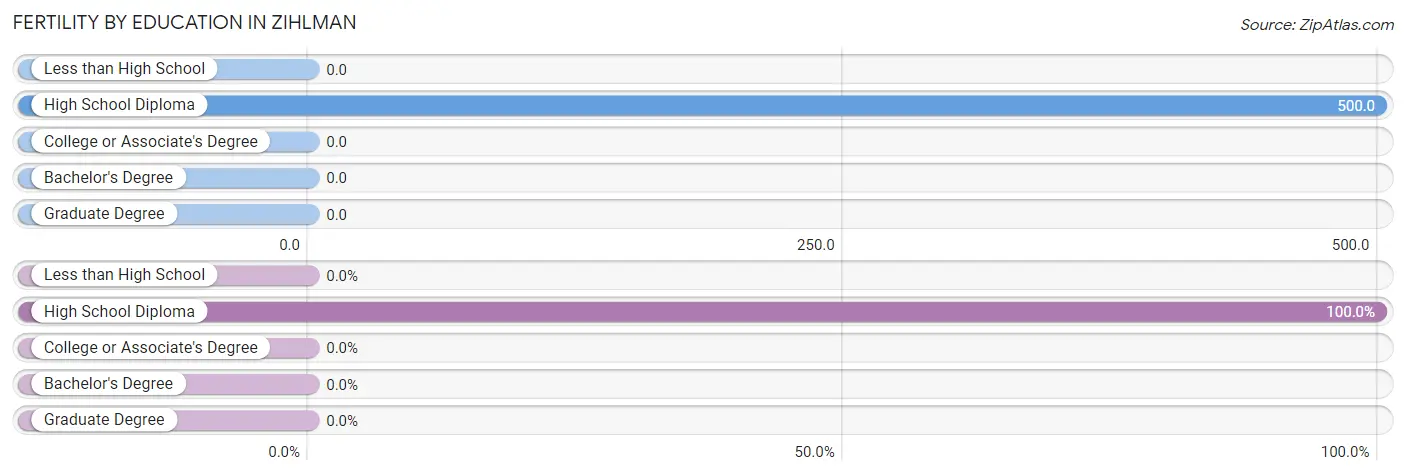
| Educational Attainment | Women with Births | Births / 1,000 Women |
| Less than High School | 0 (0.0%) | 0.0 |
| High School Diploma | 8 (100.0%) | 500.0 |
| College or Associate's Degree | 0 (0.0%) | 0.0 |
| Bachelor's Degree | 0 (0.0%) | 0.0 |
| Graduate Degree | 0 (0.0%) | 0.0 |
| Total | 8 (100.0%) | 235.0 |
Fertility by Education by Marriage Status in Zihlman
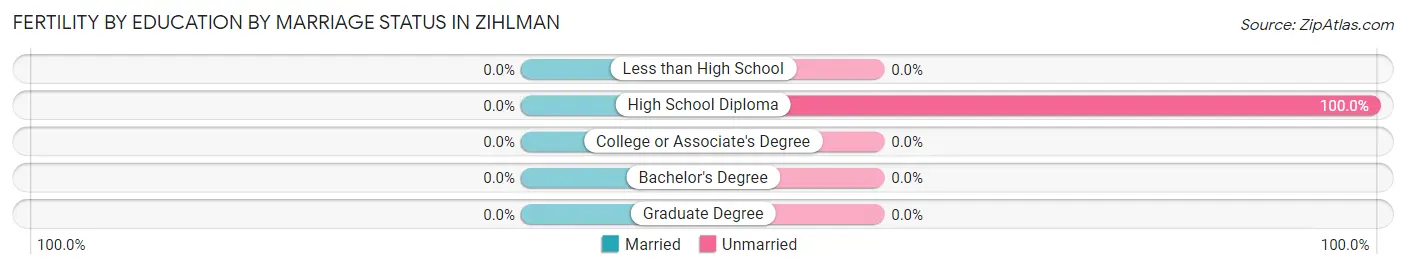
| Educational Attainment | Married | Unmarried |
| Less than High School | 0 (0.0%) | 0 (0.0%) |
| High School Diploma | 0 (0.0%) | 8 (100.0%) |
| College or Associate's Degree | 0 (0.0%) | 0 (0.0%) |
| Bachelor's Degree | 0 (0.0%) | 0 (0.0%) |
| Graduate Degree | 0 (0.0%) | 0 (0.0%) |
| Total | 0 (0.0%) | 8 (100.0%) |
Income in Zihlman
Income Overview in Zihlman
Per Capita Income in Zihlman is $25,734, while median incomes of families and households are $47,969 and $48,073 respectively.
| Characteristic | Number | Measure |
| Per Capita Income | 316 | $25,734 |
| Median Family Income | 102 | $47,969 |
| Mean Family Income | 102 | $52,595 |
| Median Household Income | 157 | $48,073 |
| Mean Household Income | 157 | $52,810 |
| Income Deficit | 102 | $0 |
| Wage / Income Gap (%) | 316 | 4.49% |
| Wage / Income Gap ($) | 316 | 95.51¢ per $1 |
| Gini / Inequality Index | 316 | 0.21 |
Earnings by Sex in Zihlman
Average Earnings in Zihlman are $43,614, $43,844 for men and $41,875 for women, a difference of 4.5%.
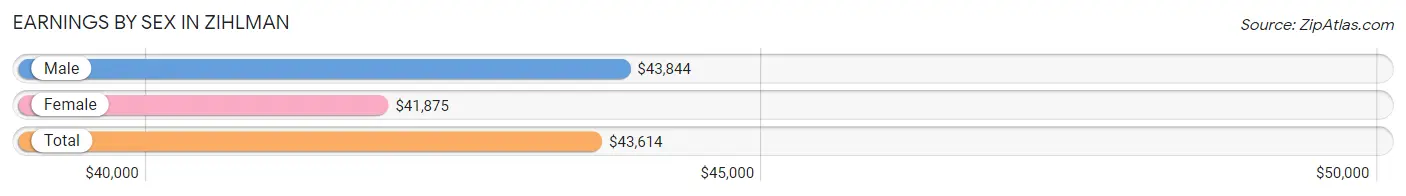
| Sex | Number | Average Earnings |
| Male | 107 (78.1%) | $43,844 |
| Female | 30 (21.9%) | $41,875 |
| Total | 137 (100.0%) | $43,614 |
Earnings by Sex by Income Bracket in Zihlman
The most common earnings brackets in Zihlman are $40,000 to $44,999 for men (40 | 37.4%) and $40,000 to $44,999 for women (10 | 33.3%).
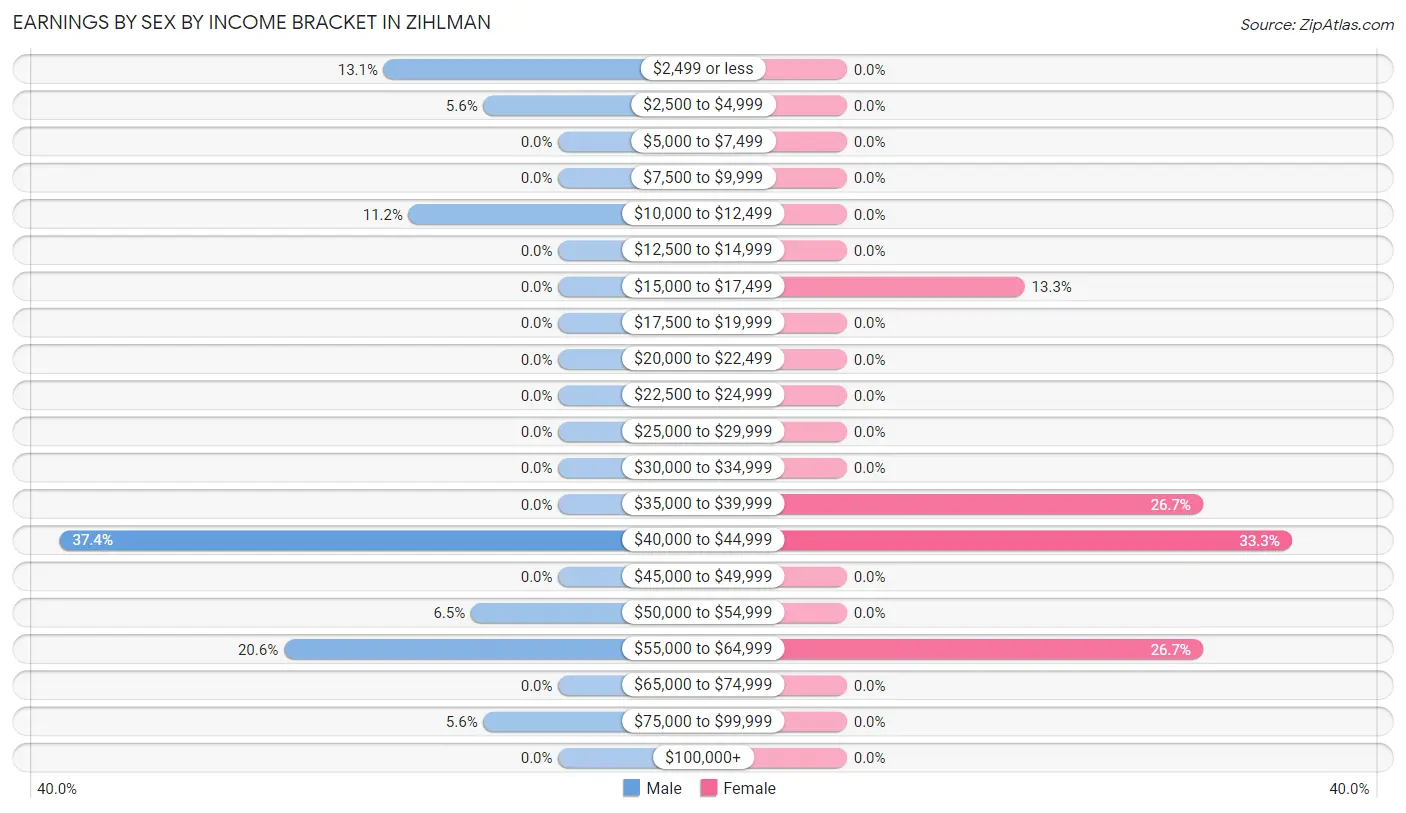
| Income | Male | Female |
| $2,499 or less | 14 (13.1%) | 0 (0.0%) |
| $2,500 to $4,999 | 6 (5.6%) | 0 (0.0%) |
| $5,000 to $7,499 | 0 (0.0%) | 0 (0.0%) |
| $7,500 to $9,999 | 0 (0.0%) | 0 (0.0%) |
| $10,000 to $12,499 | 12 (11.2%) | 0 (0.0%) |
| $12,500 to $14,999 | 0 (0.0%) | 0 (0.0%) |
| $15,000 to $17,499 | 0 (0.0%) | 4 (13.3%) |
| $17,500 to $19,999 | 0 (0.0%) | 0 (0.0%) |
| $20,000 to $22,499 | 0 (0.0%) | 0 (0.0%) |
| $22,500 to $24,999 | 0 (0.0%) | 0 (0.0%) |
| $25,000 to $29,999 | 0 (0.0%) | 0 (0.0%) |
| $30,000 to $34,999 | 0 (0.0%) | 0 (0.0%) |
| $35,000 to $39,999 | 0 (0.0%) | 8 (26.7%) |
| $40,000 to $44,999 | 40 (37.4%) | 10 (33.3%) |
| $45,000 to $49,999 | 0 (0.0%) | 0 (0.0%) |
| $50,000 to $54,999 | 7 (6.5%) | 0 (0.0%) |
| $55,000 to $64,999 | 22 (20.6%) | 8 (26.7%) |
| $65,000 to $74,999 | 0 (0.0%) | 0 (0.0%) |
| $75,000 to $99,999 | 6 (5.6%) | 0 (0.0%) |
| $100,000+ | 0 (0.0%) | 0 (0.0%) |
| Total | 107 (100.0%) | 30 (100.0%) |
Earnings by Sex by Educational Attainment in Zihlman
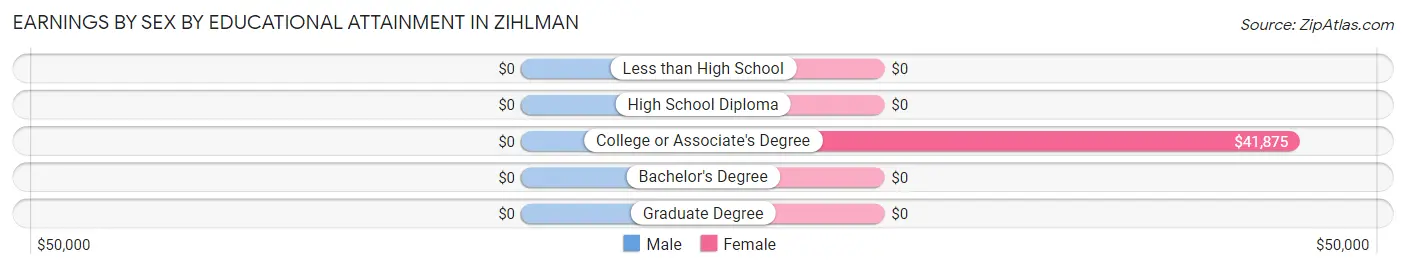
| Educational Attainment | Male Income | Female Income |
| Less than High School | - | - |
| High School Diploma | - | - |
| College or Associate's Degree | - | - |
| Bachelor's Degree | - | - |
| Graduate Degree | - | - |
| Total | $44,406 | $43,750 |
Family Income in Zihlman
Family Income Brackets in Zihlman
According to the Zihlman family income data, there are 39 families falling into the $35,000 to $49,999 income range, which is the most common income bracket and makes up 38.2% of all families.
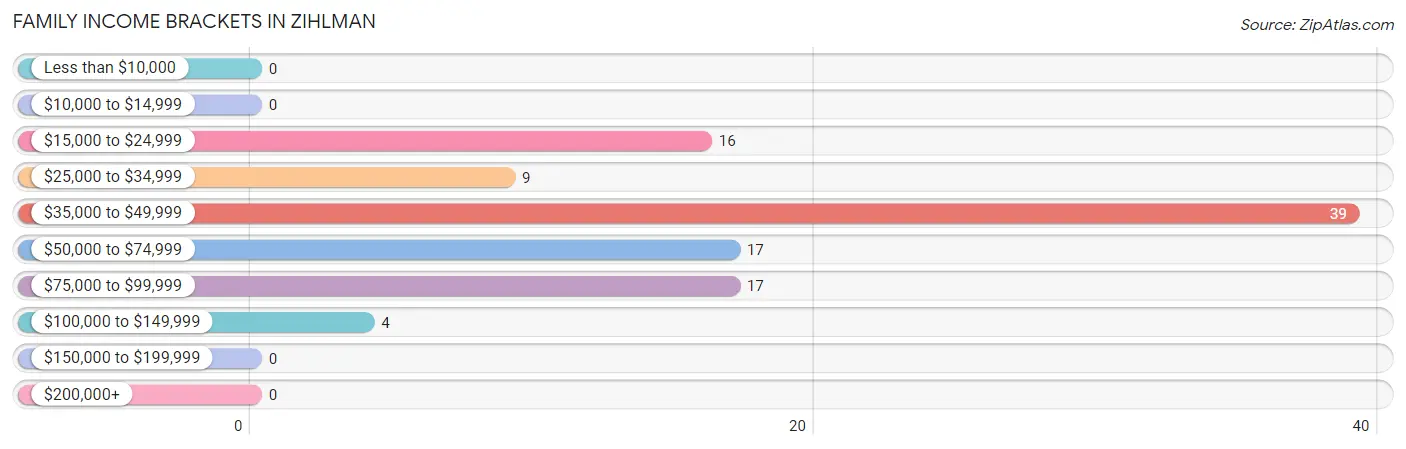
| Income Bracket | # Families | % Families |
| Less than $10,000 | 0 | 0.0% |
| $10,000 to $14,999 | 0 | 0.0% |
| $15,000 to $24,999 | 16 | 15.7% |
| $25,000 to $34,999 | 9 | 8.8% |
| $35,000 to $49,999 | 39 | 38.2% |
| $50,000 to $74,999 | 17 | 16.7% |
| $75,000 to $99,999 | 17 | 16.7% |
| $100,000 to $149,999 | 4 | 3.9% |
| $150,000 to $199,999 | 0 | 0.0% |
| $200,000+ | 0 | 0.0% |
Family Income by Famaliy Size in Zihlman
2-person families (84 | 82.4%) account for the highest median family income in Zihlman with $43,636 per family, while 2-person families (84 | 82.4%) have the highest median income of $21,818 per family member.
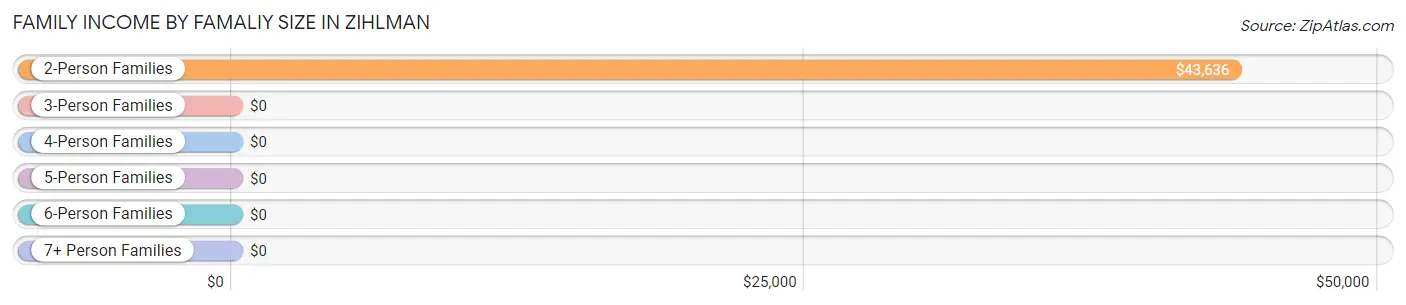
| Income Bracket | # Families | Median Income |
| 2-Person Families | 84 (82.4%) | $43,636 |
| 3-Person Families | 6 (5.9%) | $0 |
| 4-Person Families | 0 (0.0%) | $0 |
| 5-Person Families | 12 (11.8%) | $0 |
| 6-Person Families | 0 (0.0%) | $0 |
| 7+ Person Families | 0 (0.0%) | $0 |
| Total | 102 (100.0%) | $47,969 |
Family Income by Number of Earners in Zihlman
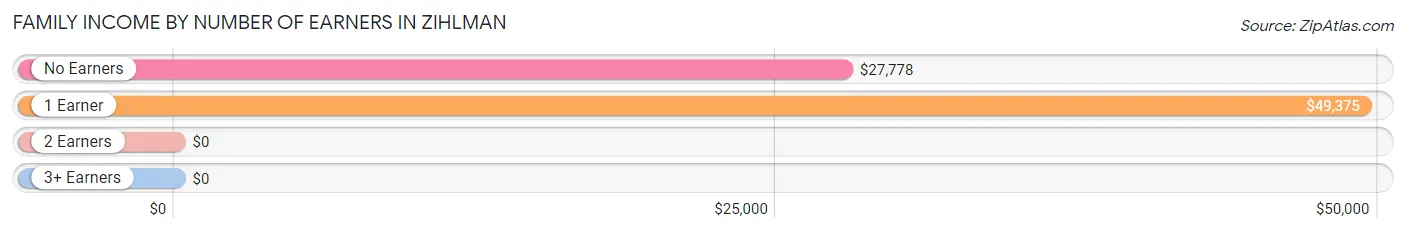
| Number of Earners | # Families | Median Income |
| No Earners | 34 (33.3%) | $27,778 |
| 1 Earner | 62 (60.8%) | $49,375 |
| 2 Earners | 6 (5.9%) | $0 |
| 3+ Earners | 0 (0.0%) | $0 |
| Total | 102 (100.0%) | $47,969 |
Household Income in Zihlman
Household Income Brackets in Zihlman
With 72 households falling in the category, the $35,000 to $49,999 income range is the most frequent in Zihlman, accounting for 45.9% of all households.
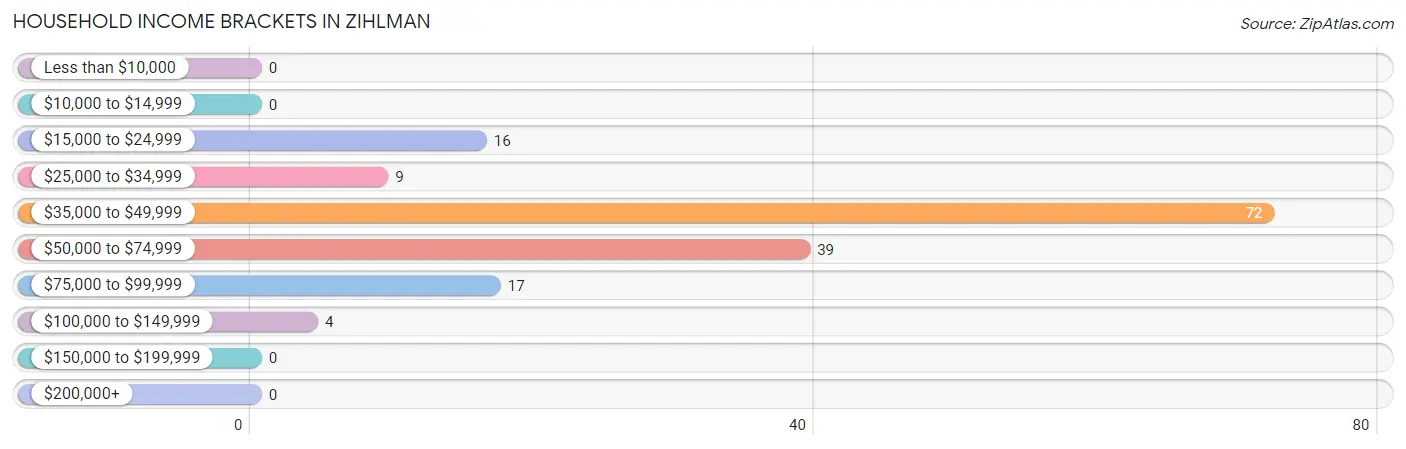
| Income Bracket | # Households | % Households |
| Less than $10,000 | 0 | 0.0% |
| $10,000 to $14,999 | 0 | 0.0% |
| $15,000 to $24,999 | 16 | 10.2% |
| $25,000 to $34,999 | 9 | 5.7% |
| $35,000 to $49,999 | 72 | 45.9% |
| $50,000 to $74,999 | 39 | 24.8% |
| $75,000 to $99,999 | 17 | 10.8% |
| $100,000 to $149,999 | 4 | 2.5% |
| $150,000 to $199,999 | 0 | 0.0% |
| $200,000+ | 0 | 0.0% |
Household Income by Householder Age in Zihlman
The median household income in Zihlman is $48,073, with the highest median household income of $60,125 found in the 45 to 64 years age bracket for the primary householder. A total of 31 households (19.8%) fall into this category. Meanwhile, the 15 to 24 years age bracket for the primary householder has the lowest median household income of $0, with 8 households (5.1%) in this group.
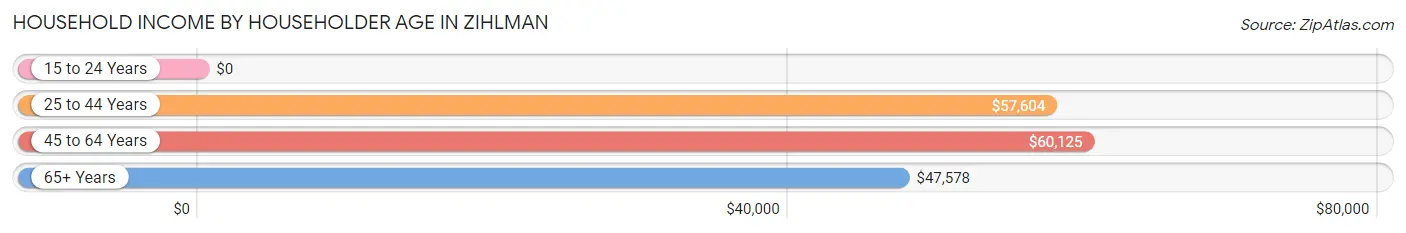
| Income Bracket | # Households | Median Income |
| 15 to 24 Years | 8 (5.1%) | $0 |
| 25 to 44 Years | 59 (37.6%) | $57,604 |
| 45 to 64 Years | 31 (19.8%) | $60,125 |
| 65+ Years | 59 (37.6%) | $47,578 |
| Total | 157 (100.0%) | $48,073 |
Poverty in Zihlman
Income Below Poverty by Sex and Age in Zihlman
With 6.4% poverty level for males and 9.5% for females among the residents of Zihlman, 18 to 24 year old males and 35 to 44 year old females are the most vulnerable to poverty, with 12 males (66.7%) and 4 females (40.0%) in their respective age groups living below the poverty level.
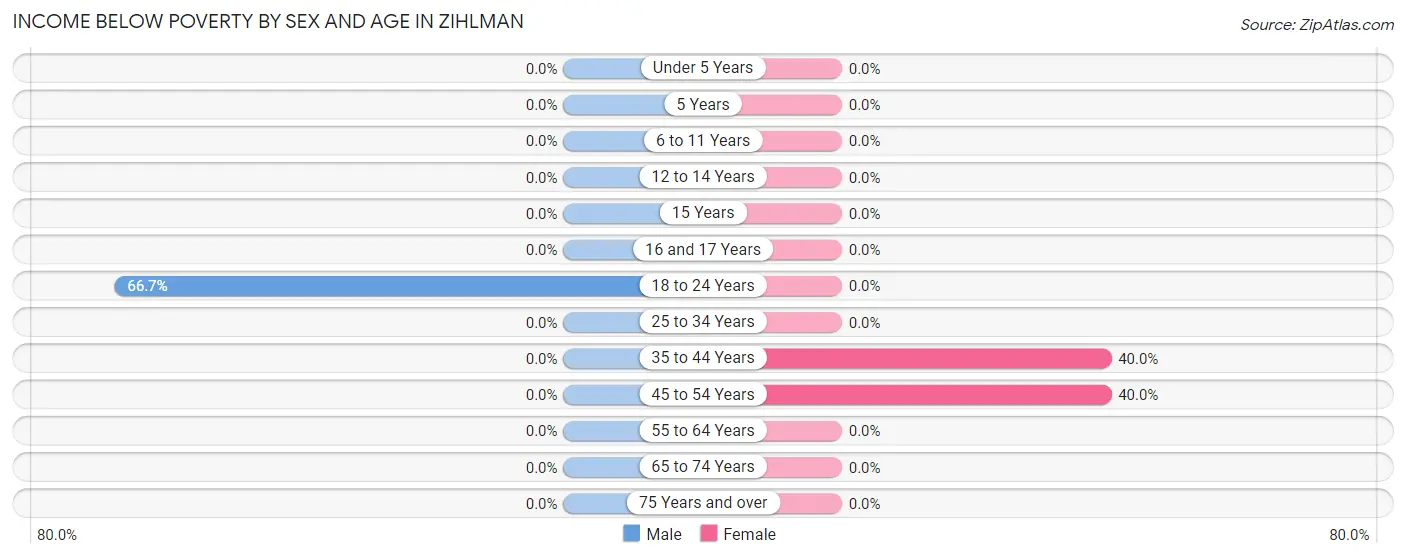
| Age Bracket | Male | Female |
| Under 5 Years | 0 (0.0%) | 0 (0.0%) |
| 5 Years | 0 (0.0%) | 0 (0.0%) |
| 6 to 11 Years | 0 (0.0%) | 0 (0.0%) |
| 12 to 14 Years | 0 (0.0%) | 0 (0.0%) |
| 15 Years | 0 (0.0%) | 0 (0.0%) |
| 16 and 17 Years | 0 (0.0%) | 0 (0.0%) |
| 18 to 24 Years | 12 (66.7%) | 0 (0.0%) |
| 25 to 34 Years | 0 (0.0%) | 0 (0.0%) |
| 35 to 44 Years | 0 (0.0%) | 4 (40.0%) |
| 45 to 54 Years | 0 (0.0%) | 8 (40.0%) |
| 55 to 64 Years | 0 (0.0%) | 0 (0.0%) |
| 65 to 74 Years | 0 (0.0%) | 0 (0.0%) |
| 75 Years and over | 0 (0.0%) | 0 (0.0%) |
| Total | 12 (6.4%) | 12 (9.5%) |
Income Above Poverty by Sex and Age in Zihlman
According to the poverty statistics in Zihlman, males aged 12 to 14 years and females aged under 5 years are the age groups that are most secure financially, with 100.0% of males and 100.0% of females in these age groups living above the poverty line.
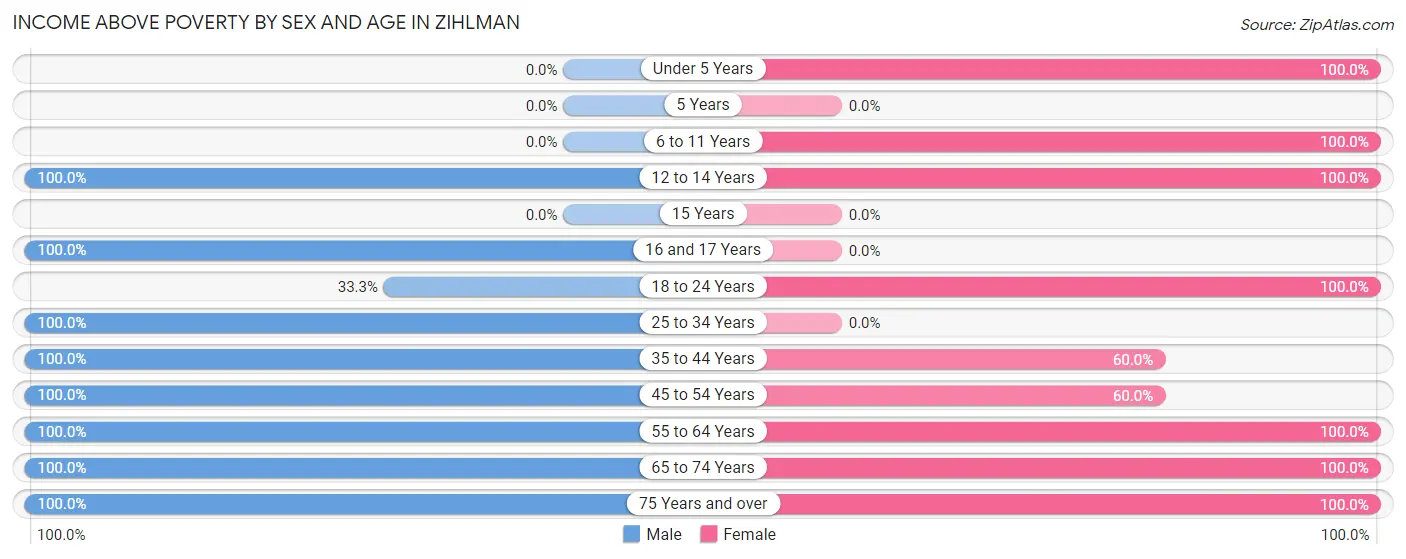
| Age Bracket | Male | Female |
| Under 5 Years | 0 (0.0%) | 8 (100.0%) |
| 5 Years | 0 (0.0%) | 0 (0.0%) |
| 6 to 11 Years | 0 (0.0%) | 8 (100.0%) |
| 12 to 14 Years | 15 (100.0%) | 4 (100.0%) |
| 15 Years | 0 (0.0%) | 0 (0.0%) |
| 16 and 17 Years | 16 (100.0%) | 0 (0.0%) |
| 18 to 24 Years | 6 (33.3%) | 8 (100.0%) |
| 25 to 34 Years | 29 (100.0%) | 0 (0.0%) |
| 35 to 44 Years | 30 (100.0%) | 6 (60.0%) |
| 45 to 54 Years | 16 (100.0%) | 12 (60.0%) |
| 55 to 64 Years | 28 (100.0%) | 6 (100.0%) |
| 65 to 74 Years | 19 (100.0%) | 50 (100.0%) |
| 75 Years and over | 18 (100.0%) | 13 (100.0%) |
| Total | 177 (93.6%) | 115 (90.5%) |
Income Below Poverty Among Married-Couple Families in Zihlman
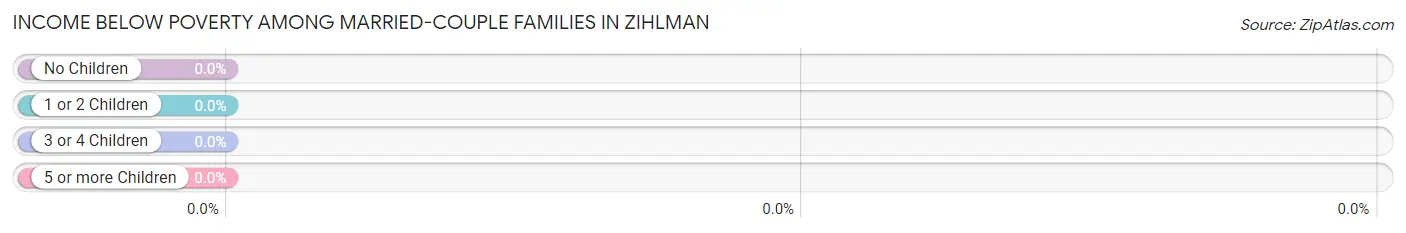
| Children | Above Poverty | Below Poverty |
| No Children | 58 (100.0%) | 0 (0.0%) |
| 1 or 2 Children | 0 (0.0%) | 0 (0.0%) |
| 3 or 4 Children | 12 (100.0%) | 0 (0.0%) |
| 5 or more Children | 0 (0.0%) | 0 (0.0%) |
| Total | 70 (100.0%) | 0 (0.0%) |
Income Below Poverty Among Single-Parent Households in Zihlman
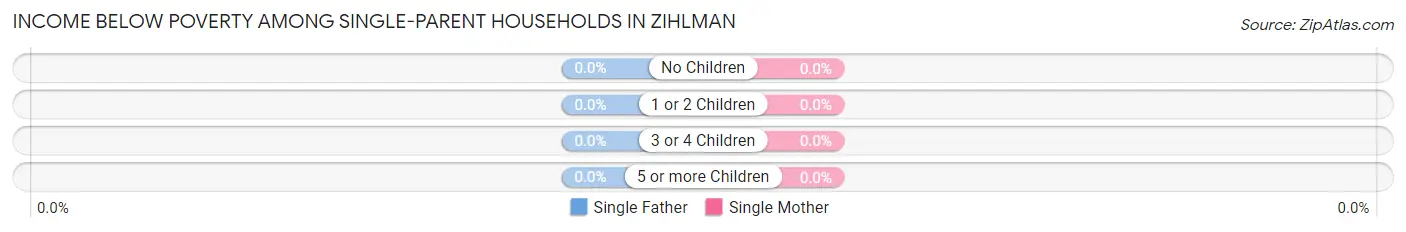
| Children | Single Father | Single Mother |
| No Children | 0 (0.0%) | 0 (0.0%) |
| 1 or 2 Children | 0 (0.0%) | 0 (0.0%) |
| 3 or 4 Children | 0 (0.0%) | 0 (0.0%) |
| 5 or more Children | 0 (0.0%) | 0 (0.0%) |
| Total | 0 (0.0%) | 0 (0.0%) |
Income Below Poverty Among Married-Couple vs Single-Parent Households in Zihlman
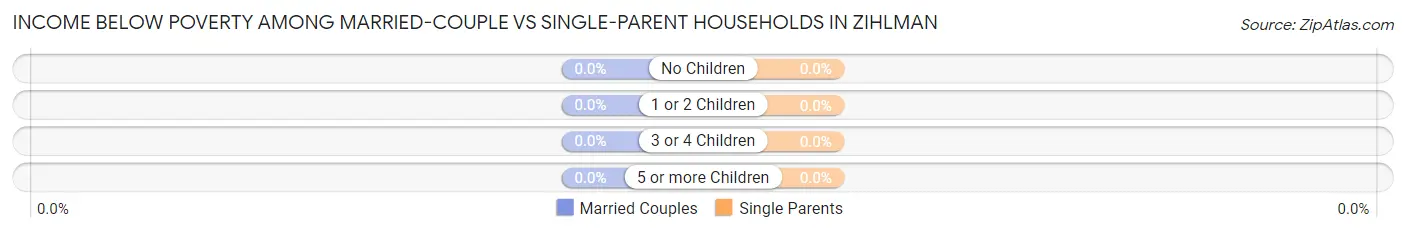
| Children | Married-Couple Families | Single-Parent Households |
| No Children | 0 (0.0%) | 0 (0.0%) |
| 1 or 2 Children | 0 (0.0%) | 0 (0.0%) |
| 3 or 4 Children | 0 (0.0%) | 0 (0.0%) |
| 5 or more Children | 0 (0.0%) | 0 (0.0%) |
| Total | 0 (0.0%) | 0 (0.0%) |
Employment Characteristics in Zihlman
Employment by Class of Employer in Zihlman
Among the 123 employed individuals in Zihlman, private company employees (81 | 65.8%), state government employees (20 | 16.3%), and self-employed (not incorporated) (12 | 9.8%) make up the most common classes of employment.
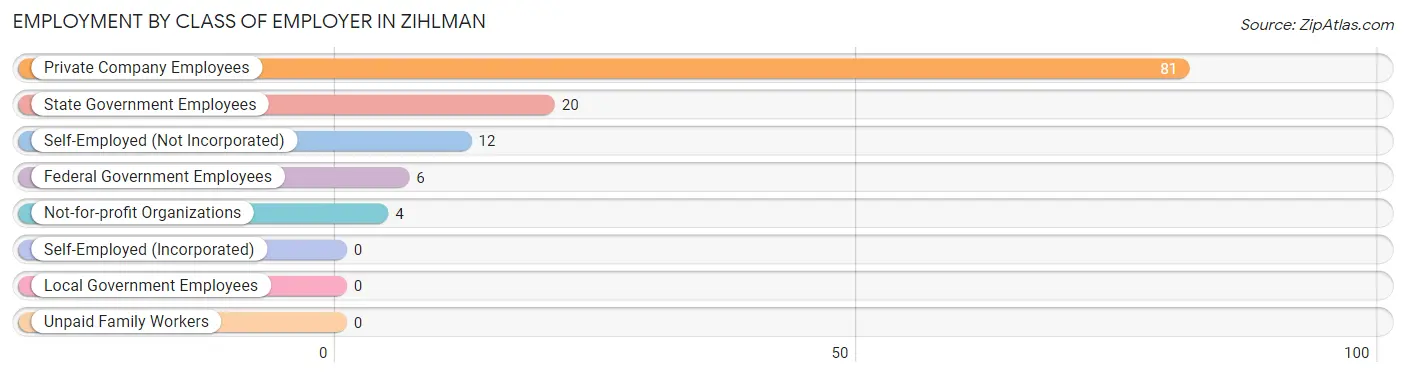
| Employer Class | # Employees | % Employees |
| Private Company Employees | 81 | 65.8% |
| Self-Employed (Incorporated) | 0 | 0.0% |
| Self-Employed (Not Incorporated) | 12 | 9.8% |
| Not-for-profit Organizations | 4 | 3.3% |
| Local Government Employees | 0 | 0.0% |
| State Government Employees | 20 | 16.3% |
| Federal Government Employees | 6 | 4.9% |
| Unpaid Family Workers | 0 | 0.0% |
| Total | 123 | 100.0% |
Employment Status by Age in Zihlman
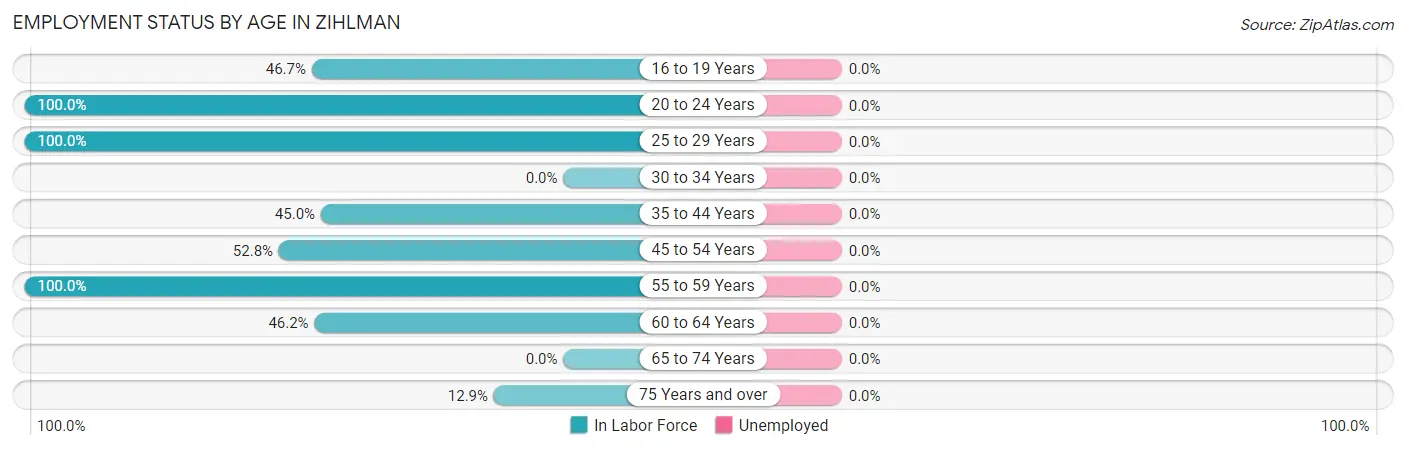
| Age Bracket | In Labor Force | Unemployed |
| 16 to 19 Years | 14 (46.7%) | 0 (0.0%) |
| 20 to 24 Years | 12 (100.0%) | 0 (0.0%) |
| 25 to 29 Years | 29 (100.0%) | 0 (0.0%) |
| 30 to 34 Years | 0 (0.0%) | 0 (0.0%) |
| 35 to 44 Years | 18 (45.0%) | 0 (0.0%) |
| 45 to 54 Years | 19 (52.8%) | 0 (0.0%) |
| 55 to 59 Years | 21 (100.0%) | 0 (0.0%) |
| 60 to 64 Years | 6 (46.2%) | 0 (0.0%) |
| 65 to 74 Years | 0 (0.0%) | 0 (0.0%) |
| 75 Years and over | 4 (12.9%) | 0 (0.0%) |
| Total | 123 (43.8%) | 0 (0.0%) |
Employment Status by Educational Attainment in Zihlman
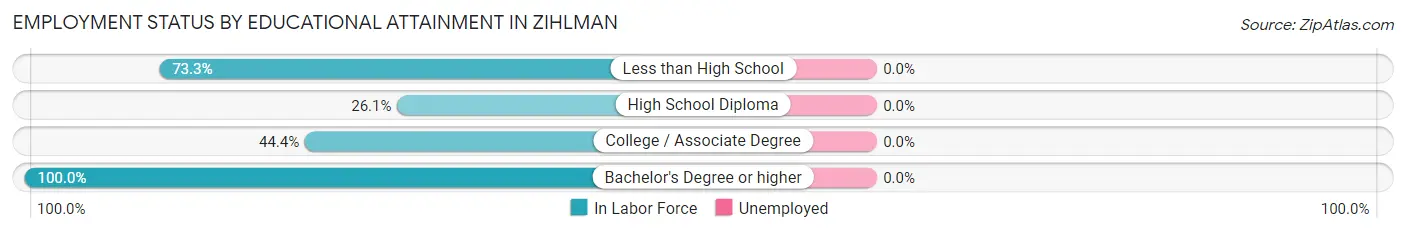
| Educational Attainment | In Labor Force | Unemployed |
| Less than High School | 11 (73.3%) | 0 (0.0%) |
| High School Diploma | 6 (26.1%) | 0 (0.0%) |
| College / Associate Degree | 20 (44.4%) | 0 (0.0%) |
| Bachelor's Degree or higher | 56 (100.0%) | 0 (0.0%) |
| Total | 93 (66.9%) | 0 (0.0%) |
Employment Occupations by Sex in Zihlman
Management, Business, Science and Arts Occupations
The most common Management, Business, Science and Arts occupations in Zihlman are Computers, Engineering & Science (39 | 31.7%), Computers & Mathematics (29 | 23.6%), Business & Financial (20 | 16.3%), Architecture & Engineering (10 | 8.1%), and Community & Social Service (7 | 5.7%).
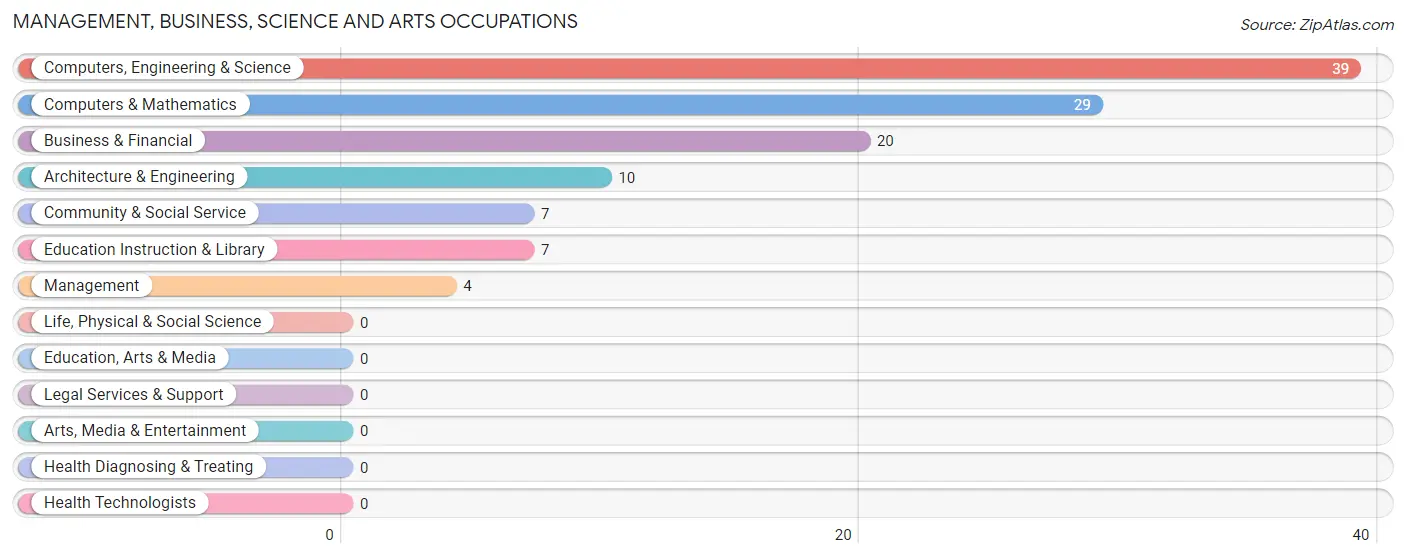
Management, Business, Science and Arts Occupations by Sex
Within the Management, Business, Science and Arts occupations in Zihlman, the most male-oriented occupations are Computers, Engineering & Science (100.0%), Computers & Mathematics (100.0%), and Architecture & Engineering (100.0%), while the most female-oriented occupations are Management (100.0%), and Business & Financial (40.0%).
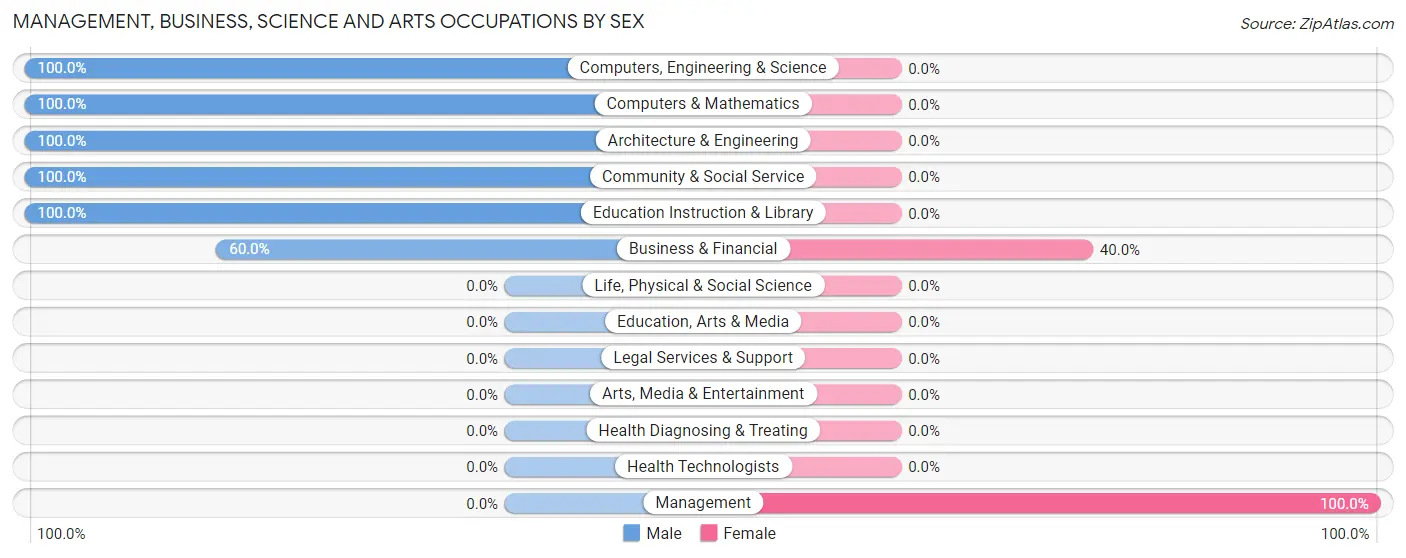
| Occupation | Male | Female |
| Management | 0 (0.0%) | 4 (100.0%) |
| Business & Financial | 12 (60.0%) | 8 (40.0%) |
| Computers, Engineering & Science | 39 (100.0%) | 0 (0.0%) |
| Computers & Mathematics | 29 (100.0%) | 0 (0.0%) |
| Architecture & Engineering | 10 (100.0%) | 0 (0.0%) |
| Life, Physical & Social Science | 0 (0.0%) | 0 (0.0%) |
| Community & Social Service | 7 (100.0%) | 0 (0.0%) |
| Education, Arts & Media | 0 (0.0%) | 0 (0.0%) |
| Legal Services & Support | 0 (0.0%) | 0 (0.0%) |
| Education Instruction & Library | 7 (100.0%) | 0 (0.0%) |
| Arts, Media & Entertainment | 0 (0.0%) | 0 (0.0%) |
| Health Diagnosing & Treating | 0 (0.0%) | 0 (0.0%) |
| Health Technologists | 0 (0.0%) | 0 (0.0%) |
| Total (Category) | 58 (82.9%) | 12 (17.1%) |
| Total (Overall) | 93 (75.6%) | 30 (24.4%) |
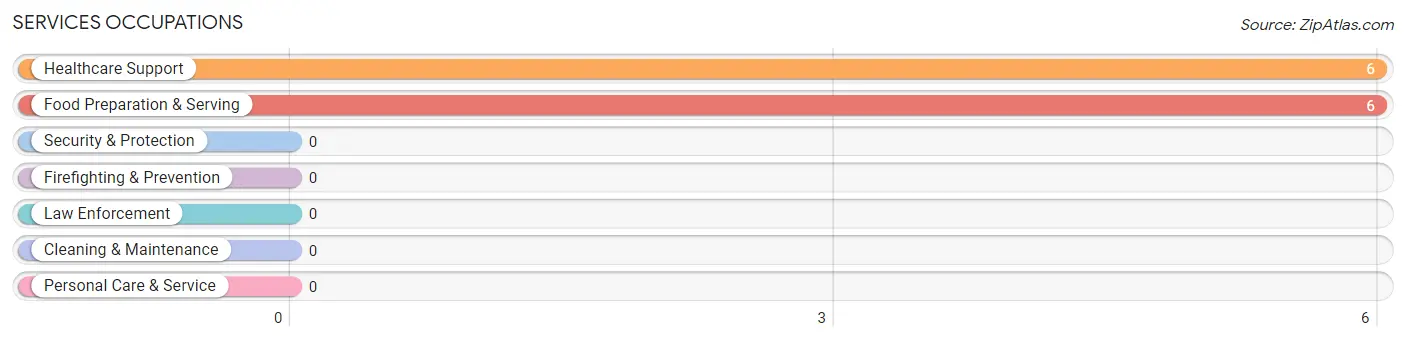
Services Occupations
The most common Services occupations in Zihlman are Healthcare Support (6 | 4.9%), and Food Preparation & Serving (6 | 4.9%).
Services Occupations by Sex
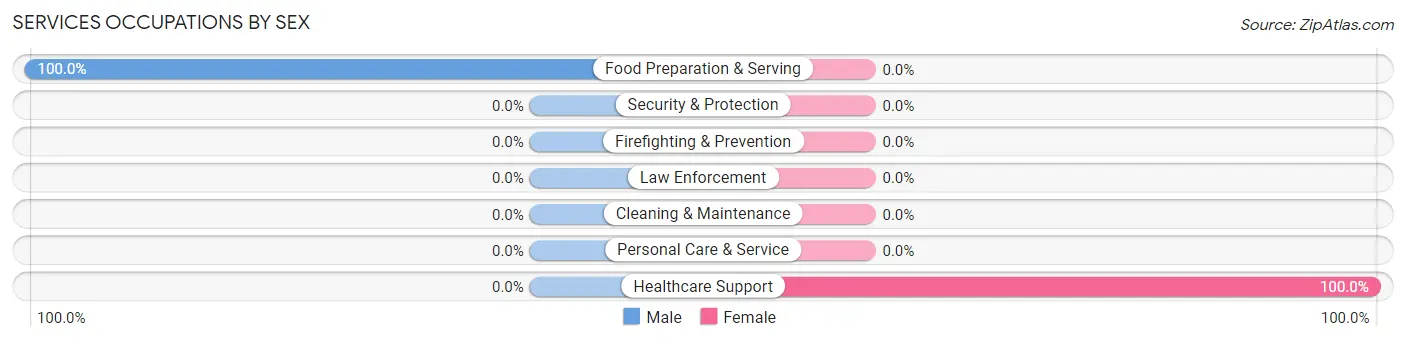
| Occupation | Male | Female |
| Healthcare Support | 0 (0.0%) | 6 (100.0%) |
| Security & Protection | 0 (0.0%) | 0 (0.0%) |
| Firefighting & Prevention | 0 (0.0%) | 0 (0.0%) |
| Law Enforcement | 0 (0.0%) | 0 (0.0%) |
| Food Preparation & Serving | 6 (100.0%) | 0 (0.0%) |
| Cleaning & Maintenance | 0 (0.0%) | 0 (0.0%) |
| Personal Care & Service | 0 (0.0%) | 0 (0.0%) |
| Total (Category) | 6 (50.0%) | 6 (50.0%) |
| Total (Overall) | 93 (75.6%) | 30 (24.4%) |
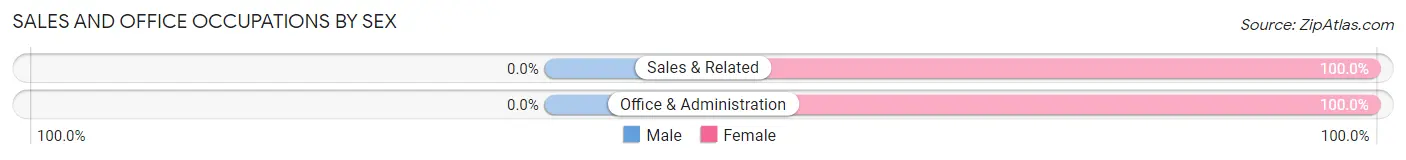
Sales and Office Occupations
The most common Sales and Office occupations in Zihlman are Sales & Related (8 | 6.5%), and Office & Administration (4 | 3.3%).
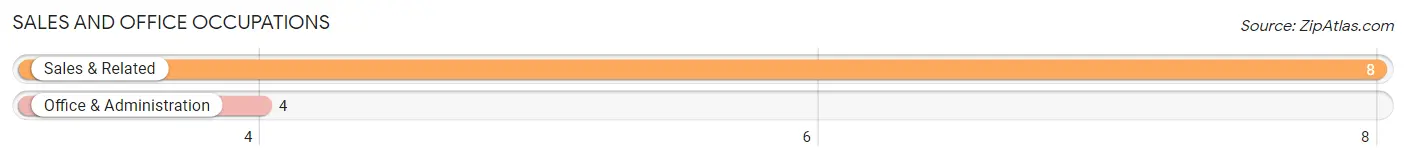
Sales and Office Occupations by Sex
| Occupation | Male | Female |
| Sales & Related | 0 (0.0%) | 8 (100.0%) |
| Office & Administration | 0 (0.0%) | 4 (100.0%) |
| Total (Category) | 0 (0.0%) | 12 (100.0%) |
| Total (Overall) | 93 (75.6%) | 30 (24.4%) |
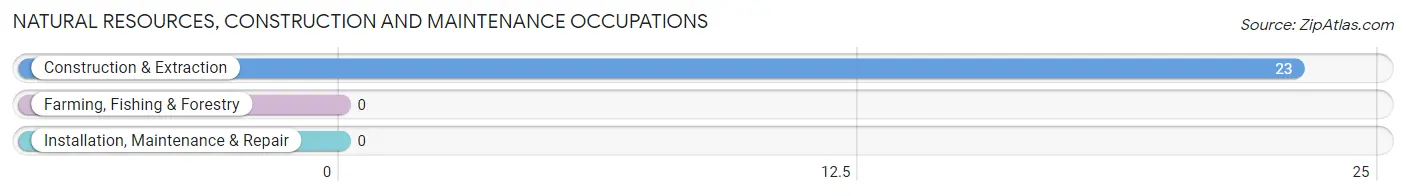
Natural Resources, Construction and Maintenance Occupations
The most common Natural Resources, Construction and Maintenance occupations in Zihlman are , and Construction & Extraction (23 | 18.7%).
Natural Resources, Construction and Maintenance Occupations by Sex
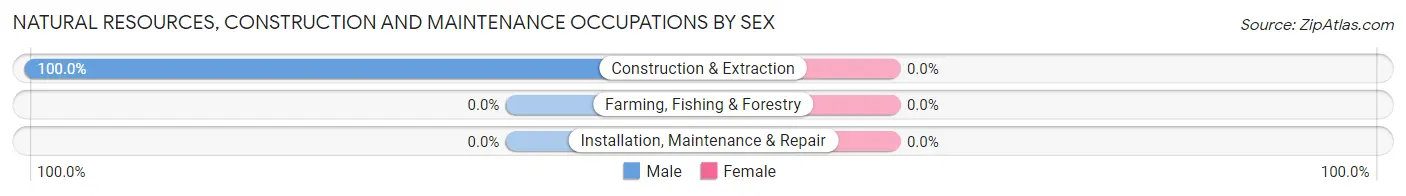
| Occupation | Male | Female |
| Farming, Fishing & Forestry | 0 (0.0%) | 0 (0.0%) |
| Construction & Extraction | 23 (100.0%) | 0 (0.0%) |
| Installation, Maintenance & Repair | 0 (0.0%) | 0 (0.0%) |
| Total (Category) | 23 (100.0%) | 0 (0.0%) |
| Total (Overall) | 93 (75.6%) | 30 (24.4%) |
Production, Transportation and Moving Occupations
The most common Production, Transportation and Moving occupations in Zihlman are , and Production (6 | 4.9%).
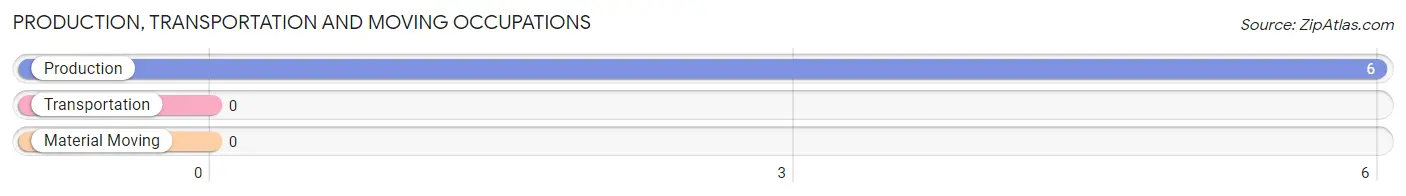
Production, Transportation and Moving Occupations by Sex
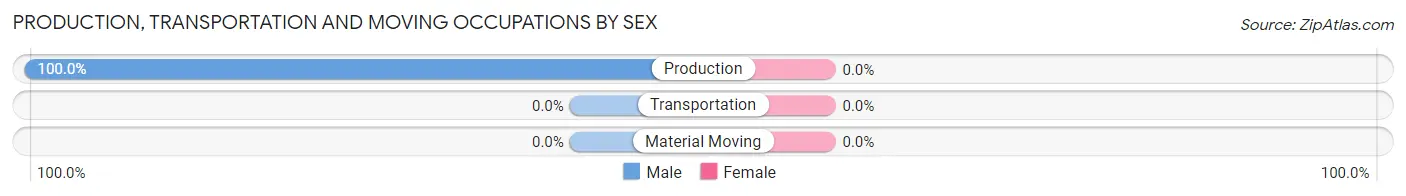
| Occupation | Male | Female |
| Production | 6 (100.0%) | 0 (0.0%) |
| Transportation | 0 (0.0%) | 0 (0.0%) |
| Material Moving | 0 (0.0%) | 0 (0.0%) |
| Total (Category) | 6 (100.0%) | 0 (0.0%) |
| Total (Overall) | 93 (75.6%) | 30 (24.4%) |
Employment Industries by Sex in Zihlman
Employment Industries in Zihlman
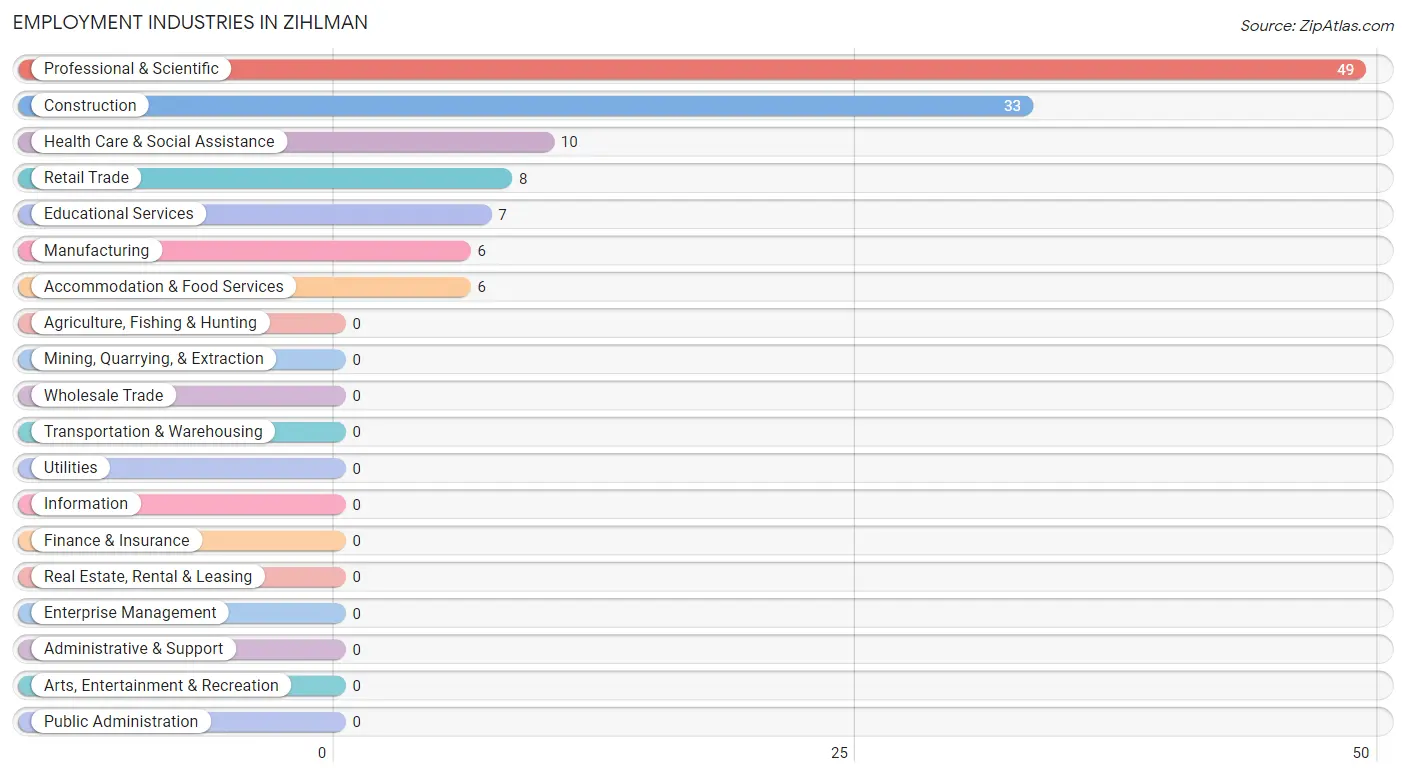
The major employment industries in Zihlman include Professional & Scientific (49 | 39.8%), Construction (33 | 26.8%), Health Care & Social Assistance (10 | 8.1%), Retail Trade (8 | 6.5%), and Educational Services (7 | 5.7%).
Employment Industries by Sex in Zihlman
The Zihlman industries that see more men than women are Construction (100.0%), Manufacturing (100.0%), and Educational Services (100.0%), whereas the industries that tend to have a higher number of women are Retail Trade (100.0%), Health Care & Social Assistance (100.0%), and Professional & Scientific (16.3%).
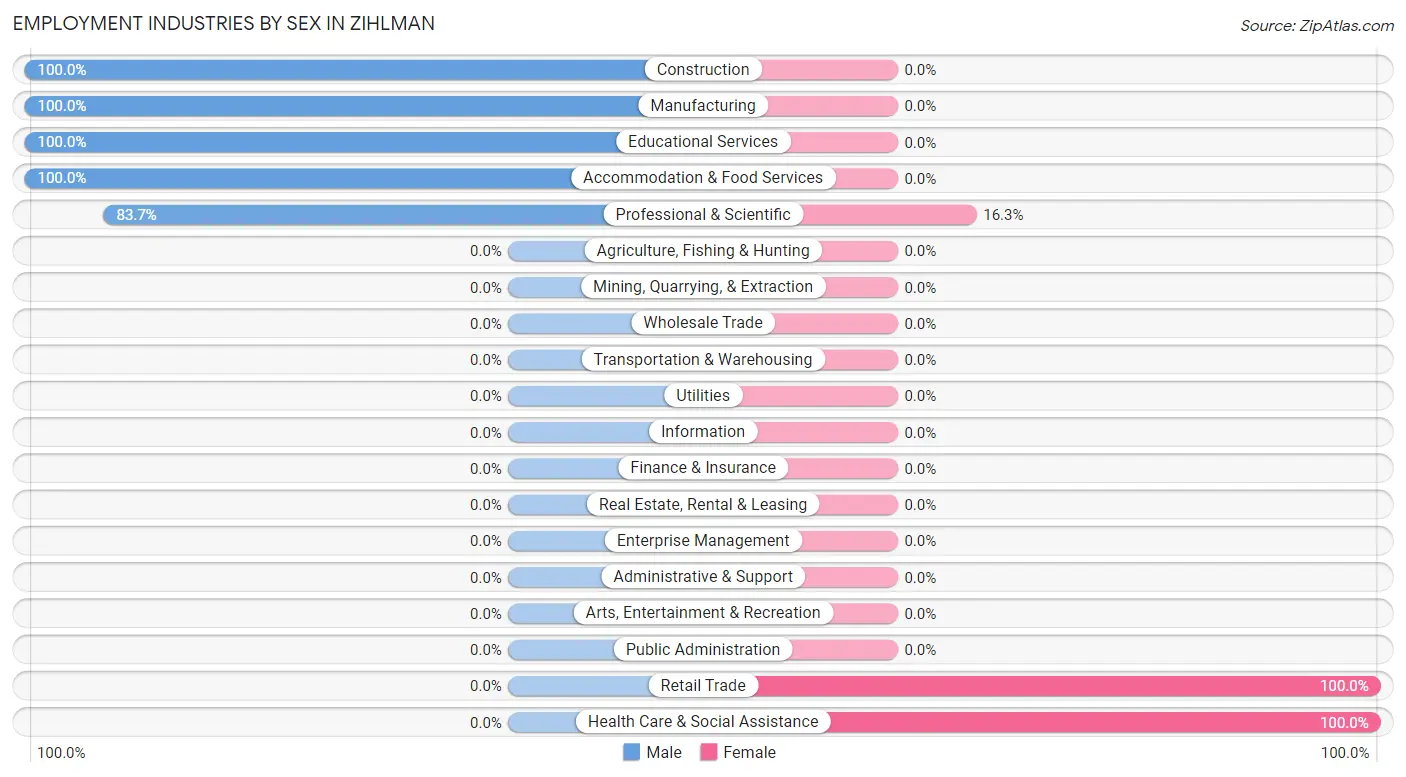
| Industry | Male | Female |
| Agriculture, Fishing & Hunting | 0 (0.0%) | 0 (0.0%) |
| Mining, Quarrying, & Extraction | 0 (0.0%) | 0 (0.0%) |
| Construction | 33 (100.0%) | 0 (0.0%) |
| Manufacturing | 6 (100.0%) | 0 (0.0%) |
| Wholesale Trade | 0 (0.0%) | 0 (0.0%) |
| Retail Trade | 0 (0.0%) | 8 (100.0%) |
| Transportation & Warehousing | 0 (0.0%) | 0 (0.0%) |
| Utilities | 0 (0.0%) | 0 (0.0%) |
| Information | 0 (0.0%) | 0 (0.0%) |
| Finance & Insurance | 0 (0.0%) | 0 (0.0%) |
| Real Estate, Rental & Leasing | 0 (0.0%) | 0 (0.0%) |
| Professional & Scientific | 41 (83.7%) | 8 (16.3%) |
| Enterprise Management | 0 (0.0%) | 0 (0.0%) |
| Administrative & Support | 0 (0.0%) | 0 (0.0%) |
| Educational Services | 7 (100.0%) | 0 (0.0%) |
| Health Care & Social Assistance | 0 (0.0%) | 10 (100.0%) |
| Arts, Entertainment & Recreation | 0 (0.0%) | 0 (0.0%) |
| Accommodation & Food Services | 6 (100.0%) | 0 (0.0%) |
| Public Administration | 0 (0.0%) | 0 (0.0%) |
| Total | 93 (75.6%) | 30 (24.4%) |
Education in Zihlman
School Enrollment in Zihlman
The most common levels of schooling among the 49 students in Zihlman are high school (22 | 44.9%), middle school (19 | 38.8%), and kindergarten (8 | 16.3%).
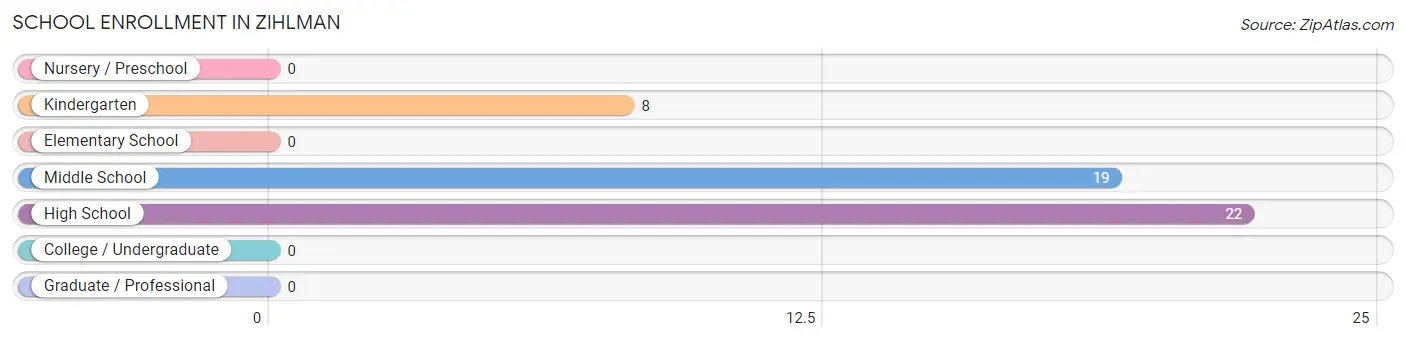
| School Level | # Students | % Students |
| Nursery / Preschool | 0 | 0.0% |
| Kindergarten | 8 | 16.3% |
| Elementary School | 0 | 0.0% |
| Middle School | 19 | 38.8% |
| High School | 22 | 44.9% |
| College / Undergraduate | 0 | 0.0% |
| Graduate / Professional | 0 | 0.0% |
| Total | 49 | 100.0% |
School Enrollment by Age by Funding Source in Zihlman
Out of a total of 49 students who are enrolled in schools in Zihlman, 16 (32.7%) attend a private institution, while the remaining 33 (67.3%) are enrolled in public schools. The age group of 15 to 17 year olds has the highest likelihood of being enrolled in private schools, with 16 (100.0% in the age bracket) enrolled. Conversely, the age group of 5 to 9 year old has the lowest likelihood of being enrolled in a private school, with 8 (100.0% in the age bracket) attending a public institution.
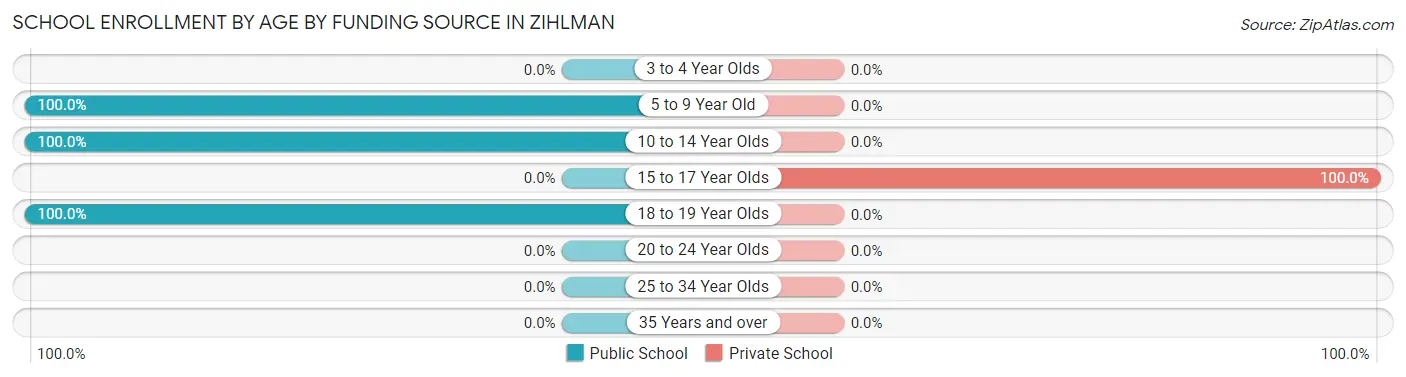
| Age Bracket | Public School | Private School |
| 3 to 4 Year Olds | 0 (0.0%) | 0 (0.0%) |
| 5 to 9 Year Old | 8 (100.0%) | 0 (0.0%) |
| 10 to 14 Year Olds | 19 (100.0%) | 0 (0.0%) |
| 15 to 17 Year Olds | 0 (0.0%) | 16 (100.0%) |
| 18 to 19 Year Olds | 6 (100.0%) | 0 (0.0%) |
| 20 to 24 Year Olds | 0 (0.0%) | 0 (0.0%) |
| 25 to 34 Year Olds | 0 (0.0%) | 0 (0.0%) |
| 35 Years and over | 0 (0.0%) | 0 (0.0%) |
| Total | 33 (67.3%) | 16 (32.7%) |
Educational Attainment by Field of Study in Zihlman
Social sciences (34 | 55.7%), computers & mathematics (12 | 19.7%), business (8 | 13.1%), and visual & performing arts (7 | 11.5%) are the most common fields of study among 61 individuals in Zihlman who have obtained a bachelor's degree or higher.
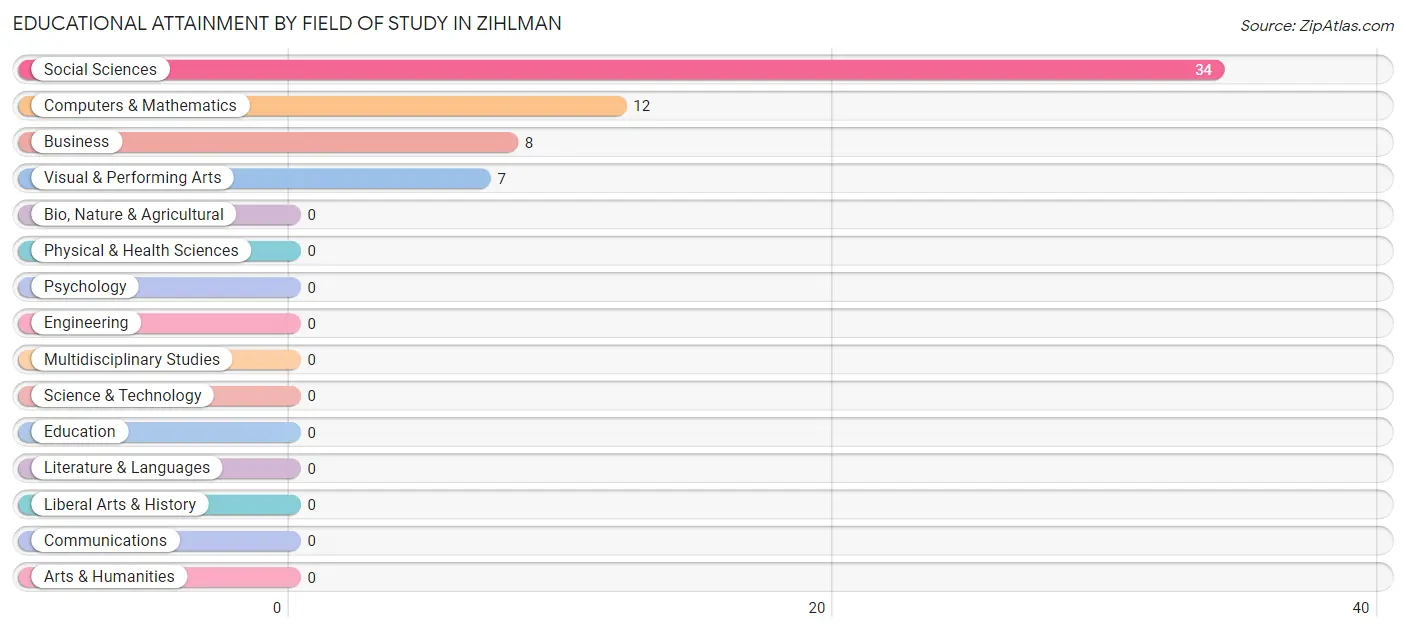
| Field of Study | # Graduates | % Graduates |
| Computers & Mathematics | 12 | 19.7% |
| Bio, Nature & Agricultural | 0 | 0.0% |
| Physical & Health Sciences | 0 | 0.0% |
| Psychology | 0 | 0.0% |
| Social Sciences | 34 | 55.7% |
| Engineering | 0 | 0.0% |
| Multidisciplinary Studies | 0 | 0.0% |
| Science & Technology | 0 | 0.0% |
| Business | 8 | 13.1% |
| Education | 0 | 0.0% |
| Literature & Languages | 0 | 0.0% |
| Liberal Arts & History | 0 | 0.0% |
| Visual & Performing Arts | 7 | 11.5% |
| Communications | 0 | 0.0% |
| Arts & Humanities | 0 | 0.0% |
| Total | 61 | 100.0% |
Transportation & Commute in Zihlman
Vehicle Availability by Sex in Zihlman
The most prevalent vehicle ownership categories in Zihlman are males with no vehicle (29, accounting for 31.2%) and females with no vehicle (8, making up 96.7%).
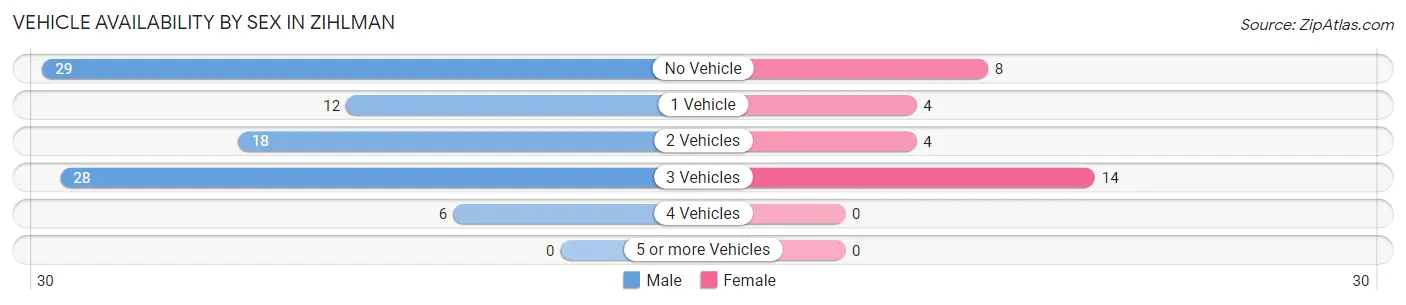
| Vehicles Available | Male | Female |
| No Vehicle | 29 (31.2%) | 8 (26.7%) |
| 1 Vehicle | 12 (12.9%) | 4 (13.3%) |
| 2 Vehicles | 18 (19.4%) | 4 (13.3%) |
| 3 Vehicles | 28 (30.1%) | 14 (46.7%) |
| 4 Vehicles | 6 (6.5%) | 0 (0.0%) |
| 5 or more Vehicles | 0 (0.0%) | 0 (0.0%) |
| Total | 93 (100.0%) | 30 (100.0%) |
Commute Time in Zihlman
The most frequently occuring commute durations in Zihlman are 15 to 19 minutes (28 commuters, 34.2%), 60 to 89 minutes (18 commuters, 22.0%), and 90 or more minutes (11 commuters, 13.4%).
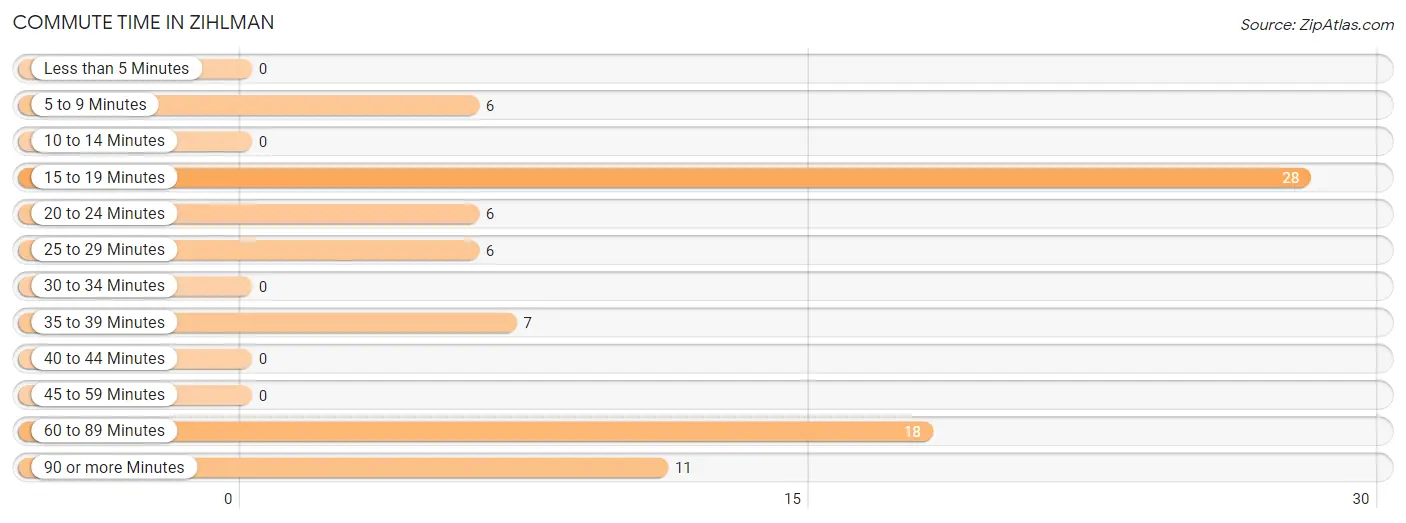
| Commute Time | # Commuters | % Commuters |
| Less than 5 Minutes | 0 | 0.0% |
| 5 to 9 Minutes | 6 | 7.3% |
| 10 to 14 Minutes | 0 | 0.0% |
| 15 to 19 Minutes | 28 | 34.2% |
| 20 to 24 Minutes | 6 | 7.3% |
| 25 to 29 Minutes | 6 | 7.3% |
| 30 to 34 Minutes | 0 | 0.0% |
| 35 to 39 Minutes | 7 | 8.5% |
| 40 to 44 Minutes | 0 | 0.0% |
| 45 to 59 Minutes | 0 | 0.0% |
| 60 to 89 Minutes | 18 | 22.0% |
| 90 or more Minutes | 11 | 13.4% |
Commute Time by Sex in Zihlman
The most common commute times in Zihlman are 15 to 19 minutes (12 commuters, 23.1%) for males and 15 to 19 minutes (16 commuters, 53.3%) for females.
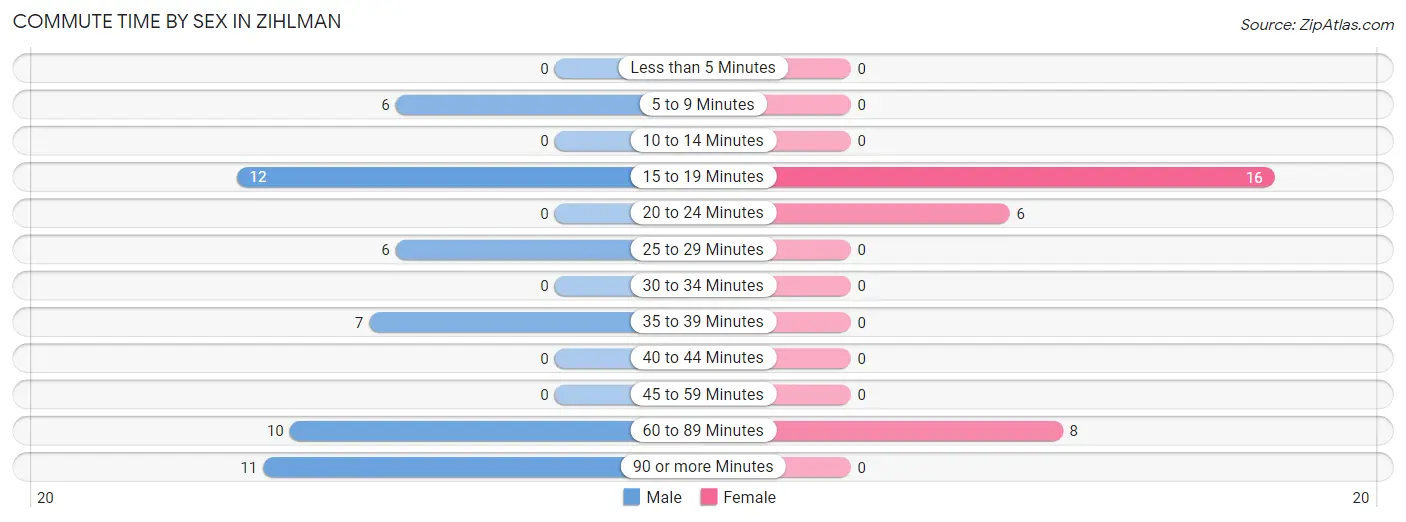
| Commute Time | Male | Female |
| Less than 5 Minutes | 0 (0.0%) | 0 (0.0%) |
| 5 to 9 Minutes | 6 (11.5%) | 0 (0.0%) |
| 10 to 14 Minutes | 0 (0.0%) | 0 (0.0%) |
| 15 to 19 Minutes | 12 (23.1%) | 16 (53.3%) |
| 20 to 24 Minutes | 0 (0.0%) | 6 (20.0%) |
| 25 to 29 Minutes | 6 (11.5%) | 0 (0.0%) |
| 30 to 34 Minutes | 0 (0.0%) | 0 (0.0%) |
| 35 to 39 Minutes | 7 (13.5%) | 0 (0.0%) |
| 40 to 44 Minutes | 0 (0.0%) | 0 (0.0%) |
| 45 to 59 Minutes | 0 (0.0%) | 0 (0.0%) |
| 60 to 89 Minutes | 10 (19.2%) | 8 (26.7%) |
| 90 or more Minutes | 11 (21.1%) | 0 (0.0%) |
Time of Departure to Work by Sex in Zihlman
The most frequent times of departure to work in Zihlman are 7:00 AM to 7:29 AM (12, 23.1%) for males and 8:30 AM to 8:59 AM (8, 26.7%) for females.
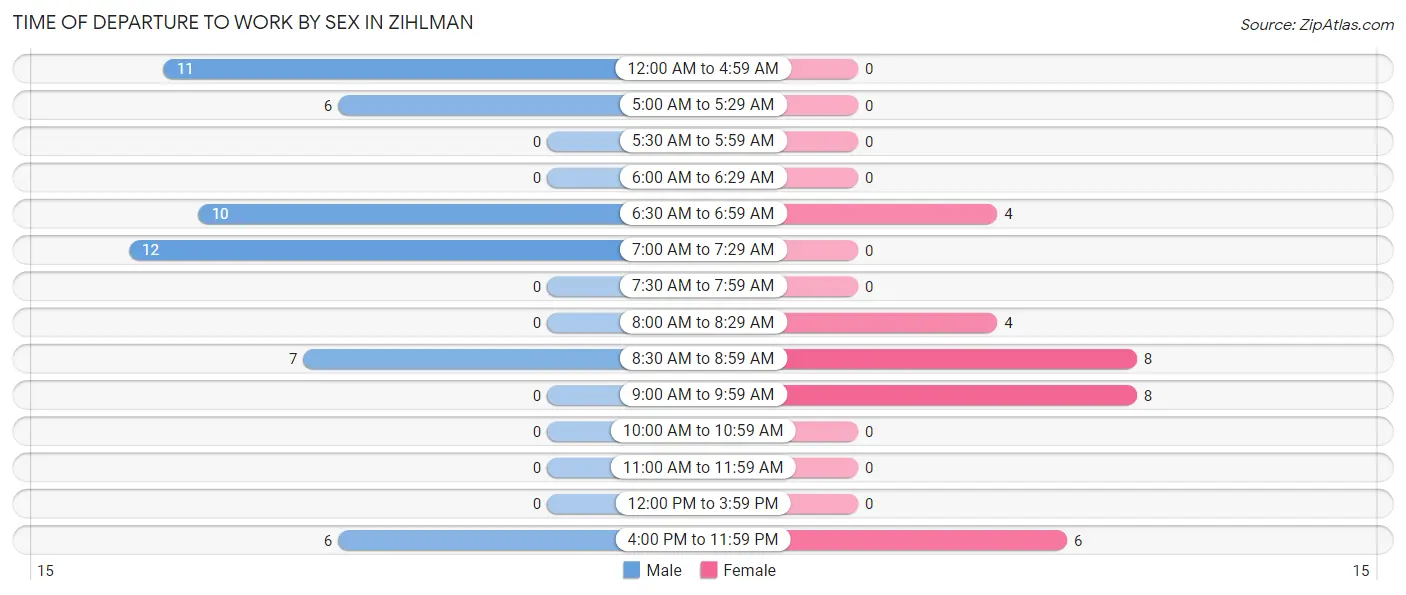
| Time of Departure | Male | Female |
| 12:00 AM to 4:59 AM | 11 (21.1%) | 0 (0.0%) |
| 5:00 AM to 5:29 AM | 6 (11.5%) | 0 (0.0%) |
| 5:30 AM to 5:59 AM | 0 (0.0%) | 0 (0.0%) |
| 6:00 AM to 6:29 AM | 0 (0.0%) | 0 (0.0%) |
| 6:30 AM to 6:59 AM | 10 (19.2%) | 4 (13.3%) |
| 7:00 AM to 7:29 AM | 12 (23.1%) | 0 (0.0%) |
| 7:30 AM to 7:59 AM | 0 (0.0%) | 0 (0.0%) |
| 8:00 AM to 8:29 AM | 0 (0.0%) | 4 (13.3%) |
| 8:30 AM to 8:59 AM | 7 (13.5%) | 8 (26.7%) |
| 9:00 AM to 9:59 AM | 0 (0.0%) | 8 (26.7%) |
| 10:00 AM to 10:59 AM | 0 (0.0%) | 0 (0.0%) |
| 11:00 AM to 11:59 AM | 0 (0.0%) | 0 (0.0%) |
| 12:00 PM to 3:59 PM | 0 (0.0%) | 0 (0.0%) |
| 4:00 PM to 11:59 PM | 6 (11.5%) | 6 (20.0%) |
| Total | 52 (100.0%) | 30 (100.0%) |
Housing Occupancy in Zihlman
Occupancy by Ownership in Zihlman
Of the total 157 dwellings in Zihlman, owner-occupied units account for 120 (76.4%), while renter-occupied units make up 37 (23.6%).
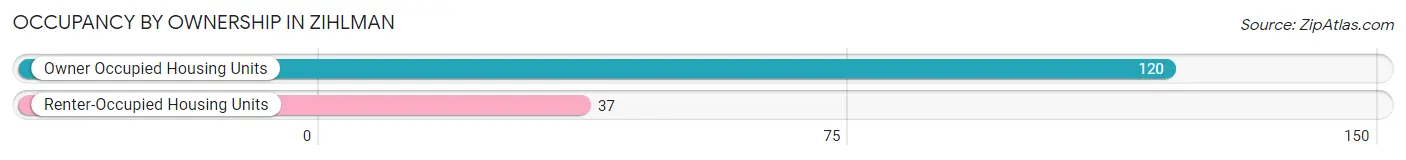
| Occupancy | # Housing Units | % Housing Units |
| Owner Occupied Housing Units | 120 | 76.4% |
| Renter-Occupied Housing Units | 37 | 23.6% |
| Total Occupied Housing Units | 157 | 100.0% |
Occupancy by Household Size in Zihlman
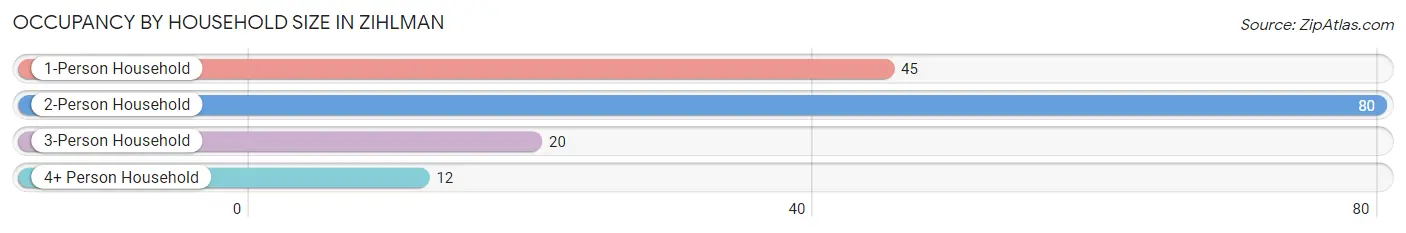
| Household Size | # Housing Units | % Housing Units |
| 1-Person Household | 45 | 28.7% |
| 2-Person Household | 80 | 51.0% |
| 3-Person Household | 20 | 12.7% |
| 4+ Person Household | 12 | 7.6% |
| Total Housing Units | 157 | 100.0% |
Occupancy by Ownership by Household Size in Zihlman
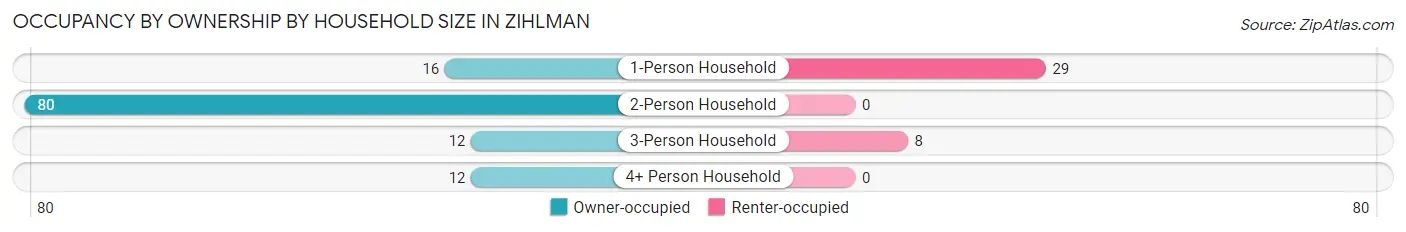
| Household Size | Owner-occupied | Renter-occupied |
| 1-Person Household | 16 (35.6%) | 29 (64.4%) |
| 2-Person Household | 80 (100.0%) | 0 (0.0%) |
| 3-Person Household | 12 (60.0%) | 8 (40.0%) |
| 4+ Person Household | 12 (100.0%) | 0 (0.0%) |
| Total Housing Units | 120 (76.4%) | 37 (23.6%) |
Occupancy by Educational Attainment in Zihlman
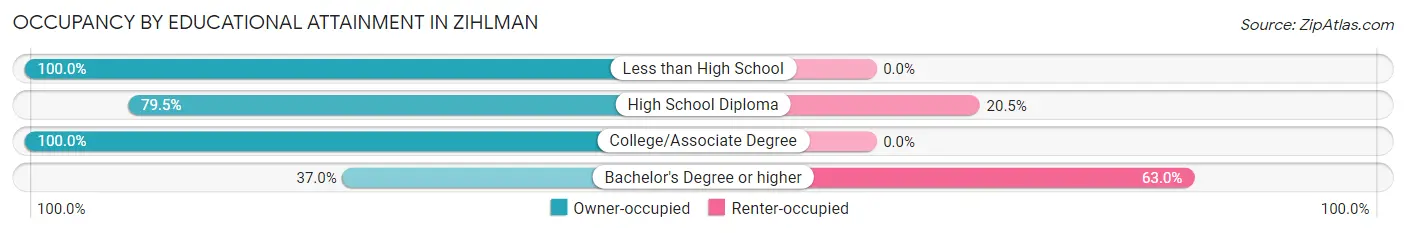
| Household Size | Owner-occupied | Renter-occupied |
| Less than High School | 27 (100.0%) | 0 (0.0%) |
| High School Diploma | 31 (79.5%) | 8 (20.5%) |
| College/Associate Degree | 45 (100.0%) | 0 (0.0%) |
| Bachelor's Degree or higher | 17 (37.0%) | 29 (63.0%) |
Occupancy by Age of Householder in Zihlman
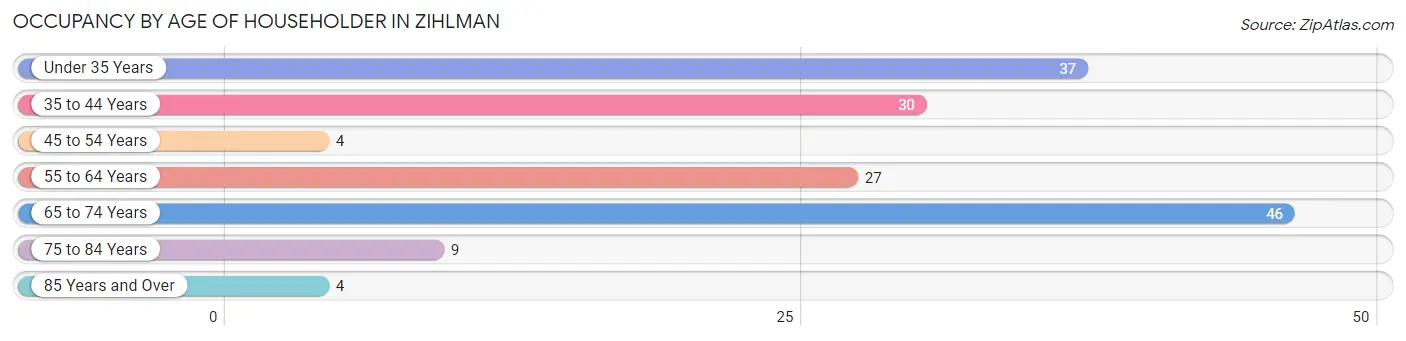
| Age Bracket | # Households | % Households |
| Under 35 Years | 37 | 23.6% |
| 35 to 44 Years | 30 | 19.1% |
| 45 to 54 Years | 4 | 2.5% |
| 55 to 64 Years | 27 | 17.2% |
| 65 to 74 Years | 46 | 29.3% |
| 75 to 84 Years | 9 | 5.7% |
| 85 Years and Over | 4 | 2.5% |
| Total | 157 | 100.0% |
Housing Finances in Zihlman
Median Income by Occupancy in Zihlman
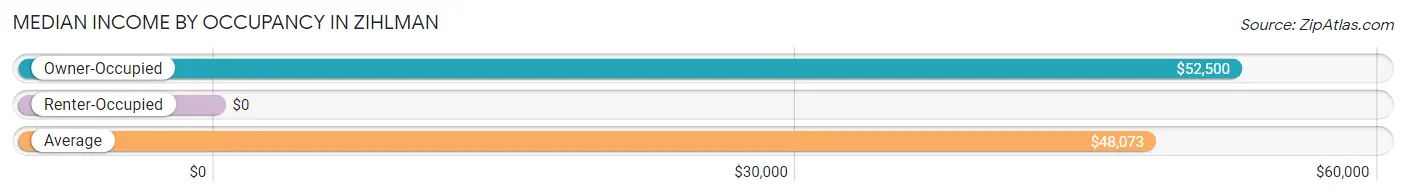
| Occupancy Type | # Households | Median Income |
| Owner-Occupied | 120 (76.4%) | $52,500 |
| Renter-Occupied | 37 (23.6%) | $0 |
| Average | 157 (100.0%) | $48,073 |
Occupancy by Householder Income Bracket in Zihlman
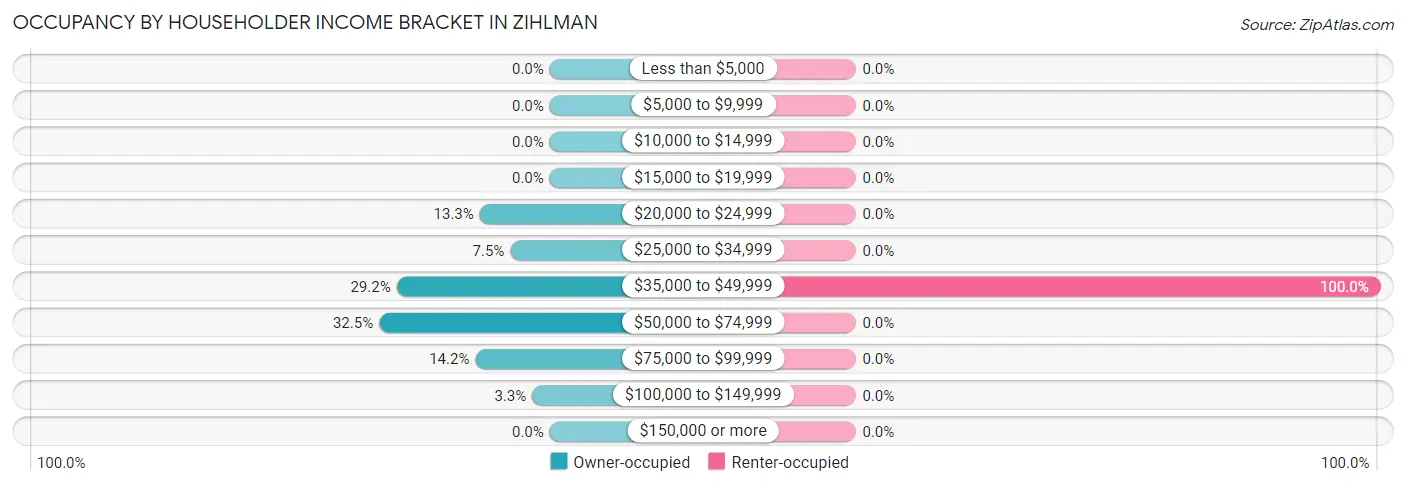
| Income Bracket | Owner-occupied | Renter-occupied |
| Less than $5,000 | 0 (0.0%) | 0 (0.0%) |
| $5,000 to $9,999 | 0 (0.0%) | 0 (0.0%) |
| $10,000 to $14,999 | 0 (0.0%) | 0 (0.0%) |
| $15,000 to $19,999 | 0 (0.0%) | 0 (0.0%) |
| $20,000 to $24,999 | 16 (13.3%) | 0 (0.0%) |
| $25,000 to $34,999 | 9 (7.5%) | 0 (0.0%) |
| $35,000 to $49,999 | 35 (29.2%) | 37 (100.0%) |
| $50,000 to $74,999 | 39 (32.5%) | 0 (0.0%) |
| $75,000 to $99,999 | 17 (14.2%) | 0 (0.0%) |
| $100,000 to $149,999 | 4 (3.3%) | 0 (0.0%) |
| $150,000 or more | 0 (0.0%) | 0 (0.0%) |
| Total | 120 (100.0%) | 37 (100.0%) |
Monthly Housing Cost Tiers in Zihlman
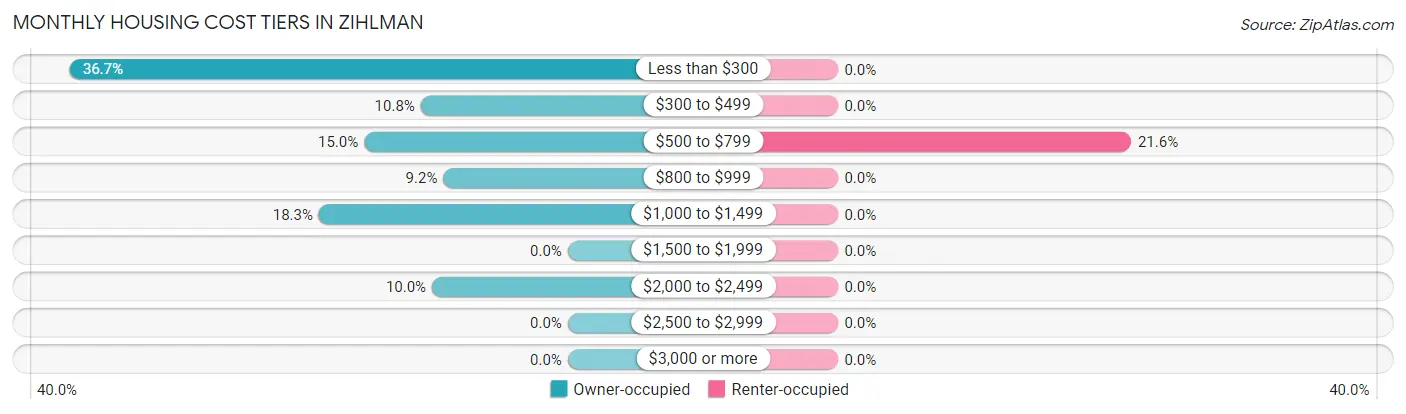
| Monthly Cost | Owner-occupied | Renter-occupied |
| Less than $300 | 44 (36.7%) | 0 (0.0%) |
| $300 to $499 | 13 (10.8%) | 0 (0.0%) |
| $500 to $799 | 18 (15.0%) | 8 (21.6%) |
| $800 to $999 | 11 (9.2%) | 0 (0.0%) |
| $1,000 to $1,499 | 22 (18.3%) | 0 (0.0%) |
| $1,500 to $1,999 | 0 (0.0%) | 0 (0.0%) |
| $2,000 to $2,499 | 12 (10.0%) | 0 (0.0%) |
| $2,500 to $2,999 | 0 (0.0%) | 0 (0.0%) |
| $3,000 or more | 0 (0.0%) | 0 (0.0%) |
| Total | 120 (100.0%) | 37 (100.0%) |
Physical Housing Characteristics in Zihlman
Housing Structures in Zihlman
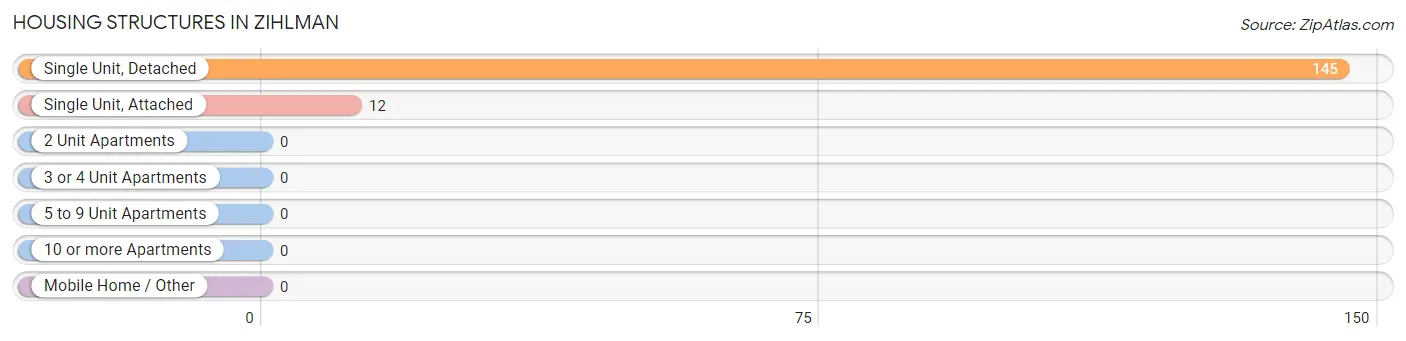
| Structure Type | # Housing Units | % Housing Units |
| Single Unit, Detached | 145 | 92.4% |
| Single Unit, Attached | 12 | 7.6% |
| 2 Unit Apartments | 0 | 0.0% |
| 3 or 4 Unit Apartments | 0 | 0.0% |
| 5 to 9 Unit Apartments | 0 | 0.0% |
| 10 or more Apartments | 0 | 0.0% |
| Mobile Home / Other | 0 | 0.0% |
| Total | 157 | 100.0% |
Housing Structures by Occupancy in Zihlman
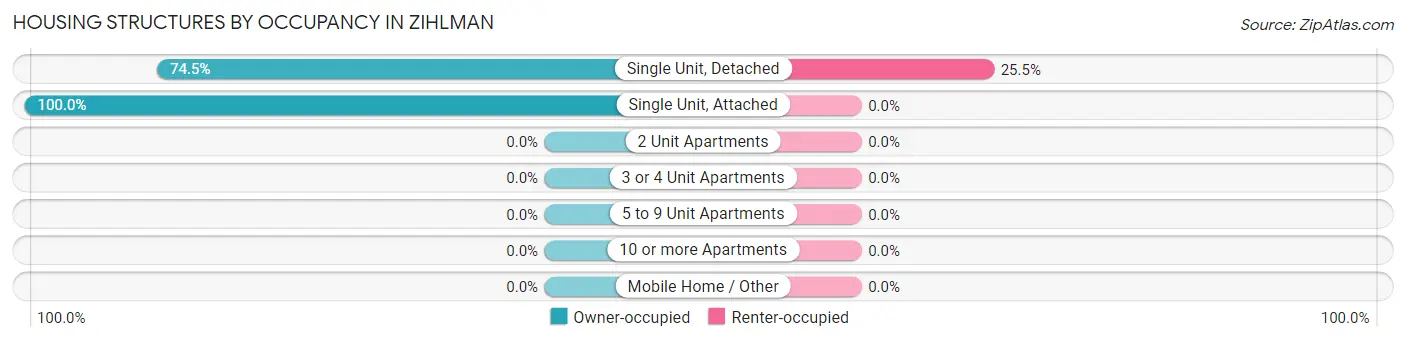
| Structure Type | Owner-occupied | Renter-occupied |
| Single Unit, Detached | 108 (74.5%) | 37 (25.5%) |
| Single Unit, Attached | 12 (100.0%) | 0 (0.0%) |
| 2 Unit Apartments | 0 (0.0%) | 0 (0.0%) |
| 3 or 4 Unit Apartments | 0 (0.0%) | 0 (0.0%) |
| 5 to 9 Unit Apartments | 0 (0.0%) | 0 (0.0%) |
| 10 or more Apartments | 0 (0.0%) | 0 (0.0%) |
| Mobile Home / Other | 0 (0.0%) | 0 (0.0%) |
| Total | 120 (76.4%) | 37 (23.6%) |
Housing Structures by Number of Rooms in Zihlman
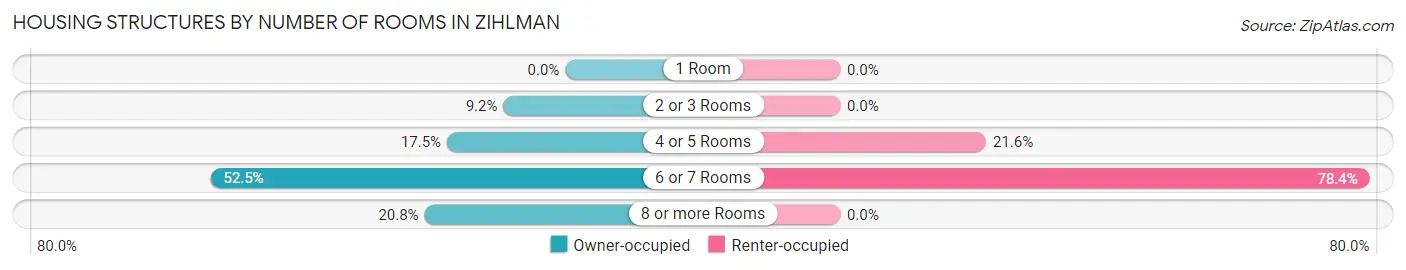
| Number of Rooms | Owner-occupied | Renter-occupied |
| 1 Room | 0 (0.0%) | 0 (0.0%) |
| 2 or 3 Rooms | 11 (9.2%) | 0 (0.0%) |
| 4 or 5 Rooms | 21 (17.5%) | 8 (21.6%) |
| 6 or 7 Rooms | 63 (52.5%) | 29 (78.4%) |
| 8 or more Rooms | 25 (20.8%) | 0 (0.0%) |
| Total | 120 (100.0%) | 37 (100.0%) |
Housing Structure by Heating Type in Zihlman
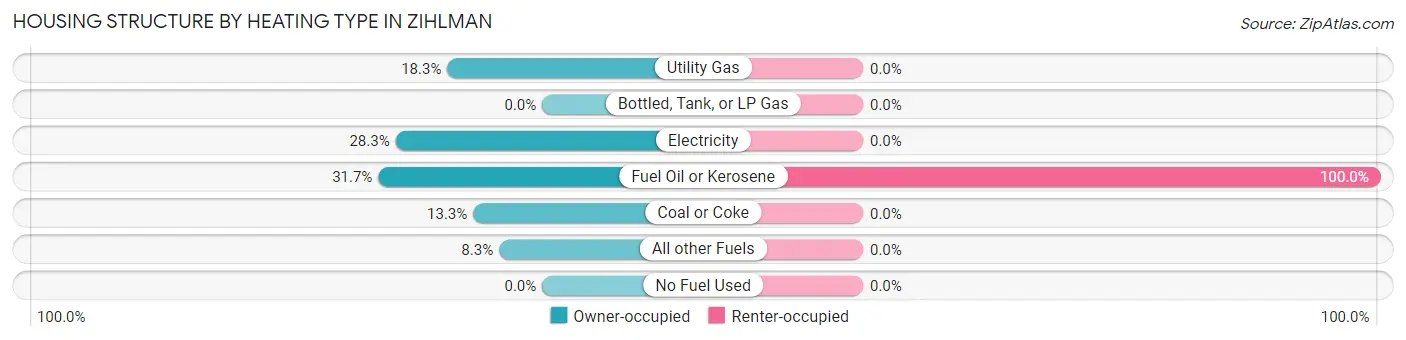
| Heating Type | Owner-occupied | Renter-occupied |
| Utility Gas | 22 (18.3%) | 0 (0.0%) |
| Bottled, Tank, or LP Gas | 0 (0.0%) | 0 (0.0%) |
| Electricity | 34 (28.3%) | 0 (0.0%) |
| Fuel Oil or Kerosene | 38 (31.7%) | 37 (100.0%) |
| Coal or Coke | 16 (13.3%) | 0 (0.0%) |
| All other Fuels | 10 (8.3%) | 0 (0.0%) |
| No Fuel Used | 0 (0.0%) | 0 (0.0%) |
| Total | 120 (100.0%) | 37 (100.0%) |
Household Vehicle Usage in Zihlman
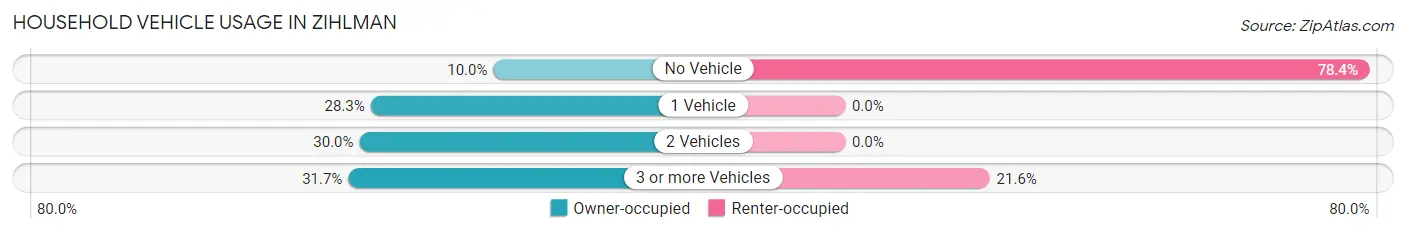
| Vehicles per Household | Owner-occupied | Renter-occupied |
| No Vehicle | 12 (10.0%) | 29 (78.4%) |
| 1 Vehicle | 34 (28.3%) | 0 (0.0%) |
| 2 Vehicles | 36 (30.0%) | 0 (0.0%) |
| 3 or more Vehicles | 38 (31.7%) | 8 (21.6%) |
| Total | 120 (100.0%) | 37 (100.0%) |
Real Estate & Mortgages in Zihlman
Real Estate and Mortgage Overview in Zihlman
| Characteristic | Without Mortgage | With Mortgage |
| Housing Units | 66 | 54 |
| Median Property Value | $70,000 | $0 |
| Median Household Income | $48,125 | $0 |
| Monthly Housing Costs | $288 | $0 |
| Real Estate Taxes | $543 | $0 |
Property Value by Mortgage Status in Zihlman
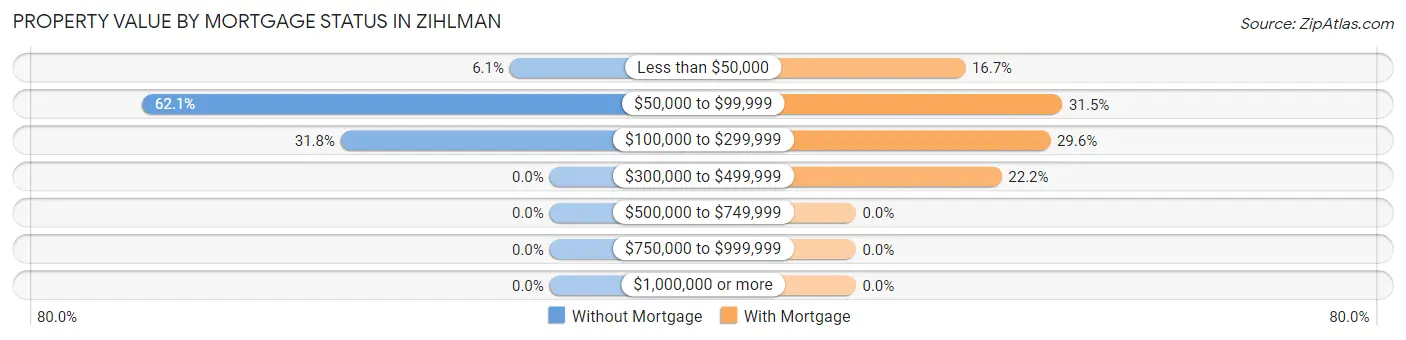
| Property Value | Without Mortgage | With Mortgage |
| Less than $50,000 | 4 (6.1%) | 9 (16.7%) |
| $50,000 to $99,999 | 41 (62.1%) | 17 (31.5%) |
| $100,000 to $299,999 | 21 (31.8%) | 16 (29.6%) |
| $300,000 to $499,999 | 0 (0.0%) | 12 (22.2%) |
| $500,000 to $749,999 | 0 (0.0%) | 0 (0.0%) |
| $750,000 to $999,999 | 0 (0.0%) | 0 (0.0%) |
| $1,000,000 or more | 0 (0.0%) | 0 (0.0%) |
| Total | 66 (100.0%) | 54 (100.0%) |
Household Income by Mortgage Status in Zihlman
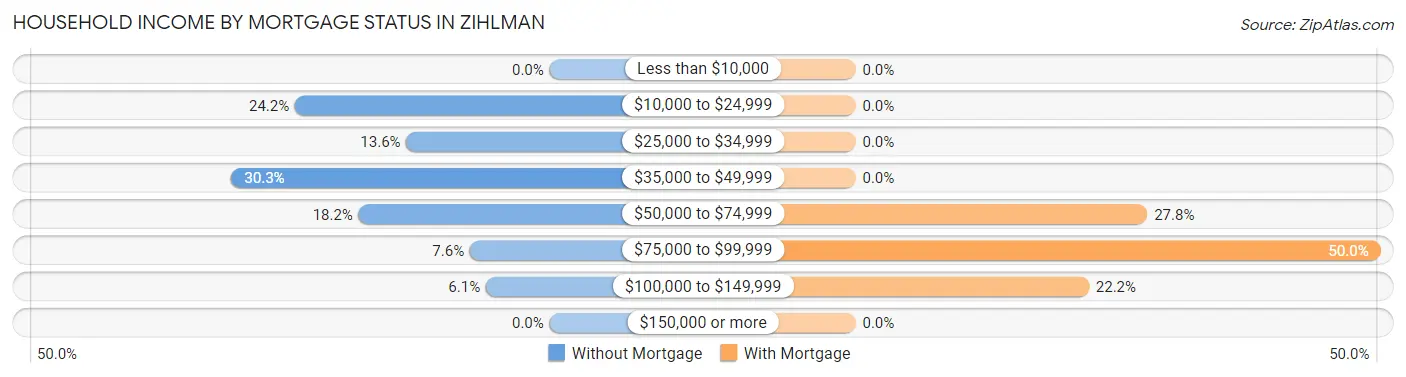
| Household Income | Without Mortgage | With Mortgage |
| Less than $10,000 | 0 (0.0%) | 0 (0.0%) |
| $10,000 to $24,999 | 16 (24.2%) | 0 (0.0%) |
| $25,000 to $34,999 | 9 (13.6%) | 0 (0.0%) |
| $35,000 to $49,999 | 20 (30.3%) | 0 (0.0%) |
| $50,000 to $74,999 | 12 (18.2%) | 15 (27.8%) |
| $75,000 to $99,999 | 5 (7.6%) | 27 (50.0%) |
| $100,000 to $149,999 | 4 (6.1%) | 12 (22.2%) |
| $150,000 or more | 0 (0.0%) | 0 (0.0%) |
| Total | 66 (100.0%) | 54 (100.0%) |
Property Value to Household Income Ratio in Zihlman
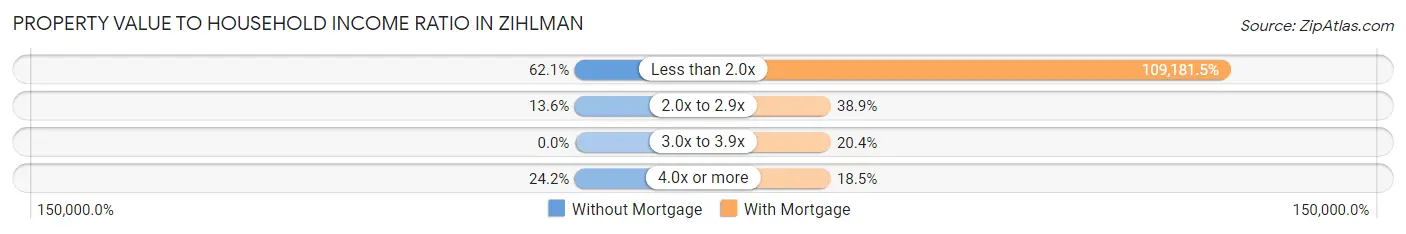
| Value-to-Income Ratio | Without Mortgage | With Mortgage |
| Less than 2.0x | 41 (62.1%) | 58,958 (109,181.5%) |
| 2.0x to 2.9x | 9 (13.6%) | 21 (38.9%) |
| 3.0x to 3.9x | 0 (0.0%) | 11 (20.4%) |
| 4.0x or more | 16 (24.2%) | 10 (18.5%) |
| Total | 66 (100.0%) | 54 (100.0%) |
Real Estate Taxes by Mortgage Status in Zihlman
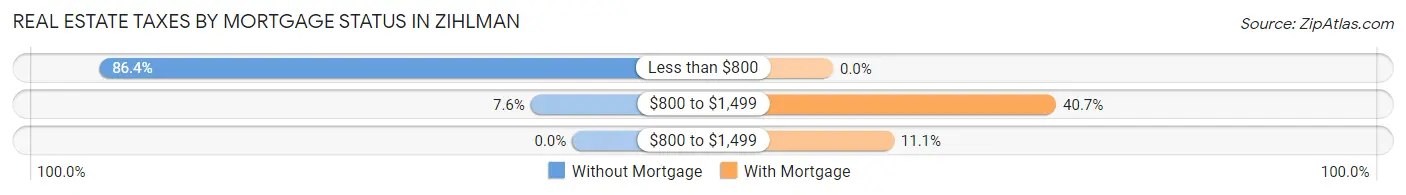
| Property Taxes | Without Mortgage | With Mortgage |
| Less than $800 | 57 (86.4%) | 0 (0.0%) |
| $800 to $1,499 | 5 (7.6%) | 22 (40.7%) |
| $800 to $1,499 | 0 (0.0%) | 6 (11.1%) |
| Total | 66 (100.0%) | 54 (100.0%) |
Health & Disability in Zihlman
Health Insurance Coverage by Age in Zihlman
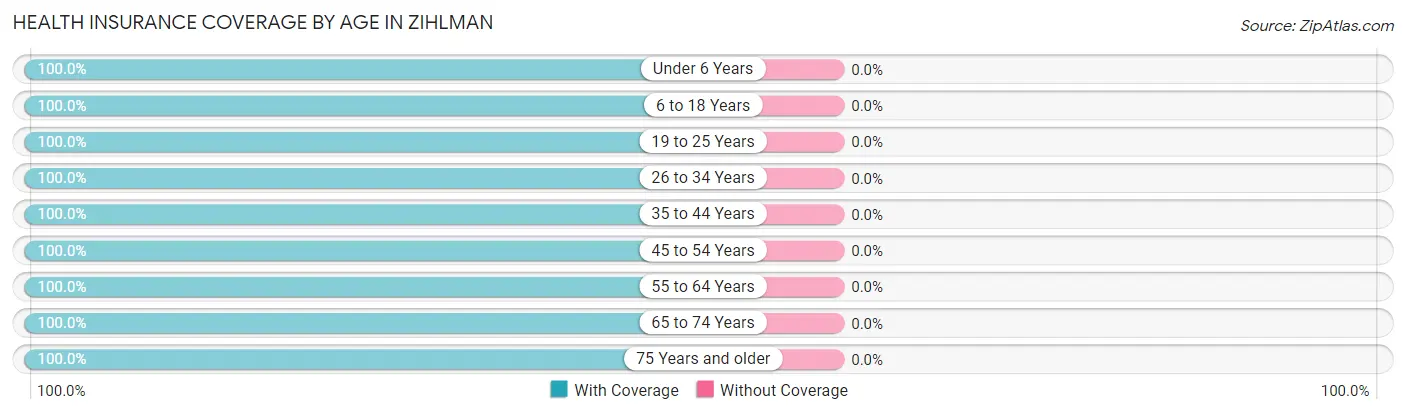
| Age Bracket | With Coverage | Without Coverage |
| Under 6 Years | 8 (100.0%) | 0 (0.0%) |
| 6 to 18 Years | 49 (100.0%) | 0 (0.0%) |
| 19 to 25 Years | 20 (100.0%) | 0 (0.0%) |
| 26 to 34 Years | 29 (100.0%) | 0 (0.0%) |
| 35 to 44 Years | 40 (100.0%) | 0 (0.0%) |
| 45 to 54 Years | 36 (100.0%) | 0 (0.0%) |
| 55 to 64 Years | 34 (100.0%) | 0 (0.0%) |
| 65 to 74 Years | 69 (100.0%) | 0 (0.0%) |
| 75 Years and older | 31 (100.0%) | 0 (0.0%) |
| Total | 316 (100.0%) | 0 (0.0%) |
Health Insurance Coverage by Citizenship Status in Zihlman
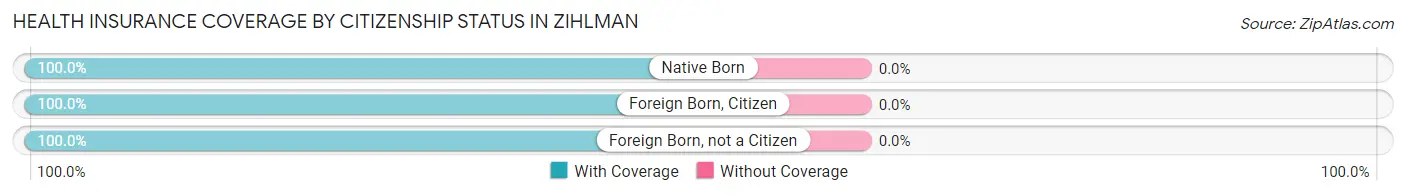
| Citizenship Status | With Coverage | Without Coverage |
| Native Born | 8 (100.0%) | 0 (0.0%) |
| Foreign Born, Citizen | 49 (100.0%) | 0 (0.0%) |
| Foreign Born, not a Citizen | 20 (100.0%) | 0 (0.0%) |
Health Insurance Coverage by Household Income in Zihlman
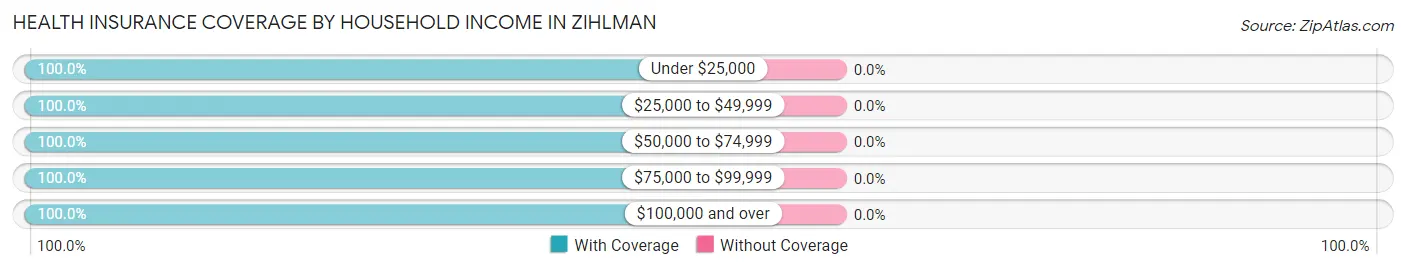
| Household Income | With Coverage | Without Coverage |
| Under $25,000 | 30 (100.0%) | 0 (0.0%) |
| $25,000 to $49,999 | 134 (100.0%) | 0 (0.0%) |
| $50,000 to $74,999 | 99 (100.0%) | 0 (0.0%) |
| $75,000 to $99,999 | 45 (100.0%) | 0 (0.0%) |
| $100,000 and over | 8 (100.0%) | 0 (0.0%) |
Public vs Private Health Insurance Coverage by Age in Zihlman
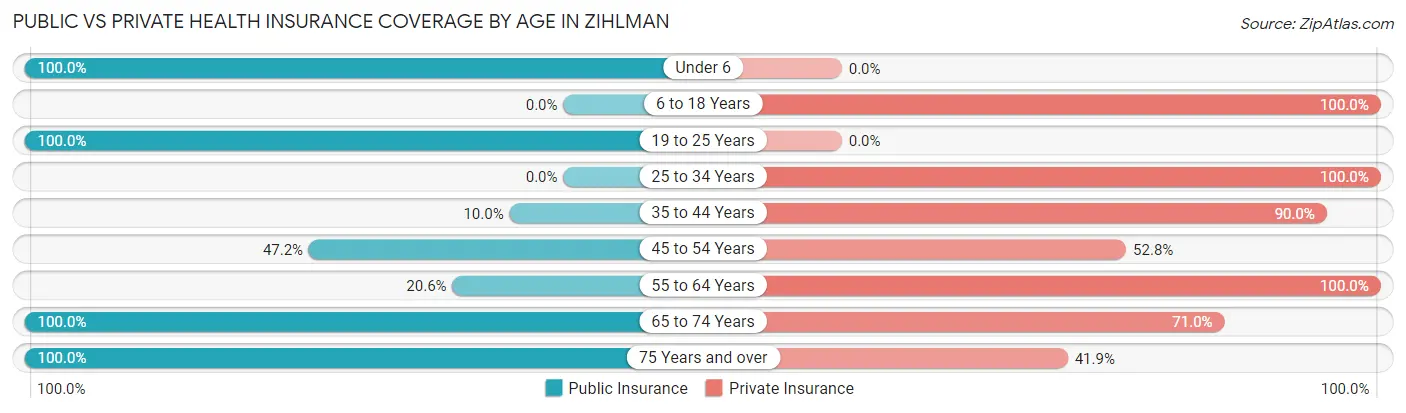
| Age Bracket | Public Insurance | Private Insurance |
| Under 6 | 8 (100.0%) | 0 (0.0%) |
| 6 to 18 Years | 0 (0.0%) | 49 (100.0%) |
| 19 to 25 Years | 20 (100.0%) | 0 (0.0%) |
| 25 to 34 Years | 0 (0.0%) | 29 (100.0%) |
| 35 to 44 Years | 4 (10.0%) | 36 (90.0%) |
| 45 to 54 Years | 17 (47.2%) | 19 (52.8%) |
| 55 to 64 Years | 7 (20.6%) | 34 (100.0%) |
| 65 to 74 Years | 69 (100.0%) | 49 (71.0%) |
| 75 Years and over | 31 (100.0%) | 13 (41.9%) |
| Total | 156 (49.4%) | 229 (72.5%) |
Disability Status by Sex by Age in Zihlman
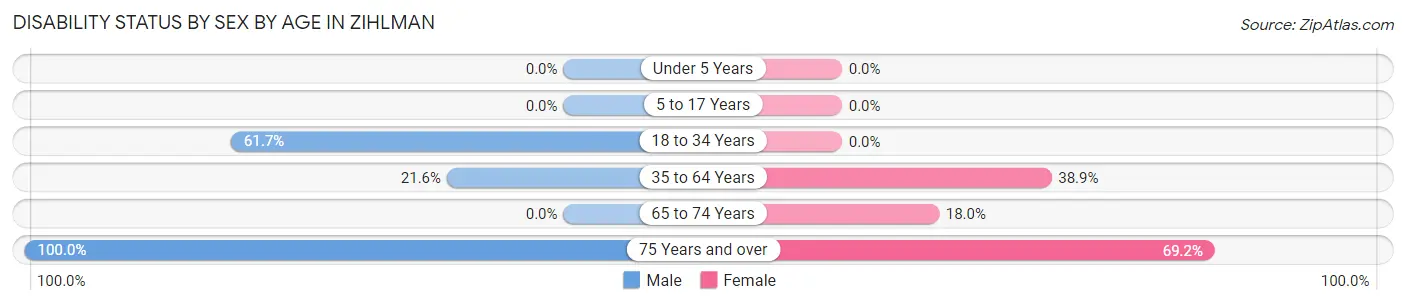
| Age Bracket | Male | Female |
| Under 5 Years | 0 (0.0%) | 0 (0.0%) |
| 5 to 17 Years | 0 (0.0%) | 0 (0.0%) |
| 18 to 34 Years | 29 (61.7%) | 0 (0.0%) |
| 35 to 64 Years | 16 (21.6%) | 14 (38.9%) |
| 65 to 74 Years | 0 (0.0%) | 9 (18.0%) |
| 75 Years and over | 18 (100.0%) | 9 (69.2%) |
Disability Class by Sex by Age in Zihlman
Disability Class: Hearing Difficulty
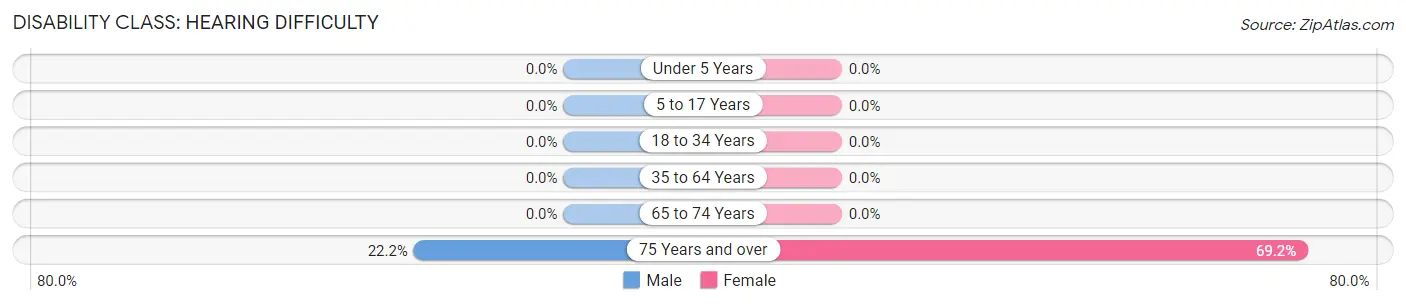
| Age Bracket | Male | Female |
| Under 5 Years | 0 (0.0%) | 0 (0.0%) |
| 5 to 17 Years | 0 (0.0%) | 0 (0.0%) |
| 18 to 34 Years | 0 (0.0%) | 0 (0.0%) |
| 35 to 64 Years | 0 (0.0%) | 0 (0.0%) |
| 65 to 74 Years | 0 (0.0%) | 0 (0.0%) |
| 75 Years and over | 4 (22.2%) | 9 (69.2%) |
Disability Class: Vision Difficulty
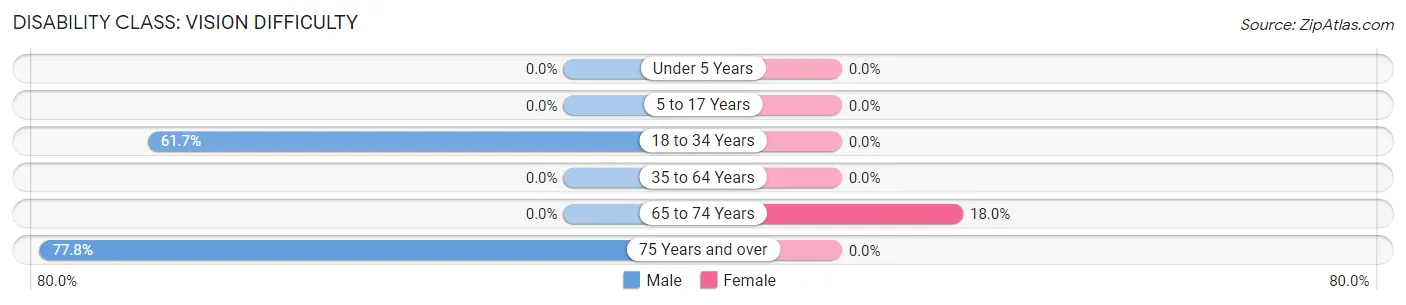
| Age Bracket | Male | Female |
| Under 5 Years | 0 (0.0%) | 0 (0.0%) |
| 5 to 17 Years | 0 (0.0%) | 0 (0.0%) |
| 18 to 34 Years | 29 (61.7%) | 0 (0.0%) |
| 35 to 64 Years | 0 (0.0%) | 0 (0.0%) |
| 65 to 74 Years | 0 (0.0%) | 9 (18.0%) |
| 75 Years and over | 14 (77.8%) | 0 (0.0%) |
Disability Class: Cognitive Difficulty
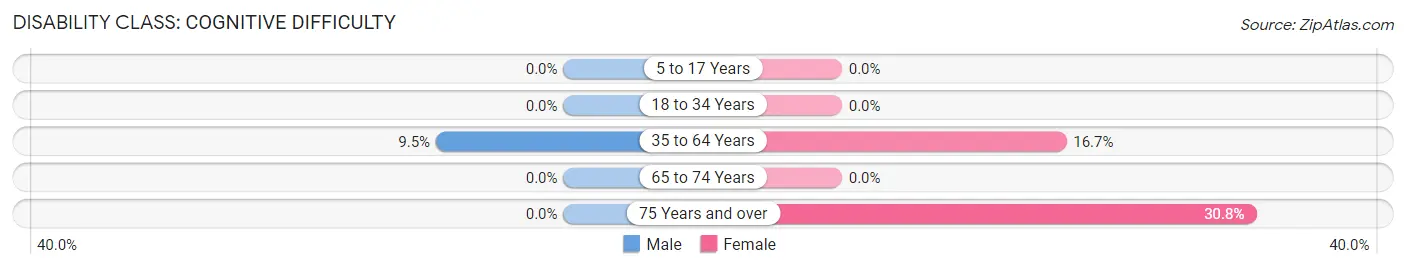
| Age Bracket | Male | Female |
| 5 to 17 Years | 0 (0.0%) | 0 (0.0%) |
| 18 to 34 Years | 0 (0.0%) | 0 (0.0%) |
| 35 to 64 Years | 7 (9.5%) | 6 (16.7%) |
| 65 to 74 Years | 0 (0.0%) | 0 (0.0%) |
| 75 Years and over | 0 (0.0%) | 4 (30.8%) |
Disability Class: Ambulatory Difficulty
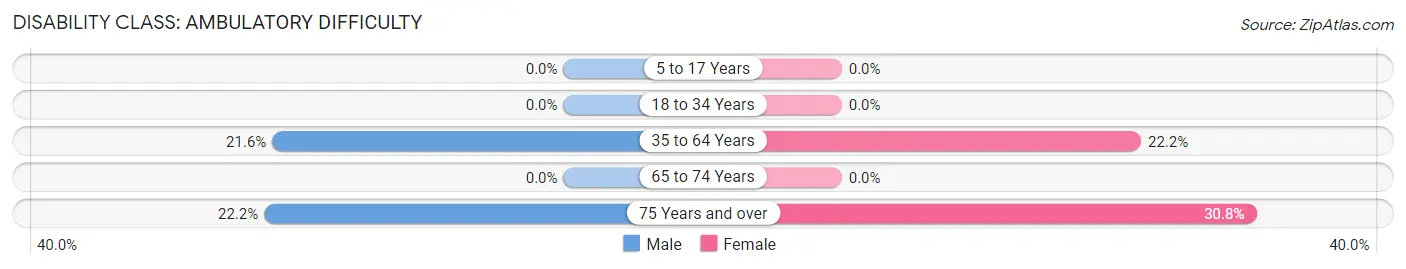
| Age Bracket | Male | Female |
| 5 to 17 Years | 0 (0.0%) | 0 (0.0%) |
| 18 to 34 Years | 0 (0.0%) | 0 (0.0%) |
| 35 to 64 Years | 16 (21.6%) | 8 (22.2%) |
| 65 to 74 Years | 0 (0.0%) | 0 (0.0%) |
| 75 Years and over | 4 (22.2%) | 4 (30.8%) |
Disability Class: Self-Care Difficulty
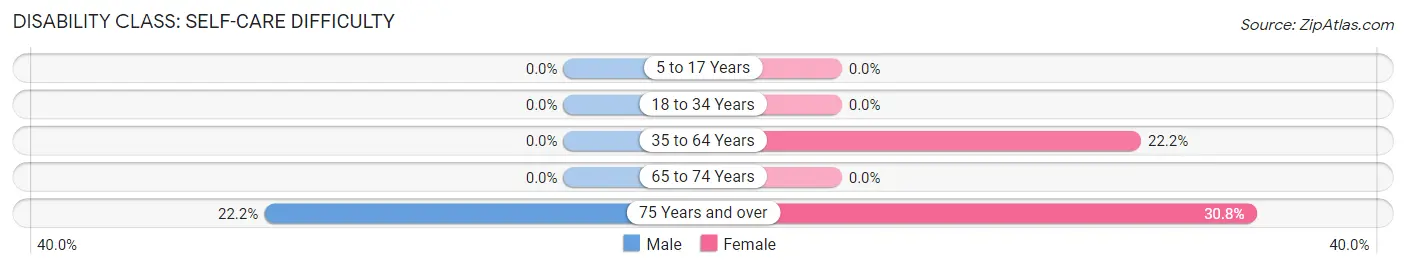
| Age Bracket | Male | Female |
| 5 to 17 Years | 0 (0.0%) | 0 (0.0%) |
| 18 to 34 Years | 0 (0.0%) | 0 (0.0%) |
| 35 to 64 Years | 0 (0.0%) | 8 (22.2%) |
| 65 to 74 Years | 0 (0.0%) | 0 (0.0%) |
| 75 Years and over | 4 (22.2%) | 4 (30.8%) |
Technology Access in Zihlman
Computing Device Access in Zihlman
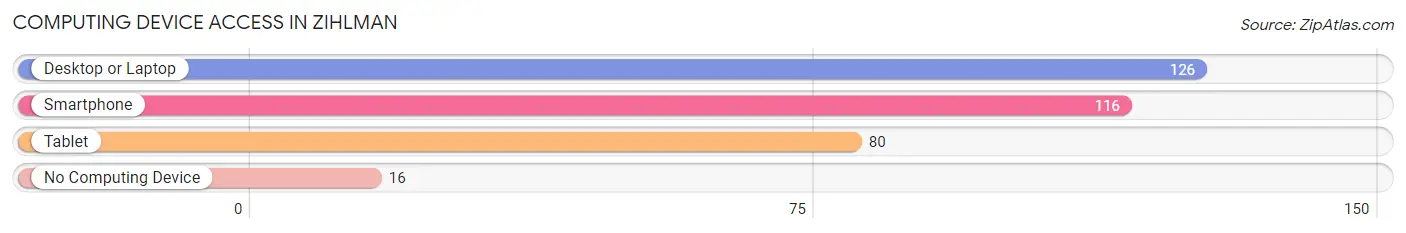
| Device Type | # Households | % Households |
| Desktop or Laptop | 126 | 80.2% |
| Smartphone | 116 | 73.9% |
| Tablet | 80 | 51.0% |
| No Computing Device | 16 | 10.2% |
| Total | 157 | 100.0% |
Internet Access in Zihlman
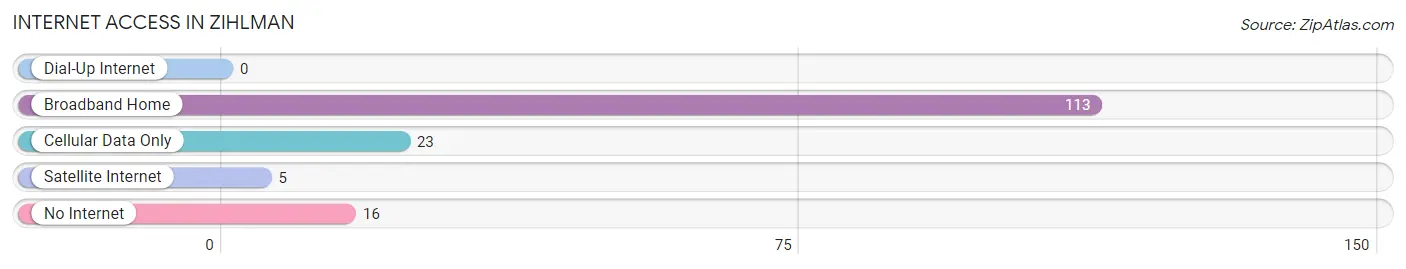
| Internet Type | # Households | % Households |
| Dial-Up Internet | 0 | 0.0% |
| Broadband Home | 113 | 72.0% |
| Cellular Data Only | 23 | 14.6% |
| Satellite Internet | 5 | 3.2% |
| No Internet | 16 | 10.2% |
| Total | 157 | 100.0% |
Zihlman Summary
The state of Maryland is located in the Mid-Atlantic region of the United States, and is bordered by Delaware, Pennsylvania, West Virginia, Virginia, and the District of Columbia. It is the 42nd most populous state in the country, with a population of 6,016,447 as of 2019. Maryland is the 19th most densely populated state in the country, with a population density of 617.4 people per square mile.
Geography
Maryland is divided into two distinct geographic regions: the Atlantic Coastal Plain and the Appalachian Plateau. The Atlantic Coastal Plain is located in the eastern part of the state and is characterized by flat terrain and sandy beaches. The Appalachian Plateau is located in the western part of the state and is characterized by rolling hills and valleys. The highest point in Maryland is Hoye-Crest, located in Garrett County, at 3,360 feet above sea level. The state is home to a variety of rivers, including the Potomac, Patuxent, Susquehanna, and Patapsco.
Economy
Maryland has a diverse economy, with a strong focus on technology, manufacturing, and services. The state is home to a number of major corporations, including Lockheed Martin, Northrop Grumman, and Marriott International. The state is also home to a number of federal government agencies, including the National Institutes of Health, the National Security Agency, and the Food and Drug Administration.
The state’s economy is heavily reliant on the federal government, with the federal government accounting for approximately 20% of the state’s total economic output. The state’s largest industries include manufacturing, health care, and professional and business services. The state’s unemployment rate was 3.7% as of December 2019.
Demographics
Maryland is a diverse state, with a population that is approximately 60% white, 30% African American, and 8% Hispanic or Latino. The state’s largest cities are Baltimore, Columbia, and Silver Spring. The state’s median household income is $80,776, and the poverty rate is 8.7%.
Maryland is home to a number of colleges and universities, including the University of Maryland, Johns Hopkins University, and Towson University. The state is also home to a number of professional sports teams, including the Baltimore Orioles, Baltimore Ravens, and Washington Capitals.
Conclusion
Maryland is a diverse state with a strong economy and a variety of geographic features. The state is home to a number of major corporations, federal government agencies, and colleges and universities. The state’s population is diverse, with a majority of the population being white, African American, and Hispanic or Latino. The state’s economy is heavily reliant on the federal government, and the state’s largest industries include manufacturing, health care, and professional and business services.
Common Questions
What is the Total Population of Zihlman?
Total Population of Zihlman is 316.
What is the Total Male Population of Zihlman?
Total Male Population of Zihlman is 189.
What is the Total Female Population of Zihlman?
Total Female Population of Zihlman is 127.
What is the Ratio of Males per 100 Females in Zihlman?
There are 148.82 Males per 100 Females in Zihlman.
What is the Ratio of Females per 100 Males in Zihlman?
There are 67.20 Females per 100 Males in Zihlman.
What is the Median Population Age in Zihlman?
Median Population Age in Zihlman is 47.6 Years.
What is the Average Family Size in Zihlman
Average Family Size in Zihlman is 2.3 People.
What is the Average Household Size in Zihlman
Average Household Size in Zihlman is 2.0 People.
What is Per Capita Income in Zihlman?
Per Capita income in Zihlman is $25,734.
What is the Median Family Income in Zihlman?
Median Family Income in Zihlman is $47,969.
What is the Median Household income in Zihlman?
Median Household Income in Zihlman is $48,073.
What is Income or Wage Gap in Zihlman?
Income or Wage Gap in Zihlman is 4.5%.
Women in Zihlman earn 95.5 cents for every dollar earned by a man.
What is Inequality or Gini Index in Zihlman?
Inequality or Gini Index in Zihlman is 0.21.
How Large is the Labor Force in Zihlman?
There are 123 People in the Labor Forcein in Zihlman.
What is the Percentage of People in the Labor Force in Zihlman?
43.8% of People are in the Labor Force in Zihlman.