Taylors Island, MD
Taylors Island Map
Taylors Island Overview
109
TOTAL POPULATION
65
MALE POPULATION
44
FEMALE POPULATION
147.73
MALES / 100 FEMALES
67.69
FEMALES / 100 MALES
59.0
MEDIAN AGE
2.3
AVG FAMILY SIZE
1.9
AVG HOUSEHOLD SIZE
$45,495
PER CAPITA INCOME
$68,977
AVG FAMILY INCOME
$68,182
AVG HOUSEHOLD INCOME
0.47
INEQUALITY / GINI INDEX
48
LABOR FORCE [ PEOPLE ]
48.5%
PERCENT IN LABOR FORCE
Taylors Island Zip Codes
Taylors Island Area Codes
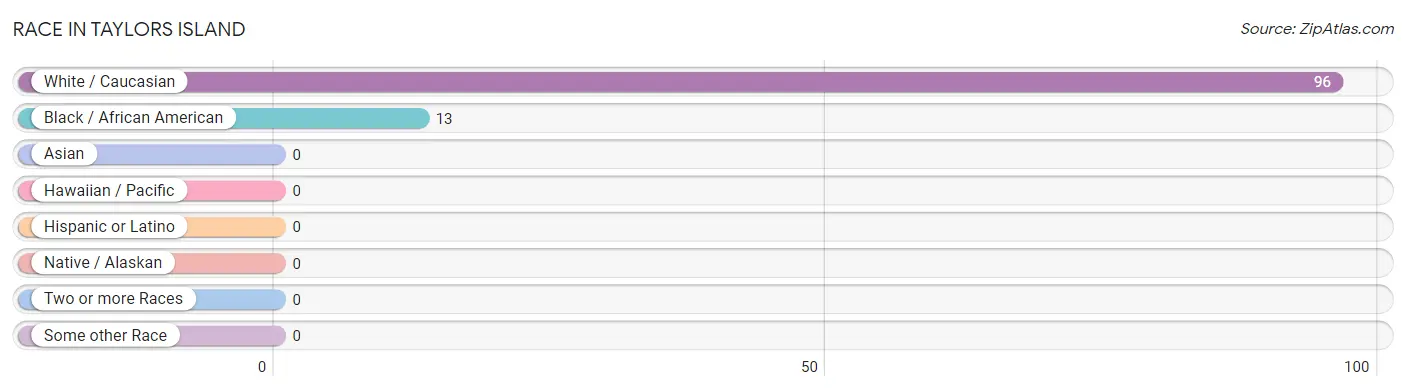
Race in Taylors Island
The most populous races in Taylors Island are White / Caucasian (96 | 88.1%), and Black / African American (13 | 11.9%).
| Race | # Population | % Population |
| Asian | 0 | 0.0% |
| Black / African American | 13 | 11.9% |
| Hawaiian / Pacific | 0 | 0.0% |
| Hispanic or Latino | 0 | 0.0% |
| Native / Alaskan | 0 | 0.0% |
| White / Caucasian | 96 | 88.1% |
| Two or more Races | 0 | 0.0% |
| Some other Race | 0 | 0.0% |
| Total | 109 | 100.0% |
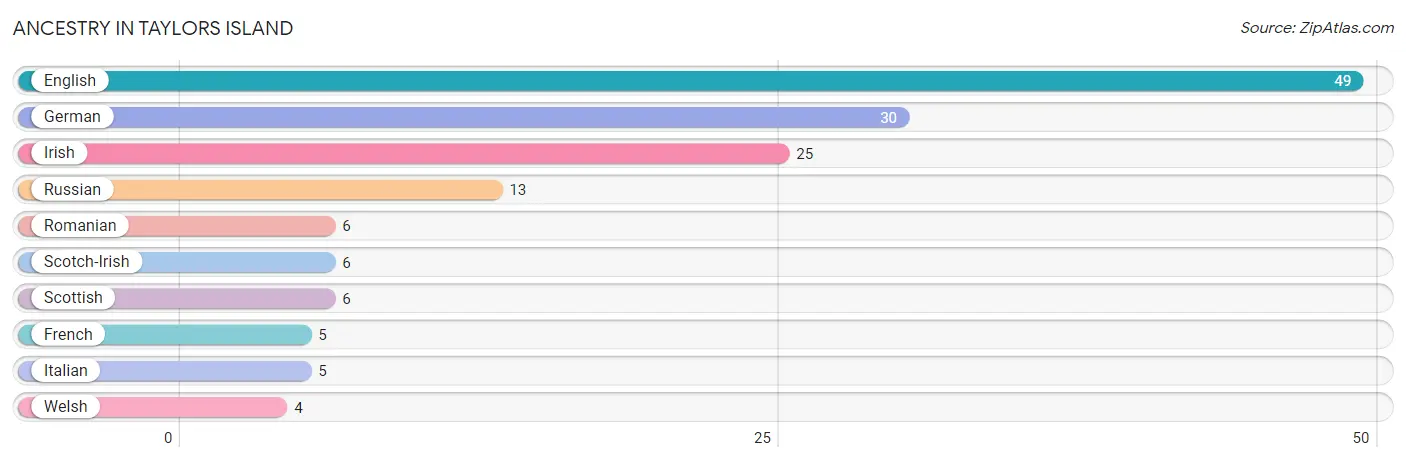
Ancestry in Taylors Island
The most populous ancestries reported in Taylors Island are English (49 | 45.0%), German (30 | 27.5%), Irish (25 | 22.9%), Russian (13 | 11.9%), and Romanian (6 | 5.5%), together accounting for 112.8% of all Taylors Island residents.
| Ancestry | # Population | % Population |
| English | 49 | 45.0% |
| French | 5 | 4.6% |
| German | 30 | 27.5% |
| Irish | 25 | 22.9% |
| Italian | 5 | 4.6% |
| Romanian | 6 | 5.5% |
| Russian | 13 | 11.9% |
| Scotch-Irish | 6 | 5.5% |
| Scottish | 6 | 5.5% |
| Welsh | 4 | 3.7% | View All 10 Rows |
Immigrants in Taylors Island

| Immigration Origin | # Population | % Population | View All 0 Rows |
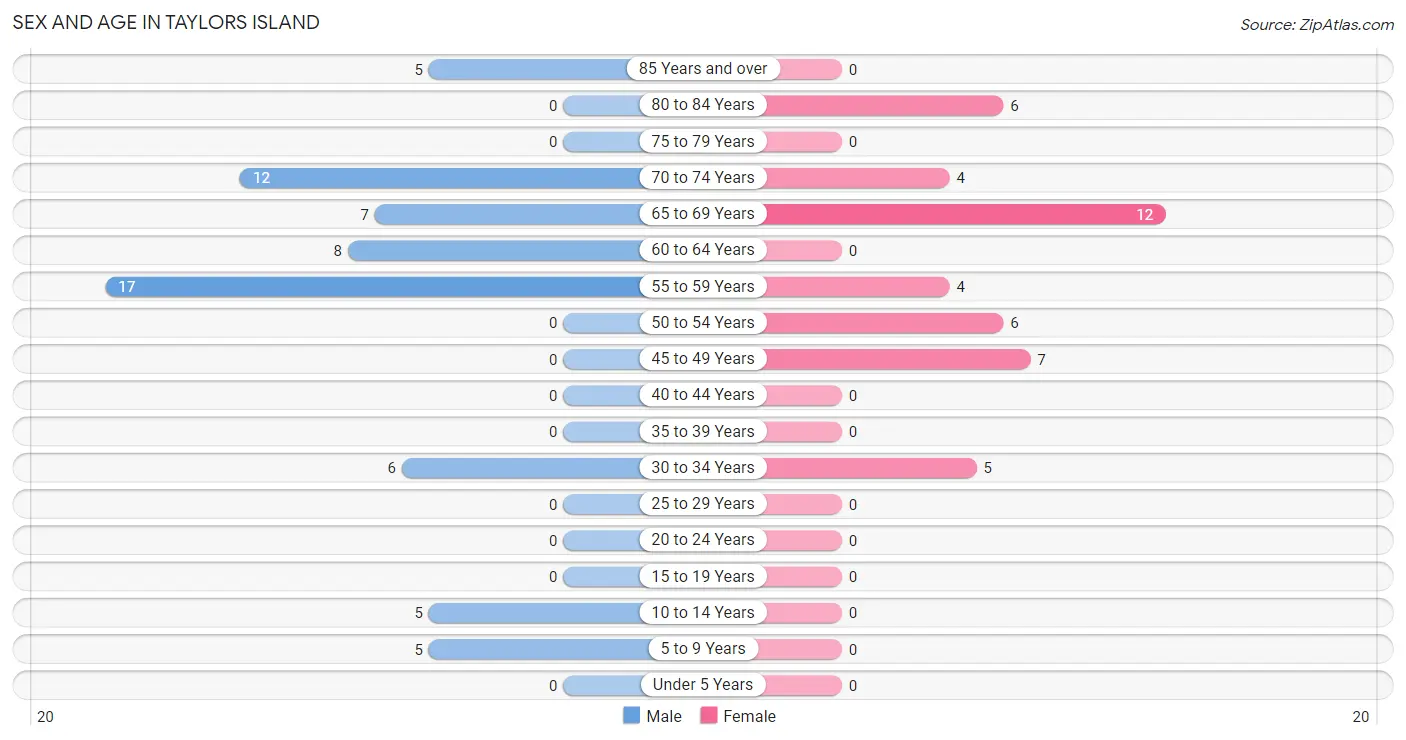
Sex and Age in Taylors Island
Sex and Age in Taylors Island
The most populous age groups in Taylors Island are 55 to 59 Years (17 | 26.2%) for men and 65 to 69 Years (12 | 27.3%) for women.
| Age Bracket | Male | Female |
| Under 5 Years | 0 (0.0%) | 0 (0.0%) |
| 5 to 9 Years | 5 (7.7%) | 0 (0.0%) |
| 10 to 14 Years | 5 (7.7%) | 0 (0.0%) |
| 15 to 19 Years | 0 (0.0%) | 0 (0.0%) |
| 20 to 24 Years | 0 (0.0%) | 0 (0.0%) |
| 25 to 29 Years | 0 (0.0%) | 0 (0.0%) |
| 30 to 34 Years | 6 (9.2%) | 5 (11.4%) |
| 35 to 39 Years | 0 (0.0%) | 0 (0.0%) |
| 40 to 44 Years | 0 (0.0%) | 0 (0.0%) |
| 45 to 49 Years | 0 (0.0%) | 7 (15.9%) |
| 50 to 54 Years | 0 (0.0%) | 6 (13.6%) |
| 55 to 59 Years | 17 (26.2%) | 4 (9.1%) |
| 60 to 64 Years | 8 (12.3%) | 0 (0.0%) |
| 65 to 69 Years | 7 (10.8%) | 12 (27.3%) |
| 70 to 74 Years | 12 (18.5%) | 4 (9.1%) |
| 75 to 79 Years | 0 (0.0%) | 0 (0.0%) |
| 80 to 84 Years | 0 (0.0%) | 6 (13.6%) |
| 85 Years and over | 5 (7.7%) | 0 (0.0%) |
| Total | 65 (100.0%) | 44 (100.0%) |
Families and Households in Taylors Island
Median Family Size in Taylors Island
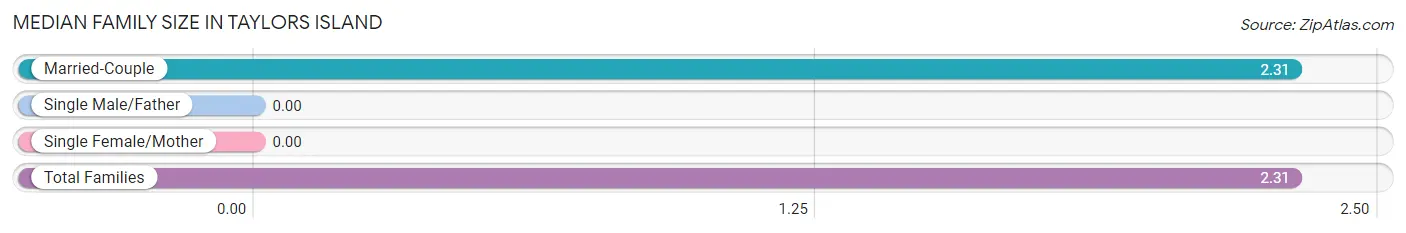
| Family Type | # Families | Family Size |
| Married-Couple | 39 (100.0%) | 2.31 |
| Single Male/Father | 0 (0.0%) | - |
| Single Female/Mother | 0 (0.0%) | - |
| Total Families | 39 (100.0%) | 2.31 |
Median Household Size in Taylors Island
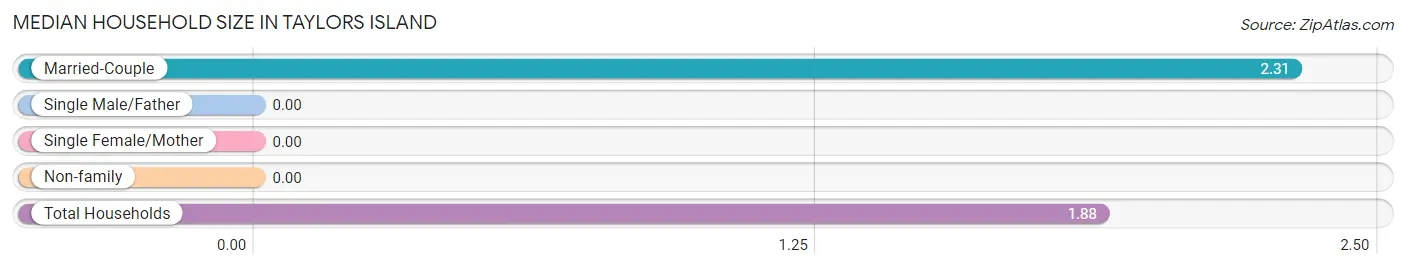
| Household Type | # Households | Household Size |
| Married-Couple | 39 (67.2%) | 2.31 |
| Single Male/Father | 0 (0.0%) | - |
| Single Female/Mother | 0 (0.0%) | - |
| Non-family | 19 (32.8%) | - |
| Total Households | 58 (100.0%) | 1.88 |
Household Size by Marriage Status in Taylors Island
Out of a total of 58 households in Taylors Island, 39 (67.2%) are family households, while 19 (32.8%) are nonfamily households. The most numerous type of family households are 2-person households, comprising 25, and the most common type of nonfamily households are 1-person households, comprising 19.
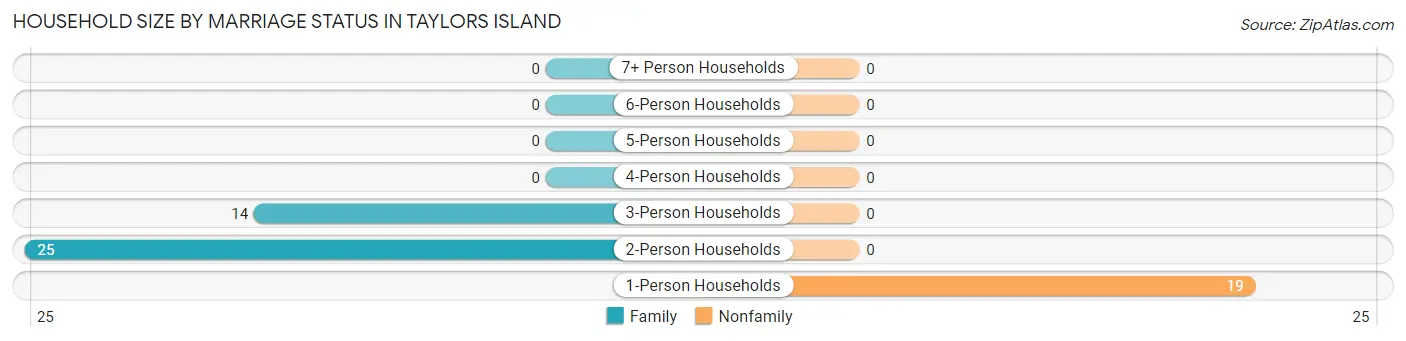
| Household Size | Family Households | Nonfamily Households |
| 1-Person Households | - | 19 (32.8%) |
| 2-Person Households | 25 (43.1%) | 0 (0.0%) |
| 3-Person Households | 14 (24.1%) | 0 (0.0%) |
| 4-Person Households | 0 (0.0%) | 0 (0.0%) |
| 5-Person Households | 0 (0.0%) | 0 (0.0%) |
| 6-Person Households | 0 (0.0%) | 0 (0.0%) |
| 7+ Person Households | 0 (0.0%) | 0 (0.0%) |
| Total | 39 (67.2%) | 19 (32.8%) |
Female Fertility in Taylors Island
Fertility by Age in Taylors Island
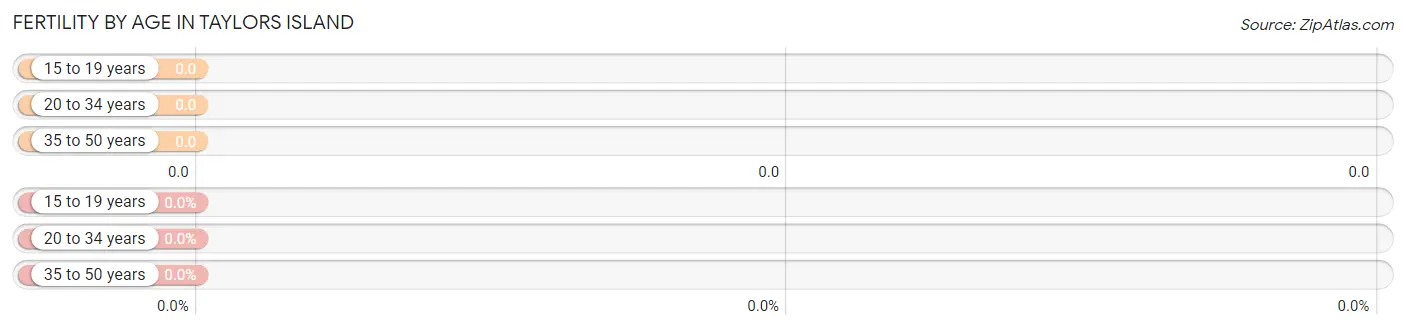
| Age Bracket | Women with Births | Births / 1,000 Women |
| 15 to 19 years | 0 (0.0%) | 0.0 |
| 20 to 34 years | 0 (0.0%) | 0.0 |
| 35 to 50 years | 0 (0.0%) | 0.0 |
| Total | 0 (0.0%) | 0.0 |
Fertility by Age by Marriage Status in Taylors Island
| Age Bracket | Married | Unmarried |
| 15 to 19 years | 0 (0.0%) | 0 (0.0%) |
| 20 to 34 years | 0 (0.0%) | 0 (0.0%) |
| 35 to 50 years | 0 (0.0%) | 0 (0.0%) |
| Total | 0 (0.0%) | 0 (0.0%) |
Fertility by Education in Taylors Island
| Educational Attainment | Women with Births | Births / 1,000 Women |
| Less than High School | 0 (0.0%) | 0.0 |
| High School Diploma | 0 (0.0%) | 0.0 |
| College or Associate's Degree | 0 (0.0%) | 0.0 |
| Bachelor's Degree | 0 (0.0%) | 0.0 |
| Graduate Degree | 0 (0.0%) | 0.0 |
| Total | 0 (0.0%) | 0.0 |
Fertility by Education by Marriage Status in Taylors Island
| Educational Attainment | Married | Unmarried |
| Less than High School | 0 (0.0%) | 0 (0.0%) |
| High School Diploma | 0 (0.0%) | 0 (0.0%) |
| College or Associate's Degree | 0 (0.0%) | 0 (0.0%) |
| Bachelor's Degree | 0 (0.0%) | 0 (0.0%) |
| Graduate Degree | 0 (0.0%) | 0 (0.0%) |
| Total | 0 (0.0%) | 0 (0.0%) |
Income in Taylors Island
Income Overview in Taylors Island
Per Capita Income in Taylors Island is $45,495, while median incomes of families and households are $68,977 and $68,182 respectively.
| Characteristic | Number | Measure |
| Per Capita Income | 109 | $45,495 |
| Median Family Income | 39 | $68,977 |
| Mean Family Income | 39 | $112,121 |
| Median Household Income | 58 | $68,182 |
| Mean Household Income | 58 | $84,526 |
| Income Deficit | 39 | $0 |
| Wage / Income Gap (%) | 109 | 0.00% |
| Wage / Income Gap ($) | 109 | 100.00¢ per $1 |
| Gini / Inequality Index | 109 | 0.47 |
Earnings by Sex in Taylors Island
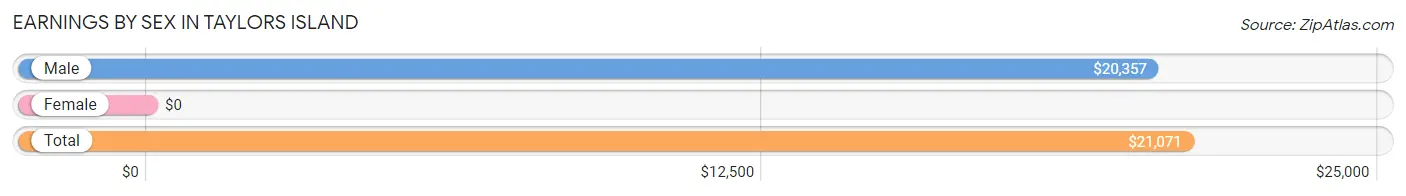
| Sex | Number | Average Earnings |
| Male | 30 (62.5%) | $20,357 |
| Female | 18 (37.5%) | $0 |
| Total | 48 (100.0%) | $21,071 |
Earnings by Sex by Income Bracket in Taylors Island
The most common earnings brackets in Taylors Island are $17,500 to $19,999 for men (8 | 26.7%) and $5,000 to $7,499 for women (7 | 38.9%).
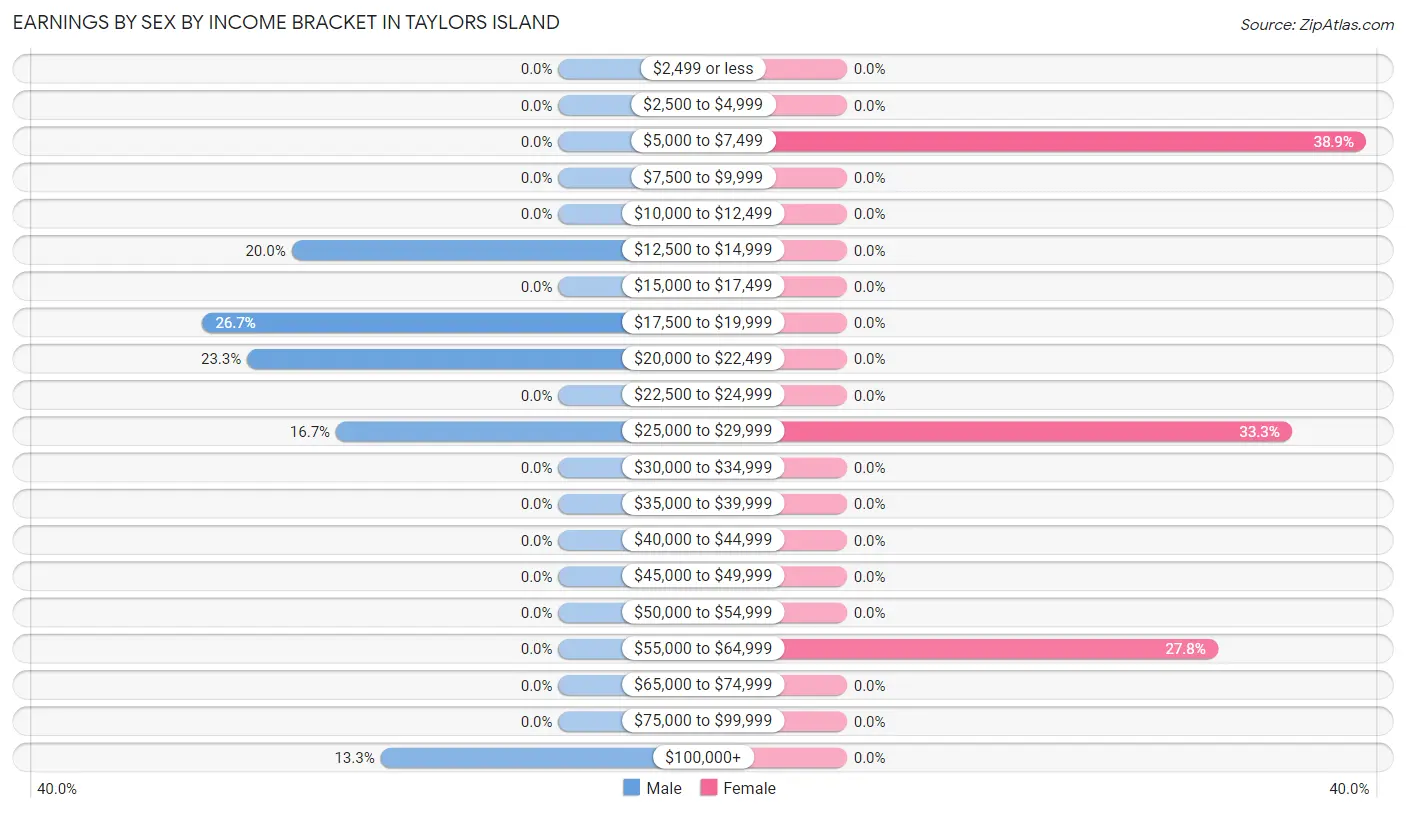
| Income | Male | Female |
| $2,499 or less | 0 (0.0%) | 0 (0.0%) |
| $2,500 to $4,999 | 0 (0.0%) | 0 (0.0%) |
| $5,000 to $7,499 | 0 (0.0%) | 7 (38.9%) |
| $7,500 to $9,999 | 0 (0.0%) | 0 (0.0%) |
| $10,000 to $12,499 | 0 (0.0%) | 0 (0.0%) |
| $12,500 to $14,999 | 6 (20.0%) | 0 (0.0%) |
| $15,000 to $17,499 | 0 (0.0%) | 0 (0.0%) |
| $17,500 to $19,999 | 8 (26.7%) | 0 (0.0%) |
| $20,000 to $22,499 | 7 (23.3%) | 0 (0.0%) |
| $22,500 to $24,999 | 0 (0.0%) | 0 (0.0%) |
| $25,000 to $29,999 | 5 (16.7%) | 6 (33.3%) |
| $30,000 to $34,999 | 0 (0.0%) | 0 (0.0%) |
| $35,000 to $39,999 | 0 (0.0%) | 0 (0.0%) |
| $40,000 to $44,999 | 0 (0.0%) | 0 (0.0%) |
| $45,000 to $49,999 | 0 (0.0%) | 0 (0.0%) |
| $50,000 to $54,999 | 0 (0.0%) | 0 (0.0%) |
| $55,000 to $64,999 | 0 (0.0%) | 5 (27.8%) |
| $65,000 to $74,999 | 0 (0.0%) | 0 (0.0%) |
| $75,000 to $99,999 | 0 (0.0%) | 0 (0.0%) |
| $100,000+ | 4 (13.3%) | 0 (0.0%) |
| Total | 30 (100.0%) | 18 (100.0%) |
Earnings by Sex by Educational Attainment in Taylors Island
| Educational Attainment | Male Income | Female Income |
| Less than High School | - | - |
| High School Diploma | - | - |
| College or Associate's Degree | - | - |
| Bachelor's Degree | - | - |
| Graduate Degree | - | - |
| Total | $20,357 | $0 |
Family Income in Taylors Island
Family Income Brackets in Taylors Island
According to the Taylors Island family income data, there are 24 families falling into the $50,000 to $74,999 income range, which is the most common income bracket and makes up 61.5% of all families.
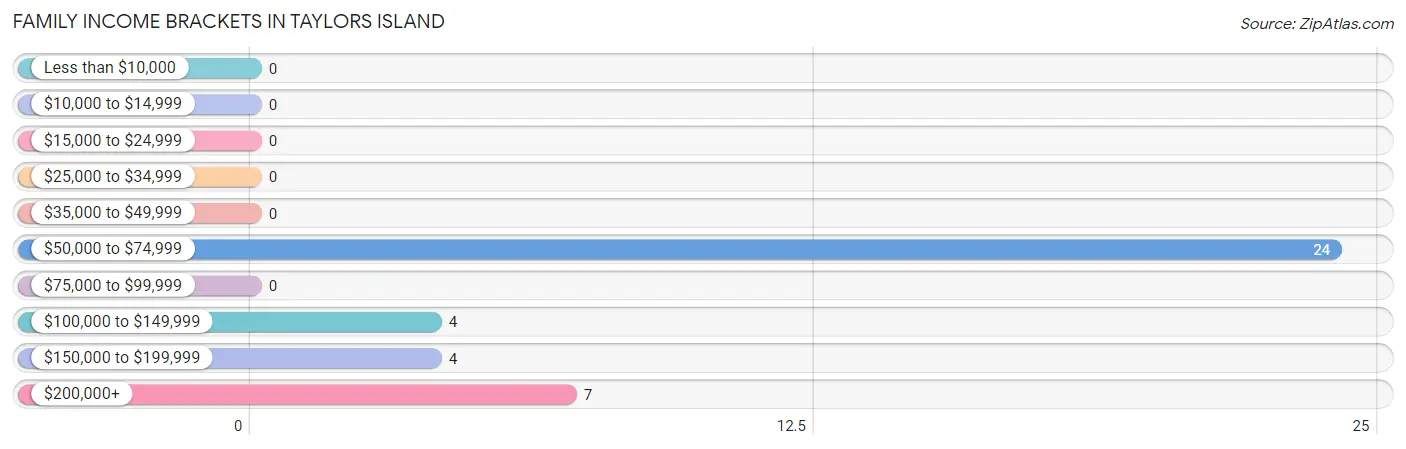
| Income Bracket | # Families | % Families |
| Less than $10,000 | 0 | 0.0% |
| $10,000 to $14,999 | 0 | 0.0% |
| $15,000 to $24,999 | 0 | 0.0% |
| $25,000 to $34,999 | 0 | 0.0% |
| $35,000 to $49,999 | 0 | 0.0% |
| $50,000 to $74,999 | 24 | 61.5% |
| $75,000 to $99,999 | 0 | 0.0% |
| $100,000 to $149,999 | 4 | 10.3% |
| $150,000 to $199,999 | 4 | 10.3% |
| $200,000+ | 7 | 17.9% |
Family Income by Famaliy Size in Taylors Island
2-person families (25 | 64.1%) account for the highest median family income in Taylors Island with $136,563 per family, while 2-person families (25 | 64.1%) have the highest median income of $68,282 per family member.
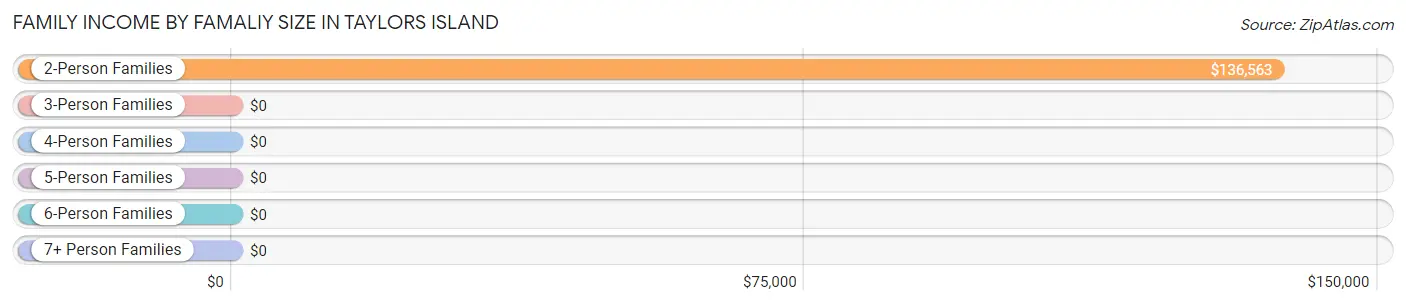
| Income Bracket | # Families | Median Income |
| 2-Person Families | 25 (64.1%) | $136,563 |
| 3-Person Families | 14 (35.9%) | $0 |
| 4-Person Families | 0 (0.0%) | $0 |
| 5-Person Families | 0 (0.0%) | $0 |
| 6-Person Families | 0 (0.0%) | $0 |
| 7+ Person Families | 0 (0.0%) | $0 |
| Total | 39 (100.0%) | $68,977 |
Family Income by Number of Earners in Taylors Island
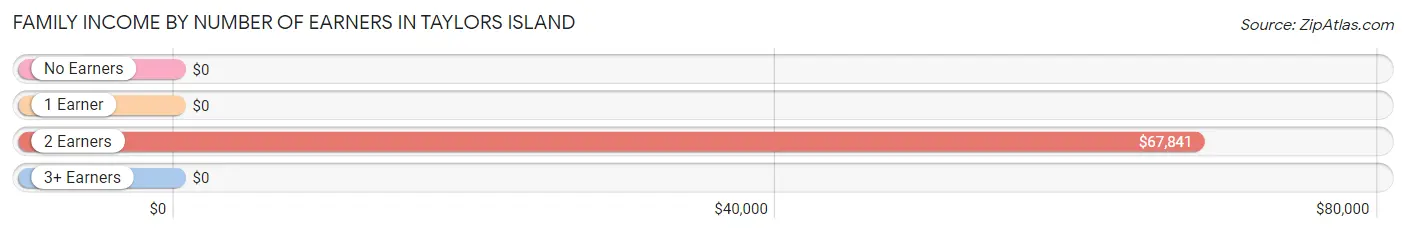
| Number of Earners | # Families | Median Income |
| No Earners | 12 (30.8%) | $0 |
| 1 Earner | 8 (20.5%) | $0 |
| 2 Earners | 19 (48.7%) | $67,841 |
| 3+ Earners | 0 (0.0%) | $0 |
| Total | 39 (100.0%) | $68,977 |
Household Income in Taylors Island
Household Income Brackets in Taylors Island
With 24 households falling in the category, the $50,000 to $74,999 income range is the most frequent in Taylors Island, accounting for 41.4% of all households.
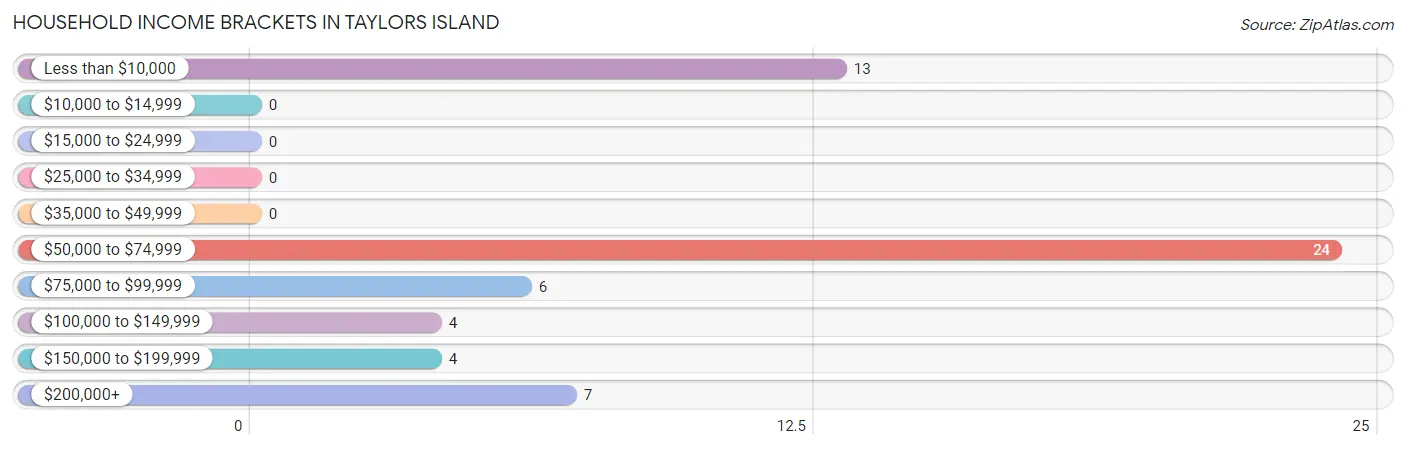
| Income Bracket | # Households | % Households |
| Less than $10,000 | 13 | 22.4% |
| $10,000 to $14,999 | 0 | 0.0% |
| $15,000 to $24,999 | 0 | 0.0% |
| $25,000 to $34,999 | 0 | 0.0% |
| $35,000 to $49,999 | 0 | 0.0% |
| $50,000 to $74,999 | 24 | 41.4% |
| $75,000 to $99,999 | 6 | 10.3% |
| $100,000 to $149,999 | 4 | 6.9% |
| $150,000 to $199,999 | 4 | 6.9% |
| $200,000+ | 7 | 12.1% |
Household Income by Householder Age in Taylors Island
The median household income in Taylors Island is $68,182, with the highest median household income of $120,000 found in the 65+ years age bracket for the primary householder. A total of 22 households (37.9%) fall into this category.
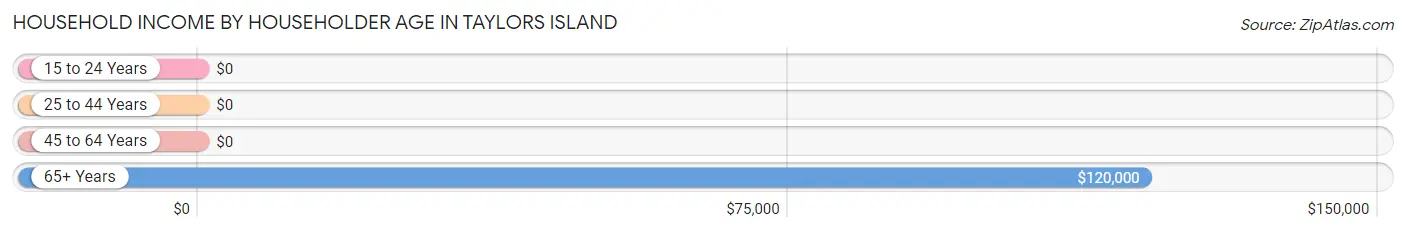
| Income Bracket | # Households | Median Income |
| 15 to 24 Years | 0 (0.0%) | $0 |
| 25 to 44 Years | 5 (8.6%) | $0 |
| 45 to 64 Years | 31 (53.4%) | $0 |
| 65+ Years | 22 (37.9%) | $120,000 |
| Total | 58 (100.0%) | $68,182 |
Poverty in Taylors Island
Income Below Poverty by Sex and Age in Taylors Island
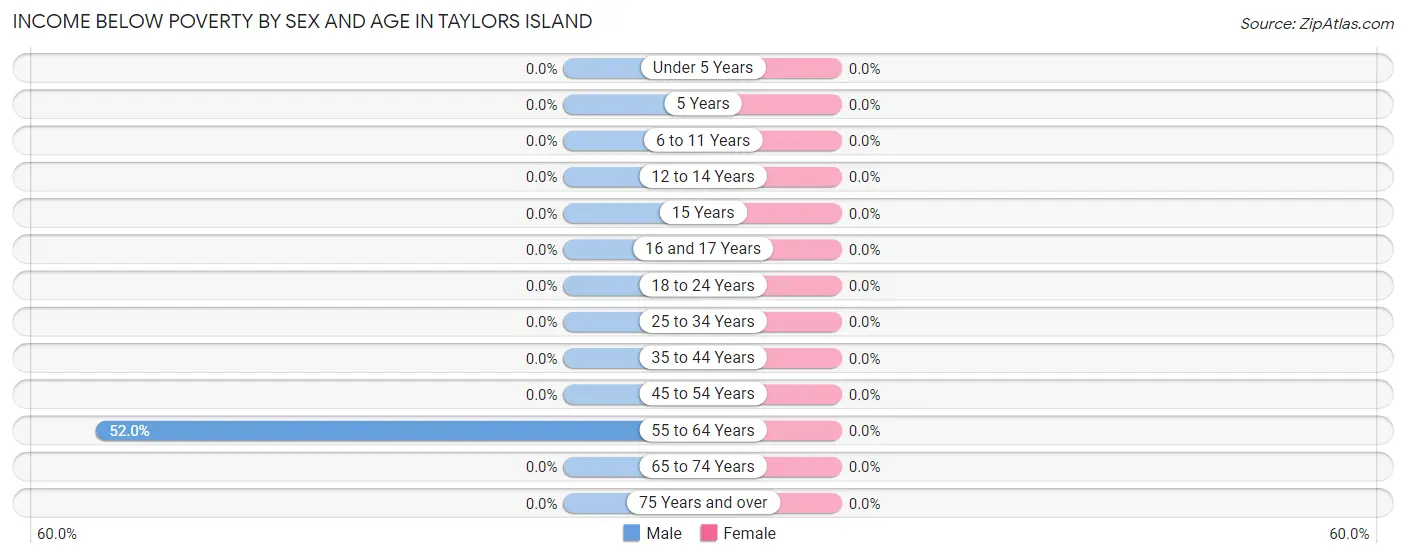
| Age Bracket | Male | Female |
| Under 5 Years | 0 (0.0%) | 0 (0.0%) |
| 5 Years | 0 (0.0%) | 0 (0.0%) |
| 6 to 11 Years | 0 (0.0%) | 0 (0.0%) |
| 12 to 14 Years | 0 (0.0%) | 0 (0.0%) |
| 15 Years | 0 (0.0%) | 0 (0.0%) |
| 16 and 17 Years | 0 (0.0%) | 0 (0.0%) |
| 18 to 24 Years | 0 (0.0%) | 0 (0.0%) |
| 25 to 34 Years | 0 (0.0%) | 0 (0.0%) |
| 35 to 44 Years | 0 (0.0%) | 0 (0.0%) |
| 45 to 54 Years | 0 (0.0%) | 0 (0.0%) |
| 55 to 64 Years | 13 (52.0%) | 0 (0.0%) |
| 65 to 74 Years | 0 (0.0%) | 0 (0.0%) |
| 75 Years and over | 0 (0.0%) | 0 (0.0%) |
| Total | 13 (20.0%) | 0 (0.0%) |
Income Above Poverty by Sex and Age in Taylors Island
According to the poverty statistics in Taylors Island, males aged 6 to 11 years and females aged 25 to 34 years are the age groups that are most secure financially, with 100.0% of males and 100.0% of females in these age groups living above the poverty line.
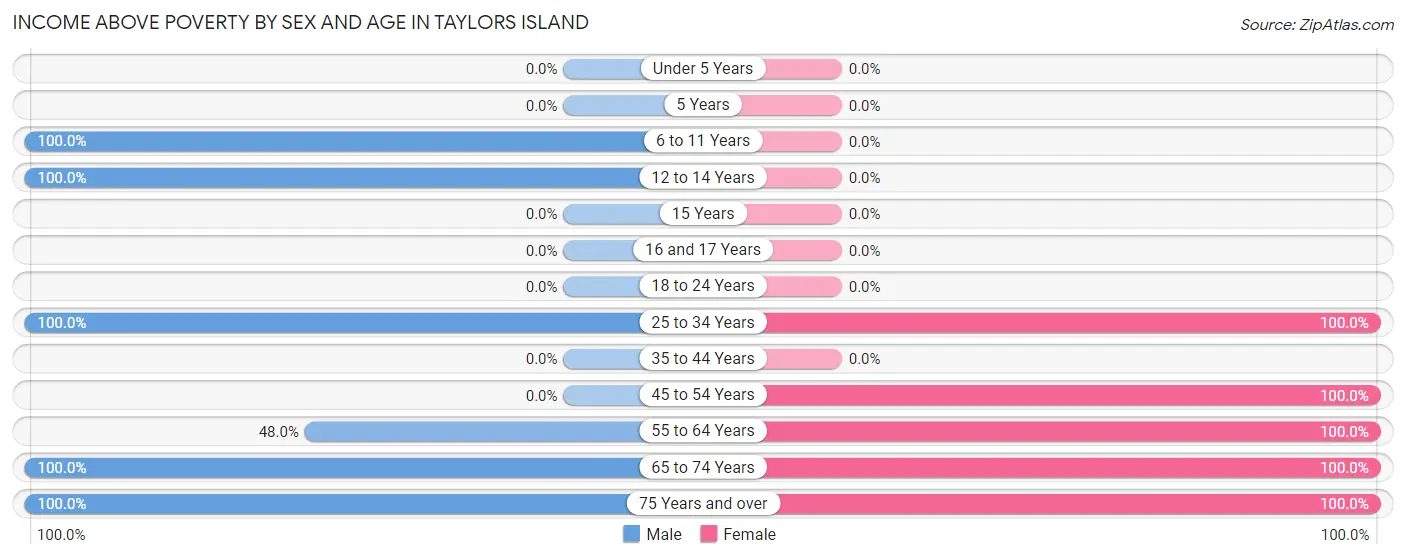
| Age Bracket | Male | Female |
| Under 5 Years | 0 (0.0%) | 0 (0.0%) |
| 5 Years | 0 (0.0%) | 0 (0.0%) |
| 6 to 11 Years | 5 (100.0%) | 0 (0.0%) |
| 12 to 14 Years | 5 (100.0%) | 0 (0.0%) |
| 15 Years | 0 (0.0%) | 0 (0.0%) |
| 16 and 17 Years | 0 (0.0%) | 0 (0.0%) |
| 18 to 24 Years | 0 (0.0%) | 0 (0.0%) |
| 25 to 34 Years | 6 (100.0%) | 5 (100.0%) |
| 35 to 44 Years | 0 (0.0%) | 0 (0.0%) |
| 45 to 54 Years | 0 (0.0%) | 13 (100.0%) |
| 55 to 64 Years | 12 (48.0%) | 4 (100.0%) |
| 65 to 74 Years | 19 (100.0%) | 16 (100.0%) |
| 75 Years and over | 5 (100.0%) | 6 (100.0%) |
| Total | 52 (80.0%) | 44 (100.0%) |
Income Below Poverty Among Married-Couple Families in Taylors Island
| Children | Above Poverty | Below Poverty |
| No Children | 25 (100.0%) | 0 (0.0%) |
| 1 or 2 Children | 14 (100.0%) | 0 (0.0%) |
| 3 or 4 Children | 0 (0.0%) | 0 (0.0%) |
| 5 or more Children | 0 (0.0%) | 0 (0.0%) |
| Total | 39 (100.0%) | 0 (0.0%) |
Income Below Poverty Among Single-Parent Households in Taylors Island
| Children | Single Father | Single Mother |
| No Children | 0 (0.0%) | 0 (0.0%) |
| 1 or 2 Children | 0 (0.0%) | 0 (0.0%) |
| 3 or 4 Children | 0 (0.0%) | 0 (0.0%) |
| 5 or more Children | 0 (0.0%) | 0 (0.0%) |
| Total | 0 (0.0%) | 0 (0.0%) |
Income Below Poverty Among Married-Couple vs Single-Parent Households in Taylors Island
| Children | Married-Couple Families | Single-Parent Households |
| No Children | 0 (0.0%) | 0 (0.0%) |
| 1 or 2 Children | 0 (0.0%) | 0 (0.0%) |
| 3 or 4 Children | 0 (0.0%) | 0 (0.0%) |
| 5 or more Children | 0 (0.0%) | 0 (0.0%) |
| Total | 0 (0.0%) | 0 (0.0%) |
Employment Characteristics in Taylors Island
Employment by Class of Employer in Taylors Island
Among the 42 employed individuals in Taylors Island, self-employed (not incorporated) (15 | 35.7%), private company employees (9 | 21.4%), and self-employed (incorporated) (7 | 16.7%) make up the most common classes of employment.
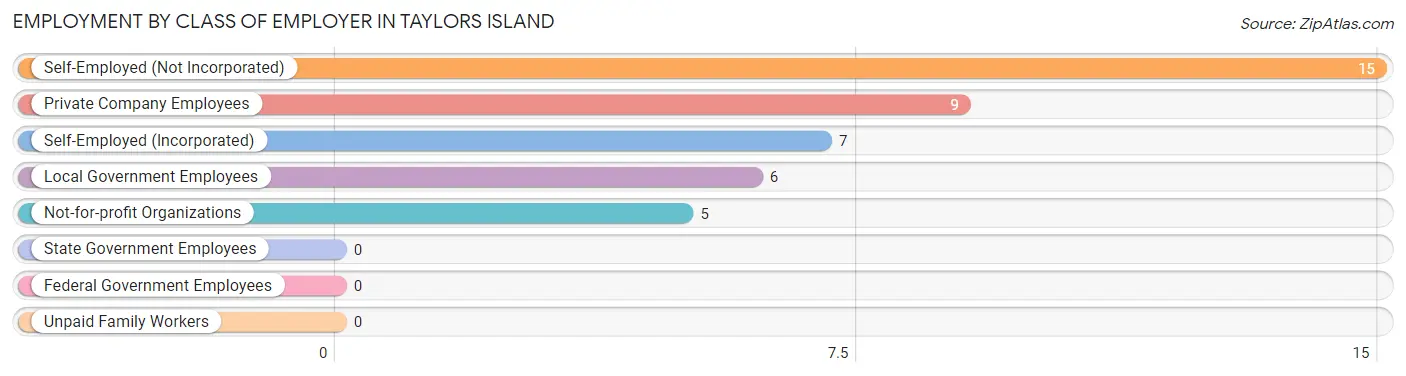
| Employer Class | # Employees | % Employees |
| Private Company Employees | 9 | 21.4% |
| Self-Employed (Incorporated) | 7 | 16.7% |
| Self-Employed (Not Incorporated) | 15 | 35.7% |
| Not-for-profit Organizations | 5 | 11.9% |
| Local Government Employees | 6 | 14.3% |
| State Government Employees | 0 | 0.0% |
| Federal Government Employees | 0 | 0.0% |
| Unpaid Family Workers | 0 | 0.0% |
| Total | 42 | 100.0% |
Employment Status by Age in Taylors Island
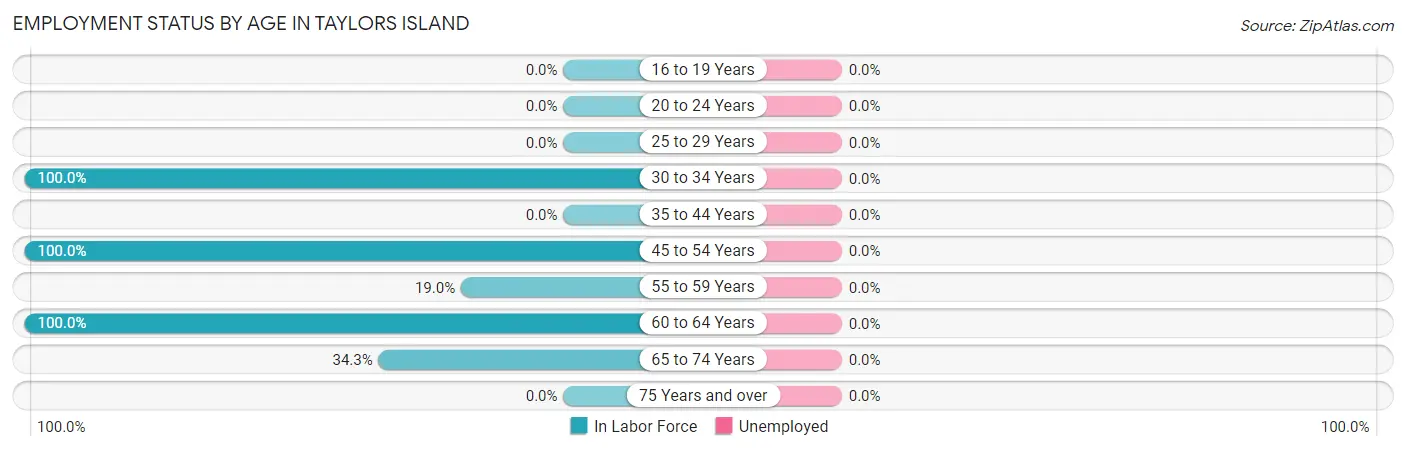
| Age Bracket | In Labor Force | Unemployed |
| 16 to 19 Years | 0 (0.0%) | 0 (0.0%) |
| 20 to 24 Years | 0 (0.0%) | 0 (0.0%) |
| 25 to 29 Years | 0 (0.0%) | 0 (0.0%) |
| 30 to 34 Years | 11 (100.0%) | 0 (0.0%) |
| 35 to 44 Years | 0 (0.0%) | 0 (0.0%) |
| 45 to 54 Years | 13 (100.0%) | 0 (0.0%) |
| 55 to 59 Years | 4 (19.0%) | 0 (0.0%) |
| 60 to 64 Years | 8 (100.0%) | 0 (0.0%) |
| 65 to 74 Years | 12 (34.3%) | 0 (0.0%) |
| 75 Years and over | 0 (0.0%) | 0 (0.0%) |
| Total | 48 (48.5%) | 0 (0.0%) |
Employment Status by Educational Attainment in Taylors Island
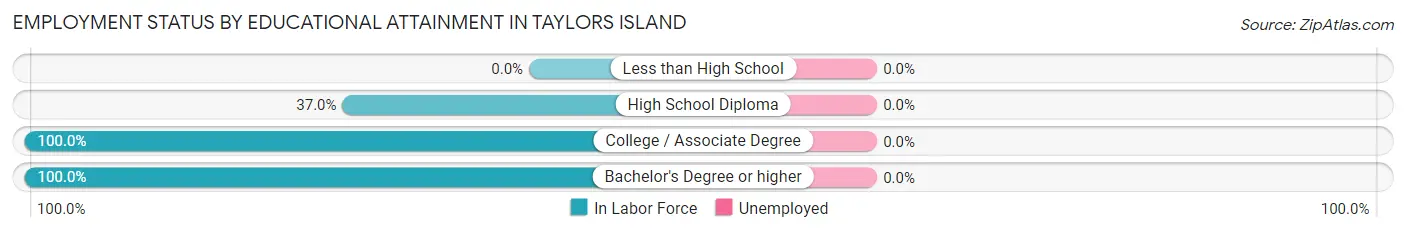
| Educational Attainment | In Labor Force | Unemployed |
| Less than High School | 0 (0.0%) | 0 (0.0%) |
| High School Diploma | 10 (37.0%) | 0 (0.0%) |
| College / Associate Degree | 8 (100.0%) | 0 (0.0%) |
| Bachelor's Degree or higher | 18 (100.0%) | 0 (0.0%) |
| Total | 36 (67.9%) | 0 (0.0%) |
Employment Occupations by Sex in Taylors Island
Management, Business, Science and Arts Occupations
The most common Management, Business, Science and Arts occupations in Taylors Island are Community & Social Service (6 | 12.5%), Education Instruction & Library (6 | 12.5%), and Business & Financial (5 | 10.4%).
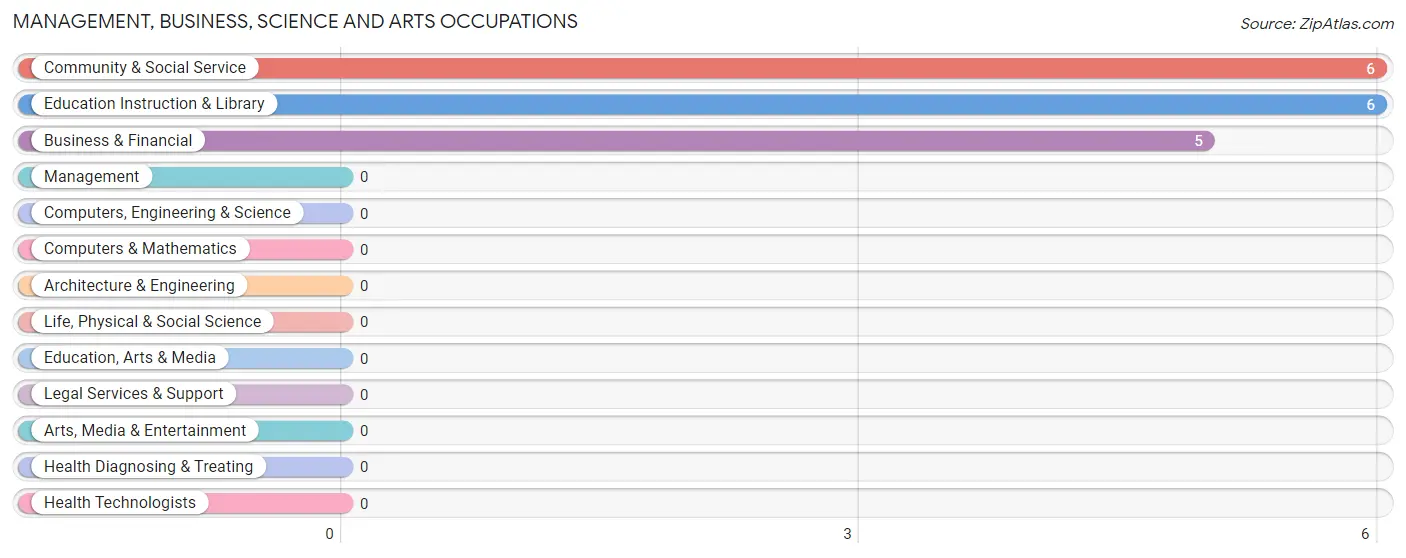
Management, Business, Science and Arts Occupations by Sex
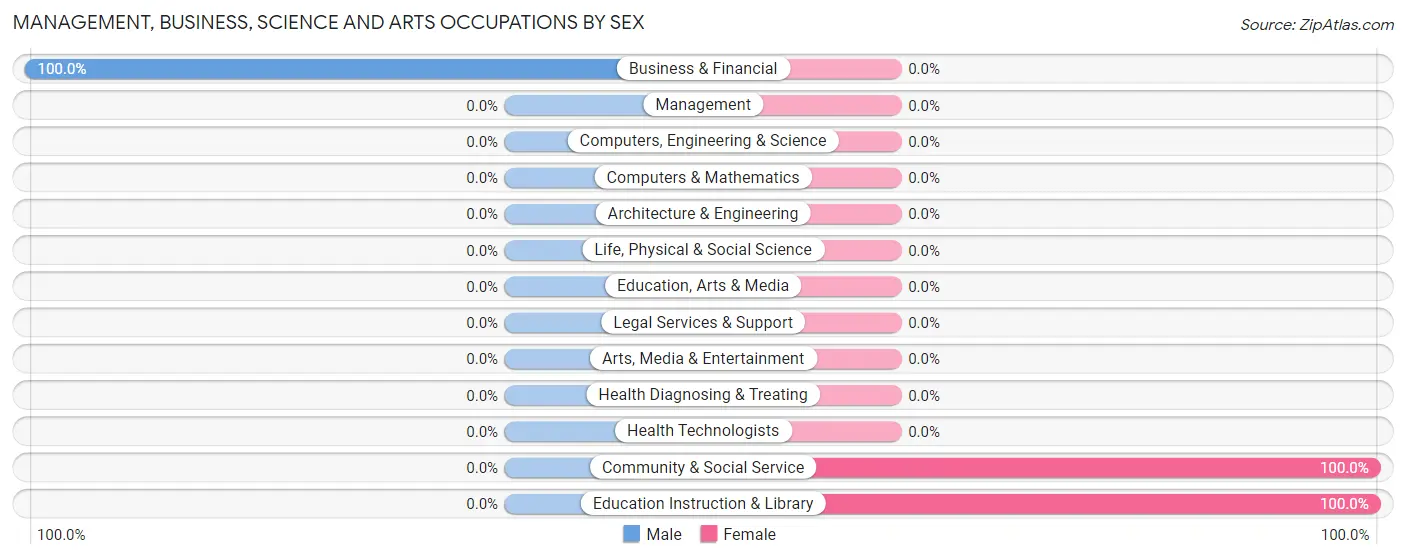
| Occupation | Male | Female |
| Management | 0 (0.0%) | 0 (0.0%) |
| Business & Financial | 5 (100.0%) | 0 (0.0%) |
| Computers, Engineering & Science | 0 (0.0%) | 0 (0.0%) |
| Computers & Mathematics | 0 (0.0%) | 0 (0.0%) |
| Architecture & Engineering | 0 (0.0%) | 0 (0.0%) |
| Life, Physical & Social Science | 0 (0.0%) | 0 (0.0%) |
| Community & Social Service | 0 (0.0%) | 6 (100.0%) |
| Education, Arts & Media | 0 (0.0%) | 0 (0.0%) |
| Legal Services & Support | 0 (0.0%) | 0 (0.0%) |
| Education Instruction & Library | 0 (0.0%) | 6 (100.0%) |
| Arts, Media & Entertainment | 0 (0.0%) | 0 (0.0%) |
| Health Diagnosing & Treating | 0 (0.0%) | 0 (0.0%) |
| Health Technologists | 0 (0.0%) | 0 (0.0%) |
| Total (Category) | 5 (45.5%) | 6 (54.5%) |
| Total (Overall) | 30 (62.5%) | 18 (37.5%) |
Services Occupations
The most common Services occupations in Taylors Island are Cleaning & Maintenance (7 | 14.6%), and Personal Care & Service (5 | 10.4%).
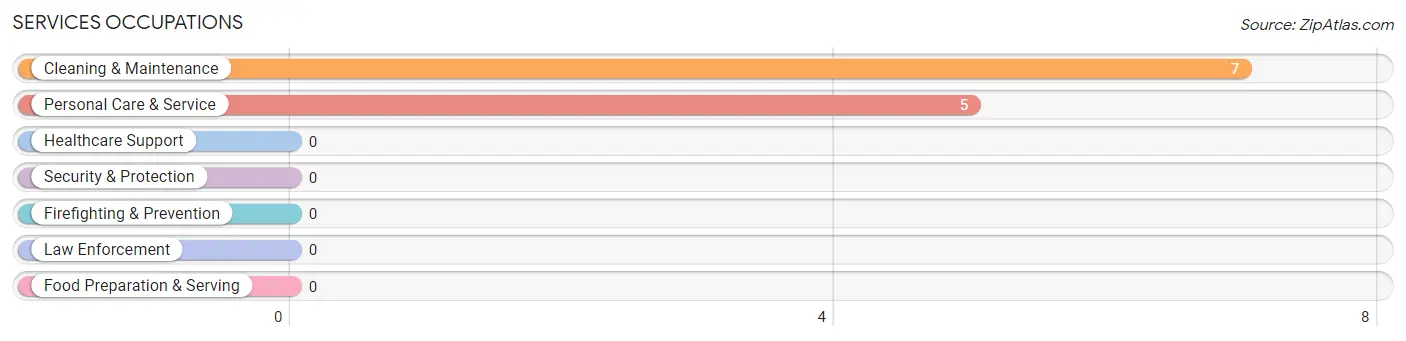
Services Occupations by Sex
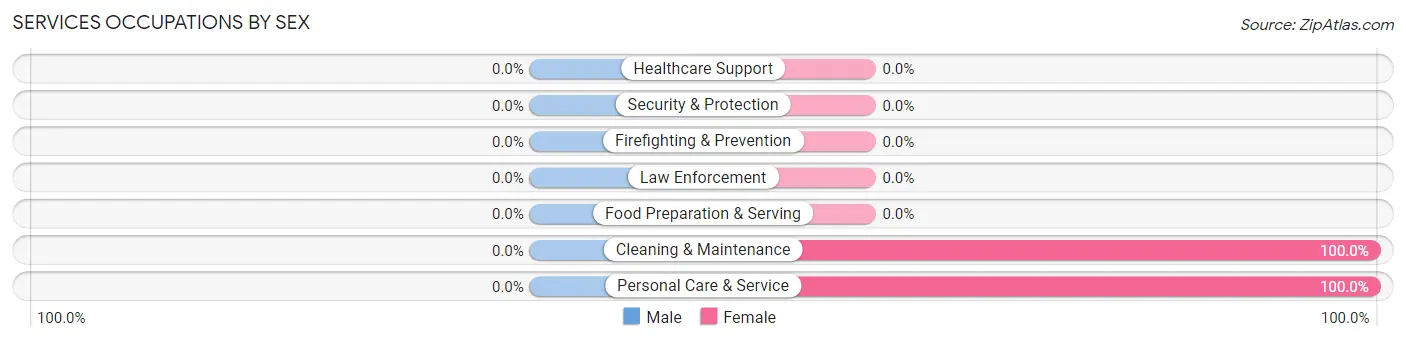
| Occupation | Male | Female |
| Healthcare Support | 0 (0.0%) | 0 (0.0%) |
| Security & Protection | 0 (0.0%) | 0 (0.0%) |
| Firefighting & Prevention | 0 (0.0%) | 0 (0.0%) |
| Law Enforcement | 0 (0.0%) | 0 (0.0%) |
| Food Preparation & Serving | 0 (0.0%) | 0 (0.0%) |
| Cleaning & Maintenance | 0 (0.0%) | 7 (100.0%) |
| Personal Care & Service | 0 (0.0%) | 5 (100.0%) |
| Total (Category) | 0 (0.0%) | 12 (100.0%) |
| Total (Overall) | 30 (62.5%) | 18 (37.5%) |
Sales and Office Occupations
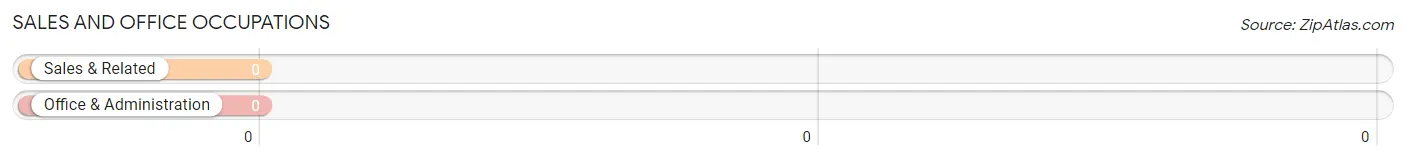
Sales and Office Occupations by Sex
| Occupation | Male | Female |
| Sales & Related | 0 (0.0%) | 0 (0.0%) |
| Office & Administration | 0 (0.0%) | 0 (0.0%) |
| Total (Category) | 0 (0.0%) | 0 (0.0%) |
| Total (Overall) | 30 (62.5%) | 18 (37.5%) |
Natural Resources, Construction and Maintenance Occupations
The most common Natural Resources, Construction and Maintenance occupations in Taylors Island are Construction & Extraction (15 | 31.2%), and Farming, Fishing & Forestry (6 | 12.5%).
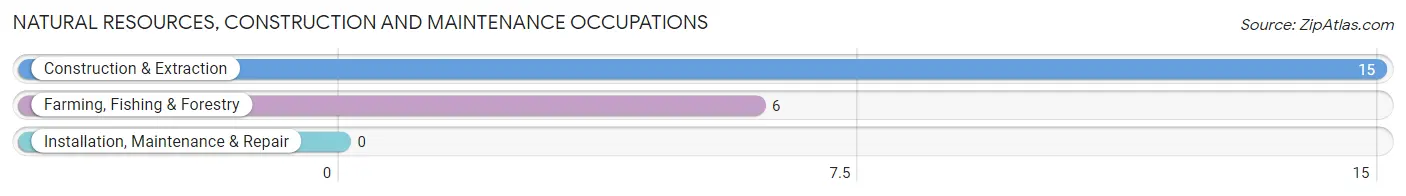
Natural Resources, Construction and Maintenance Occupations by Sex
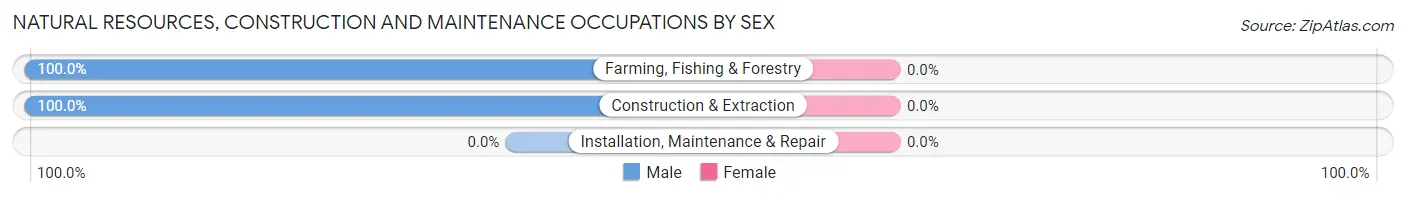
| Occupation | Male | Female |
| Farming, Fishing & Forestry | 6 (100.0%) | 0 (0.0%) |
| Construction & Extraction | 15 (100.0%) | 0 (0.0%) |
| Installation, Maintenance & Repair | 0 (0.0%) | 0 (0.0%) |
| Total (Category) | 21 (100.0%) | 0 (0.0%) |
| Total (Overall) | 30 (62.5%) | 18 (37.5%) |
Production, Transportation and Moving Occupations
The most common Production, Transportation and Moving occupations in Taylors Island are , and Production (4 | 8.3%).
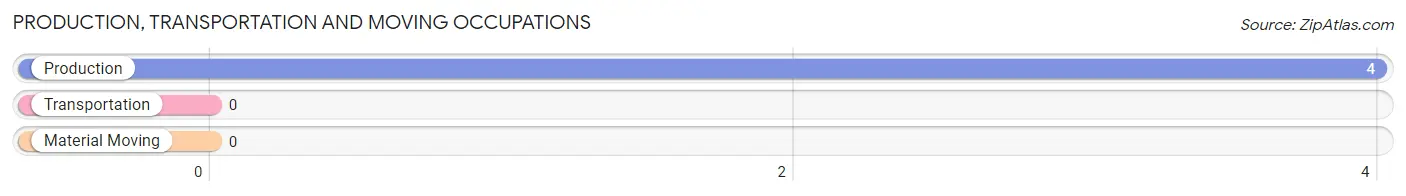
Production, Transportation and Moving Occupations by Sex
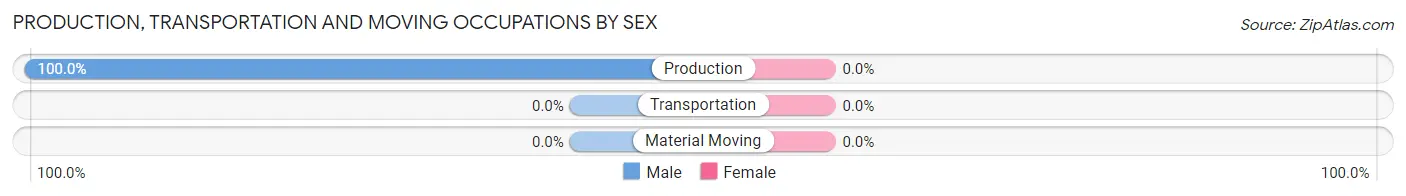
| Occupation | Male | Female |
| Production | 4 (100.0%) | 0 (0.0%) |
| Transportation | 0 (0.0%) | 0 (0.0%) |
| Material Moving | 0 (0.0%) | 0 (0.0%) |
| Total (Category) | 4 (100.0%) | 0 (0.0%) |
| Total (Overall) | 30 (62.5%) | 18 (37.5%) |
Employment Industries by Sex in Taylors Island
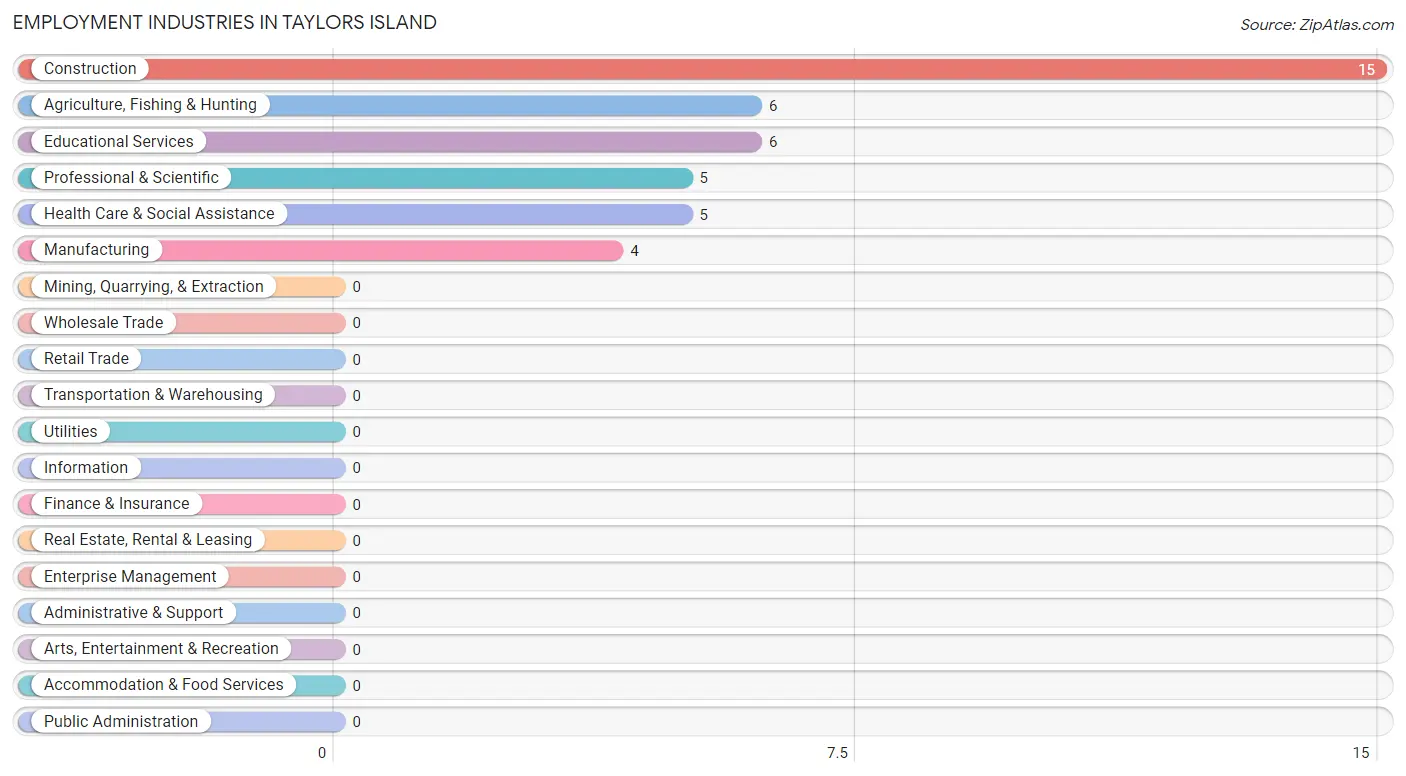
Employment Industries in Taylors Island
The major employment industries in Taylors Island include Construction (15 | 31.2%), Agriculture, Fishing & Hunting (6 | 12.5%), Educational Services (6 | 12.5%), Professional & Scientific (5 | 10.4%), and Health Care & Social Assistance (5 | 10.4%).
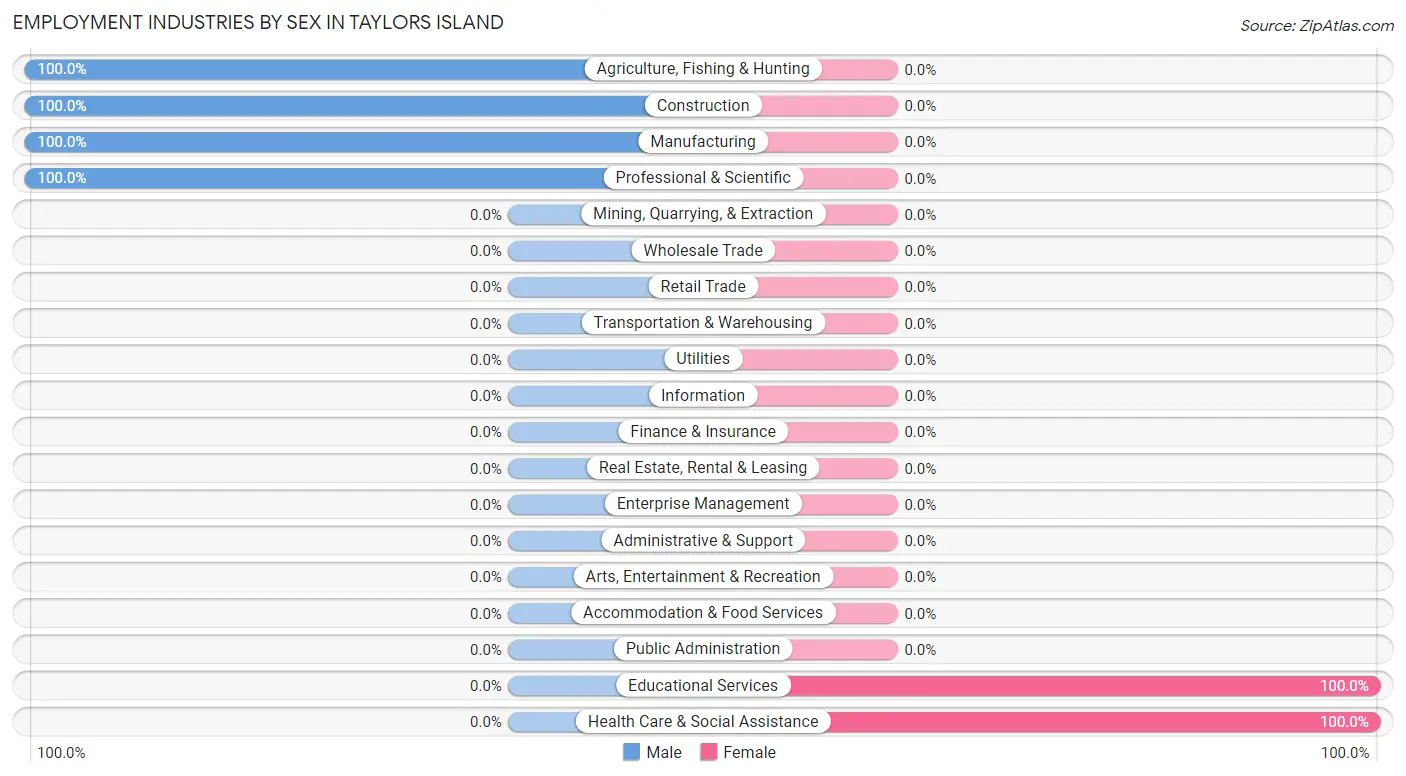
Employment Industries by Sex in Taylors Island
The Taylors Island industries that see more men than women are Agriculture, Fishing & Hunting (100.0%), Construction (100.0%), and Manufacturing (100.0%), whereas the industries that tend to have a higher number of women are Educational Services (100.0%), and Health Care & Social Assistance (100.0%).
| Industry | Male | Female |
| Agriculture, Fishing & Hunting | 6 (100.0%) | 0 (0.0%) |
| Mining, Quarrying, & Extraction | 0 (0.0%) | 0 (0.0%) |
| Construction | 15 (100.0%) | 0 (0.0%) |
| Manufacturing | 4 (100.0%) | 0 (0.0%) |
| Wholesale Trade | 0 (0.0%) | 0 (0.0%) |
| Retail Trade | 0 (0.0%) | 0 (0.0%) |
| Transportation & Warehousing | 0 (0.0%) | 0 (0.0%) |
| Utilities | 0 (0.0%) | 0 (0.0%) |
| Information | 0 (0.0%) | 0 (0.0%) |
| Finance & Insurance | 0 (0.0%) | 0 (0.0%) |
| Real Estate, Rental & Leasing | 0 (0.0%) | 0 (0.0%) |
| Professional & Scientific | 5 (100.0%) | 0 (0.0%) |
| Enterprise Management | 0 (0.0%) | 0 (0.0%) |
| Administrative & Support | 0 (0.0%) | 0 (0.0%) |
| Educational Services | 0 (0.0%) | 6 (100.0%) |
| Health Care & Social Assistance | 0 (0.0%) | 5 (100.0%) |
| Arts, Entertainment & Recreation | 0 (0.0%) | 0 (0.0%) |
| Accommodation & Food Services | 0 (0.0%) | 0 (0.0%) |
| Public Administration | 0 (0.0%) | 0 (0.0%) |
| Total | 30 (62.5%) | 18 (37.5%) |
Education in Taylors Island
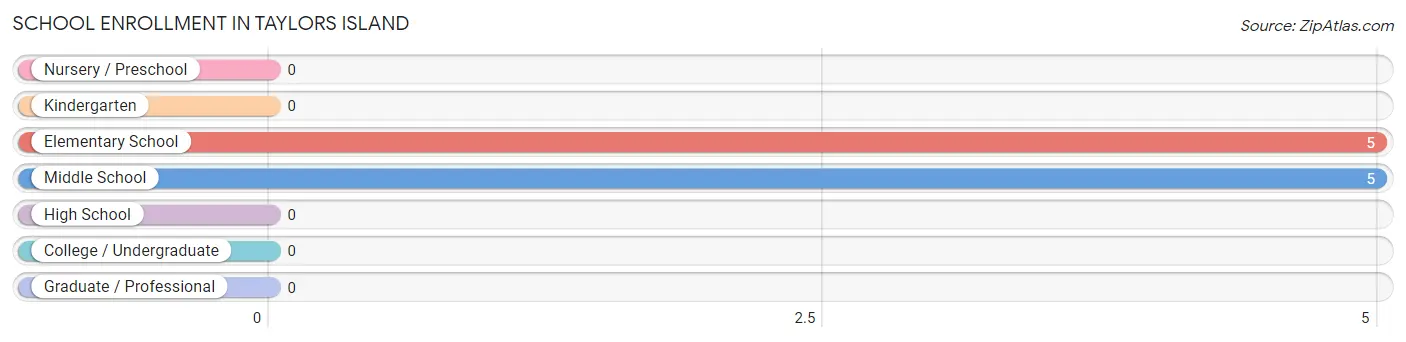
School Enrollment in Taylors Island
The most common levels of schooling among the 10 students in Taylors Island are elementary school (5 | 50.0%), and middle school (5 | 50.0%).
| School Level | # Students | % Students |
| Nursery / Preschool | 0 | 0.0% |
| Kindergarten | 0 | 0.0% |
| Elementary School | 5 | 50.0% |
| Middle School | 5 | 50.0% |
| High School | 0 | 0.0% |
| College / Undergraduate | 0 | 0.0% |
| Graduate / Professional | 0 | 0.0% |
| Total | 10 | 100.0% |
School Enrollment by Age by Funding Source in Taylors Island
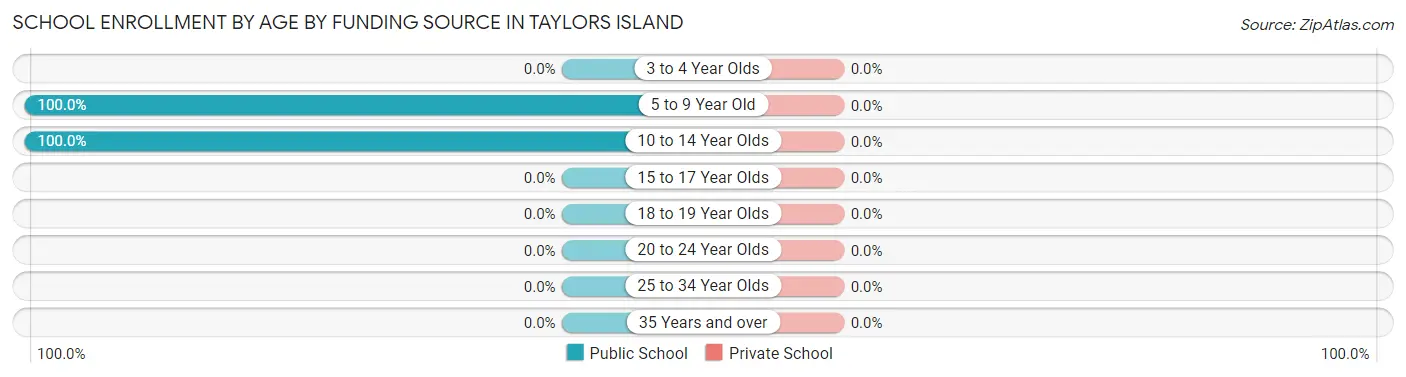
| Age Bracket | Public School | Private School |
| 3 to 4 Year Olds | 0 (0.0%) | 0 (0.0%) |
| 5 to 9 Year Old | 5 (100.0%) | 0 (0.0%) |
| 10 to 14 Year Olds | 5 (100.0%) | 0 (0.0%) |
| 15 to 17 Year Olds | 0 (0.0%) | 0 (0.0%) |
| 18 to 19 Year Olds | 0 (0.0%) | 0 (0.0%) |
| 20 to 24 Year Olds | 0 (0.0%) | 0 (0.0%) |
| 25 to 34 Year Olds | 0 (0.0%) | 0 (0.0%) |
| 35 Years and over | 0 (0.0%) | 0 (0.0%) |
| Total | 10 (100.0%) | 0 (0.0%) |
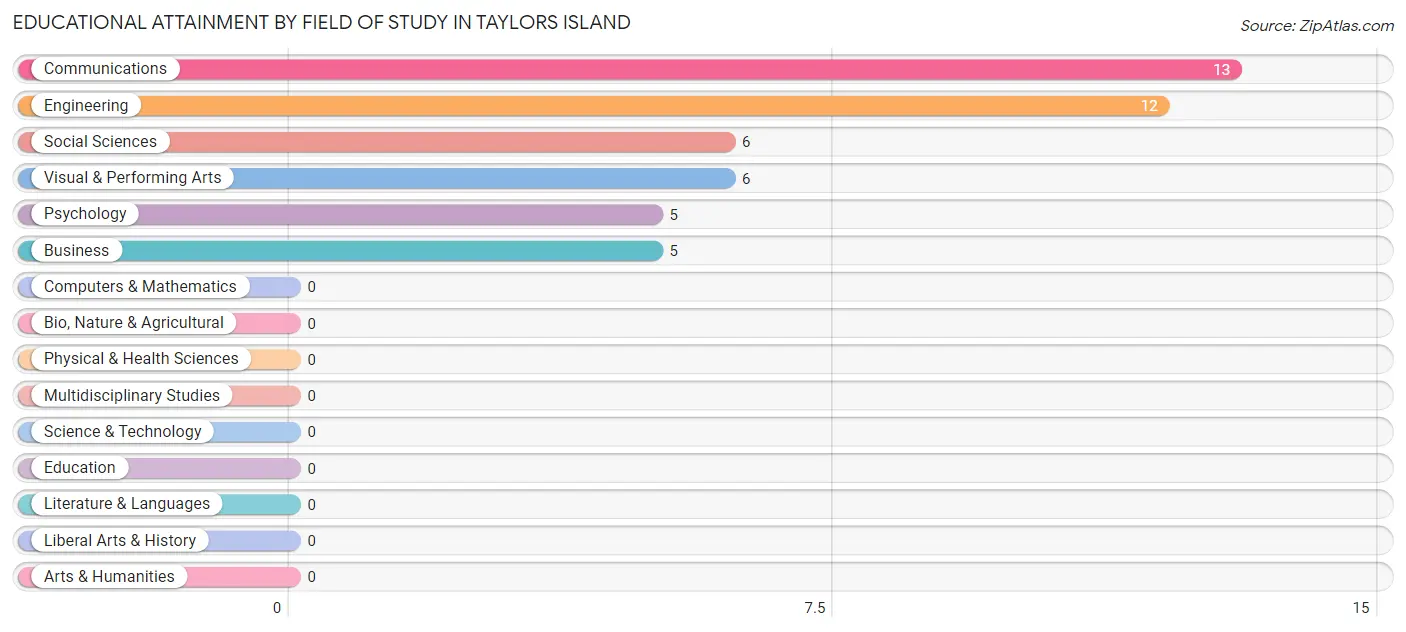
Educational Attainment by Field of Study in Taylors Island
Communications (13 | 27.7%), engineering (12 | 25.5%), social sciences (6 | 12.8%), visual & performing arts (6 | 12.8%), and psychology (5 | 10.6%) are the most common fields of study among 47 individuals in Taylors Island who have obtained a bachelor's degree or higher.
| Field of Study | # Graduates | % Graduates |
| Computers & Mathematics | 0 | 0.0% |
| Bio, Nature & Agricultural | 0 | 0.0% |
| Physical & Health Sciences | 0 | 0.0% |
| Psychology | 5 | 10.6% |
| Social Sciences | 6 | 12.8% |
| Engineering | 12 | 25.5% |
| Multidisciplinary Studies | 0 | 0.0% |
| Science & Technology | 0 | 0.0% |
| Business | 5 | 10.6% |
| Education | 0 | 0.0% |
| Literature & Languages | 0 | 0.0% |
| Liberal Arts & History | 0 | 0.0% |
| Visual & Performing Arts | 6 | 12.8% |
| Communications | 13 | 27.7% |
| Arts & Humanities | 0 | 0.0% |
| Total | 47 | 100.0% |
Transportation & Commute in Taylors Island
Vehicle Availability by Sex in Taylors Island
The most prevalent vehicle ownership categories in Taylors Island are males with 3 vehicles (24, accounting for 100.0%) and females with 3 vehicles (13, making up 133.3%).
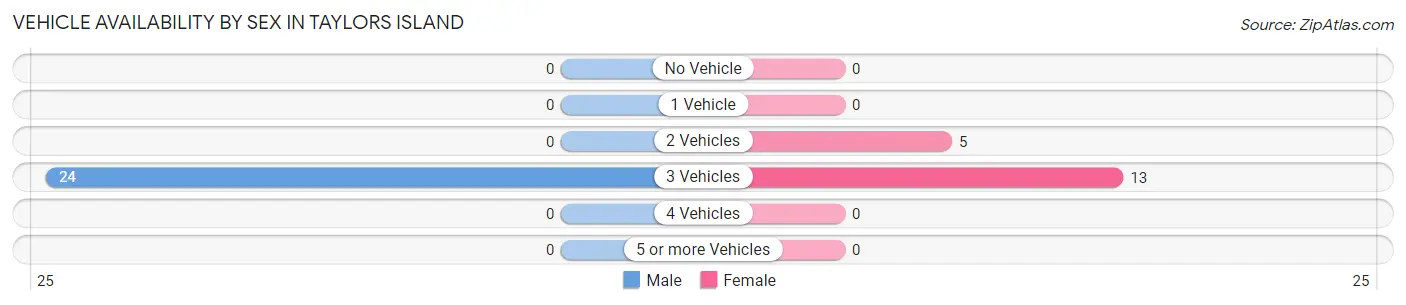
| Vehicles Available | Male | Female |
| No Vehicle | 0 (0.0%) | 0 (0.0%) |
| 1 Vehicle | 0 (0.0%) | 0 (0.0%) |
| 2 Vehicles | 0 (0.0%) | 5 (27.8%) |
| 3 Vehicles | 24 (100.0%) | 13 (72.2%) |
| 4 Vehicles | 0 (0.0%) | 0 (0.0%) |
| 5 or more Vehicles | 0 (0.0%) | 0 (0.0%) |
| Total | 24 (100.0%) | 18 (100.0%) |
Commute Time in Taylors Island
The most frequently occuring commute durations in Taylors Island are 10 to 14 minutes (12 commuters, 28.6%), 45 to 59 minutes (8 commuters, 19.1%), and 30 to 34 minutes (7 commuters, 16.7%).
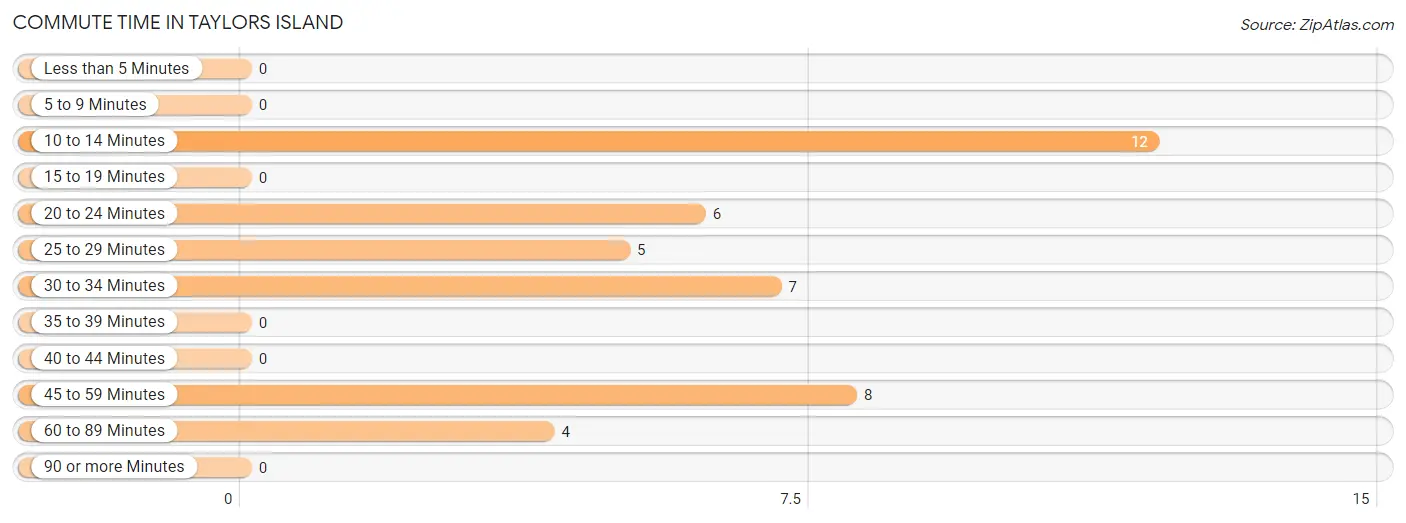
| Commute Time | # Commuters | % Commuters |
| Less than 5 Minutes | 0 | 0.0% |
| 5 to 9 Minutes | 0 | 0.0% |
| 10 to 14 Minutes | 12 | 28.6% |
| 15 to 19 Minutes | 0 | 0.0% |
| 20 to 24 Minutes | 6 | 14.3% |
| 25 to 29 Minutes | 5 | 11.9% |
| 30 to 34 Minutes | 7 | 16.7% |
| 35 to 39 Minutes | 0 | 0.0% |
| 40 to 44 Minutes | 0 | 0.0% |
| 45 to 59 Minutes | 8 | 19.1% |
| 60 to 89 Minutes | 4 | 9.5% |
| 90 or more Minutes | 0 | 0.0% |
Commute Time by Sex in Taylors Island
The most common commute times in Taylors Island are 45 to 59 minutes (8 commuters, 33.3%) for males and 10 to 14 minutes (7 commuters, 38.9%) for females.
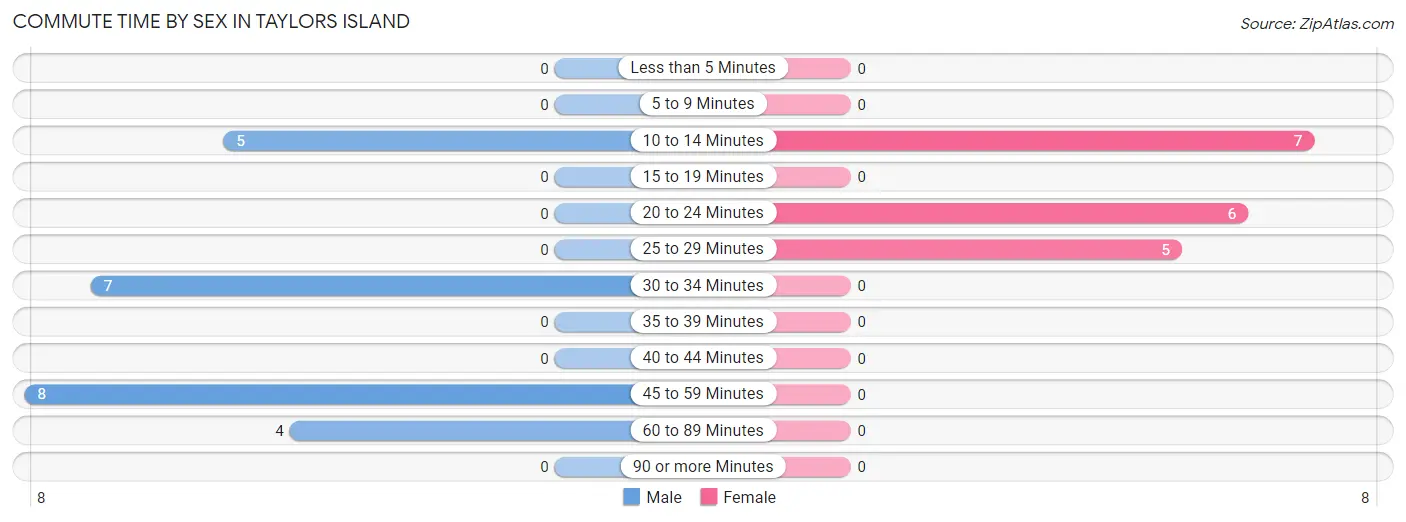
| Commute Time | Male | Female |
| Less than 5 Minutes | 0 (0.0%) | 0 (0.0%) |
| 5 to 9 Minutes | 0 (0.0%) | 0 (0.0%) |
| 10 to 14 Minutes | 5 (20.8%) | 7 (38.9%) |
| 15 to 19 Minutes | 0 (0.0%) | 0 (0.0%) |
| 20 to 24 Minutes | 0 (0.0%) | 6 (33.3%) |
| 25 to 29 Minutes | 0 (0.0%) | 5 (27.8%) |
| 30 to 34 Minutes | 7 (29.2%) | 0 (0.0%) |
| 35 to 39 Minutes | 0 (0.0%) | 0 (0.0%) |
| 40 to 44 Minutes | 0 (0.0%) | 0 (0.0%) |
| 45 to 59 Minutes | 8 (33.3%) | 0 (0.0%) |
| 60 to 89 Minutes | 4 (16.7%) | 0 (0.0%) |
| 90 or more Minutes | 0 (0.0%) | 0 (0.0%) |
Time of Departure to Work by Sex in Taylors Island
The most frequent times of departure to work in Taylors Island are 7:00 AM to 7:29 AM (15, 62.5%) for males and 9:00 AM to 9:59 AM (7, 38.9%) for females.
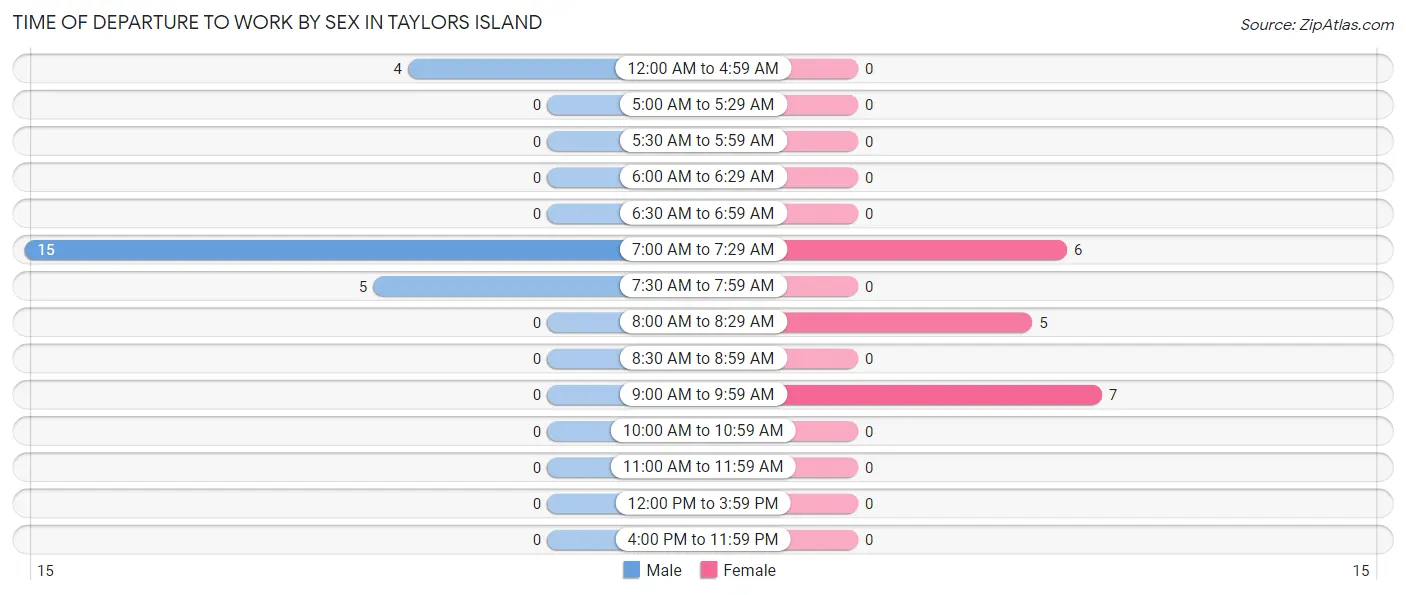
| Time of Departure | Male | Female |
| 12:00 AM to 4:59 AM | 4 (16.7%) | 0 (0.0%) |
| 5:00 AM to 5:29 AM | 0 (0.0%) | 0 (0.0%) |
| 5:30 AM to 5:59 AM | 0 (0.0%) | 0 (0.0%) |
| 6:00 AM to 6:29 AM | 0 (0.0%) | 0 (0.0%) |
| 6:30 AM to 6:59 AM | 0 (0.0%) | 0 (0.0%) |
| 7:00 AM to 7:29 AM | 15 (62.5%) | 6 (33.3%) |
| 7:30 AM to 7:59 AM | 5 (20.8%) | 0 (0.0%) |
| 8:00 AM to 8:29 AM | 0 (0.0%) | 5 (27.8%) |
| 8:30 AM to 8:59 AM | 0 (0.0%) | 0 (0.0%) |
| 9:00 AM to 9:59 AM | 0 (0.0%) | 7 (38.9%) |
| 10:00 AM to 10:59 AM | 0 (0.0%) | 0 (0.0%) |
| 11:00 AM to 11:59 AM | 0 (0.0%) | 0 (0.0%) |
| 12:00 PM to 3:59 PM | 0 (0.0%) | 0 (0.0%) |
| 4:00 PM to 11:59 PM | 0 (0.0%) | 0 (0.0%) |
| Total | 24 (100.0%) | 18 (100.0%) |
Housing Occupancy in Taylors Island
Occupancy by Ownership in Taylors Island
Of the total 58 dwellings in Taylors Island, owner-occupied units account for 58 (100.0%), while renter-occupied units make up 0 (0.0%).
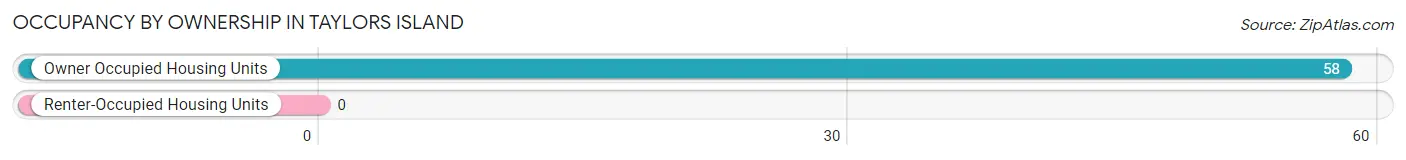
| Occupancy | # Housing Units | % Housing Units |
| Owner Occupied Housing Units | 58 | 100.0% |
| Renter-Occupied Housing Units | 0 | 0.0% |
| Total Occupied Housing Units | 58 | 100.0% |
Occupancy by Household Size in Taylors Island
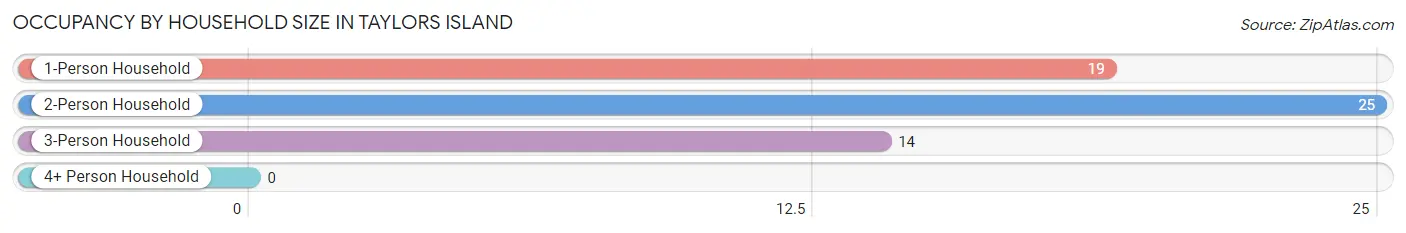
| Household Size | # Housing Units | % Housing Units |
| 1-Person Household | 19 | 32.8% |
| 2-Person Household | 25 | 43.1% |
| 3-Person Household | 14 | 24.1% |
| 4+ Person Household | 0 | 0.0% |
| Total Housing Units | 58 | 100.0% |
Occupancy by Ownership by Household Size in Taylors Island
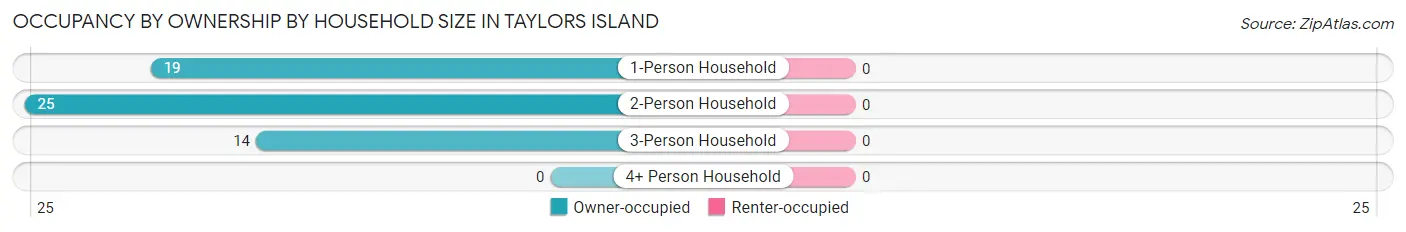
| Household Size | Owner-occupied | Renter-occupied |
| 1-Person Household | 19 (100.0%) | 0 (0.0%) |
| 2-Person Household | 25 (100.0%) | 0 (0.0%) |
| 3-Person Household | 14 (100.0%) | 0 (0.0%) |
| 4+ Person Household | 0 (0.0%) | 0 (0.0%) |
| Total Housing Units | 58 (100.0%) | 0 (0.0%) |
Occupancy by Educational Attainment in Taylors Island
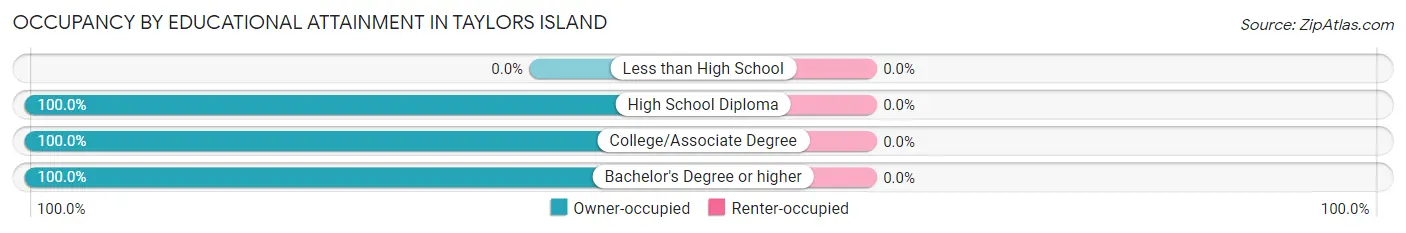
| Household Size | Owner-occupied | Renter-occupied |
| Less than High School | 0 (0.0%) | 0 (0.0%) |
| High School Diploma | 21 (100.0%) | 0 (0.0%) |
| College/Associate Degree | 14 (100.0%) | 0 (0.0%) |
| Bachelor's Degree or higher | 23 (100.0%) | 0 (0.0%) |
Occupancy by Age of Householder in Taylors Island
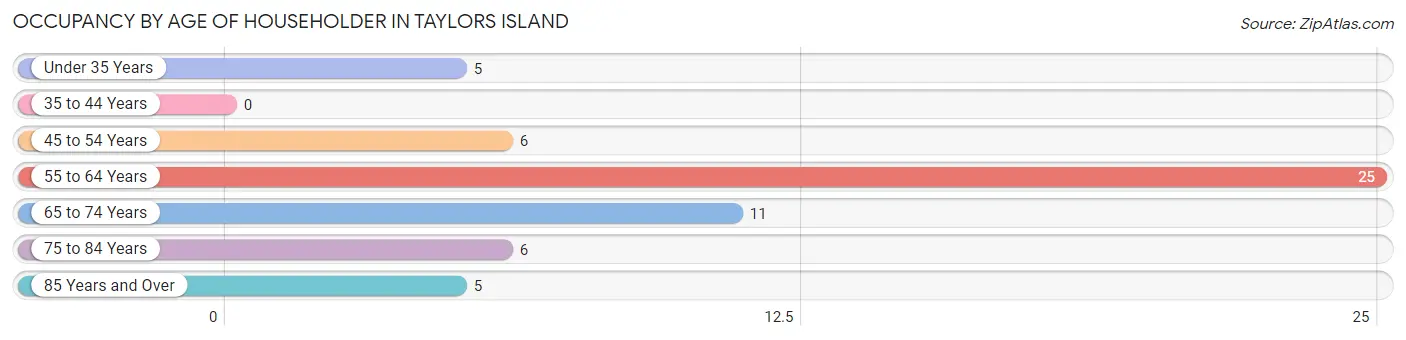
| Age Bracket | # Households | % Households |
| Under 35 Years | 5 | 8.6% |
| 35 to 44 Years | 0 | 0.0% |
| 45 to 54 Years | 6 | 10.3% |
| 55 to 64 Years | 25 | 43.1% |
| 65 to 74 Years | 11 | 19.0% |
| 75 to 84 Years | 6 | 10.3% |
| 85 Years and Over | 5 | 8.6% |
| Total | 58 | 100.0% |
Housing Finances in Taylors Island
Median Income by Occupancy in Taylors Island
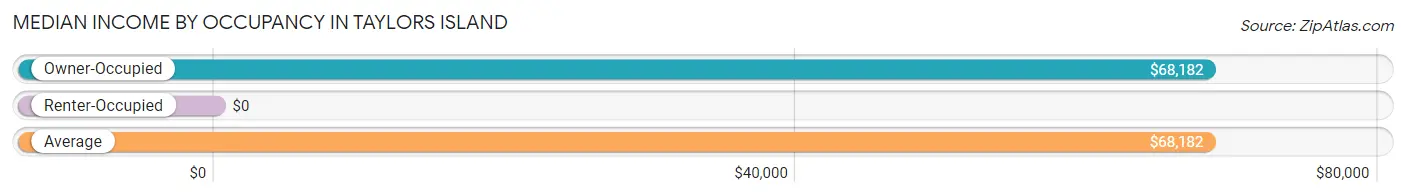
| Occupancy Type | # Households | Median Income |
| Owner-Occupied | 58 (100.0%) | $68,182 |
| Renter-Occupied | 0 (0.0%) | $0 |
| Average | 58 (100.0%) | $68,182 |
Occupancy by Householder Income Bracket in Taylors Island
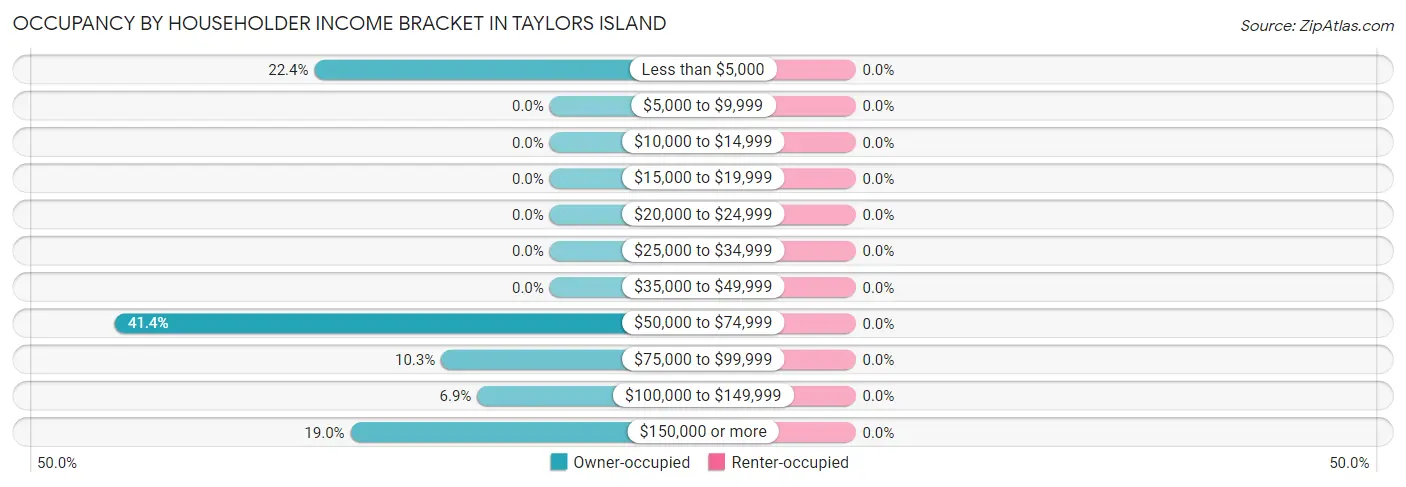
| Income Bracket | Owner-occupied | Renter-occupied |
| Less than $5,000 | 13 (22.4%) | 0 (0.0%) |
| $5,000 to $9,999 | 0 (0.0%) | 0 (0.0%) |
| $10,000 to $14,999 | 0 (0.0%) | 0 (0.0%) |
| $15,000 to $19,999 | 0 (0.0%) | 0 (0.0%) |
| $20,000 to $24,999 | 0 (0.0%) | 0 (0.0%) |
| $25,000 to $34,999 | 0 (0.0%) | 0 (0.0%) |
| $35,000 to $49,999 | 0 (0.0%) | 0 (0.0%) |
| $50,000 to $74,999 | 24 (41.4%) | 0 (0.0%) |
| $75,000 to $99,999 | 6 (10.3%) | 0 (0.0%) |
| $100,000 to $149,999 | 4 (6.9%) | 0 (0.0%) |
| $150,000 or more | 11 (19.0%) | 0 (0.0%) |
| Total | 58 (100.0%) | 0 (0.0%) |
Monthly Housing Cost Tiers in Taylors Island
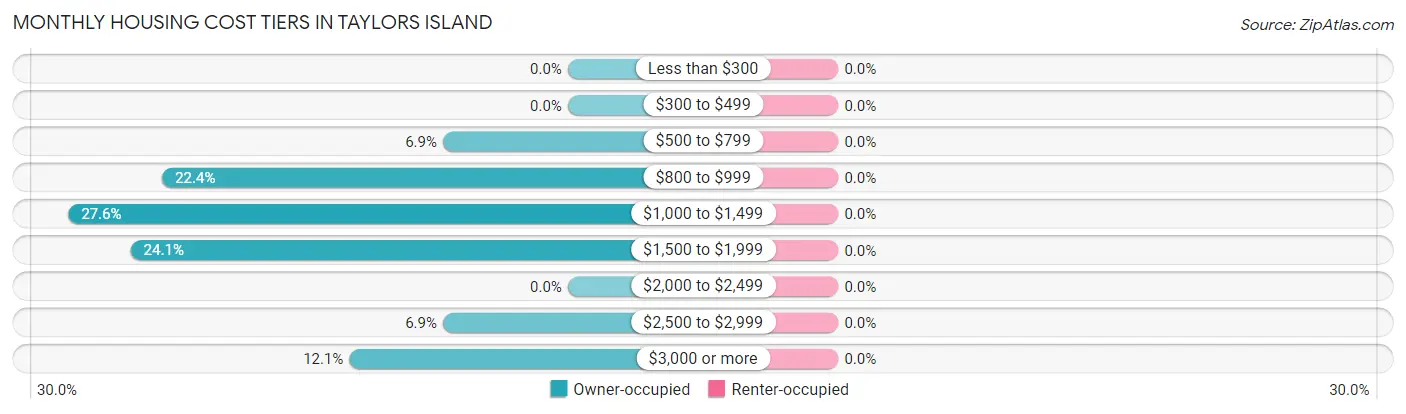
| Monthly Cost | Owner-occupied | Renter-occupied |
| Less than $300 | 0 (0.0%) | 0 (0.0%) |
| $300 to $499 | 0 (0.0%) | 0 (0.0%) |
| $500 to $799 | 4 (6.9%) | 0 (0.0%) |
| $800 to $999 | 13 (22.4%) | 0 (0.0%) |
| $1,000 to $1,499 | 16 (27.6%) | 0 (0.0%) |
| $1,500 to $1,999 | 14 (24.1%) | 0 (0.0%) |
| $2,000 to $2,499 | 0 (0.0%) | 0 (0.0%) |
| $2,500 to $2,999 | 4 (6.9%) | 0 (0.0%) |
| $3,000 or more | 7 (12.1%) | 0 (0.0%) |
| Total | 58 (100.0%) | 0 (0.0%) |
Physical Housing Characteristics in Taylors Island
Housing Structures in Taylors Island
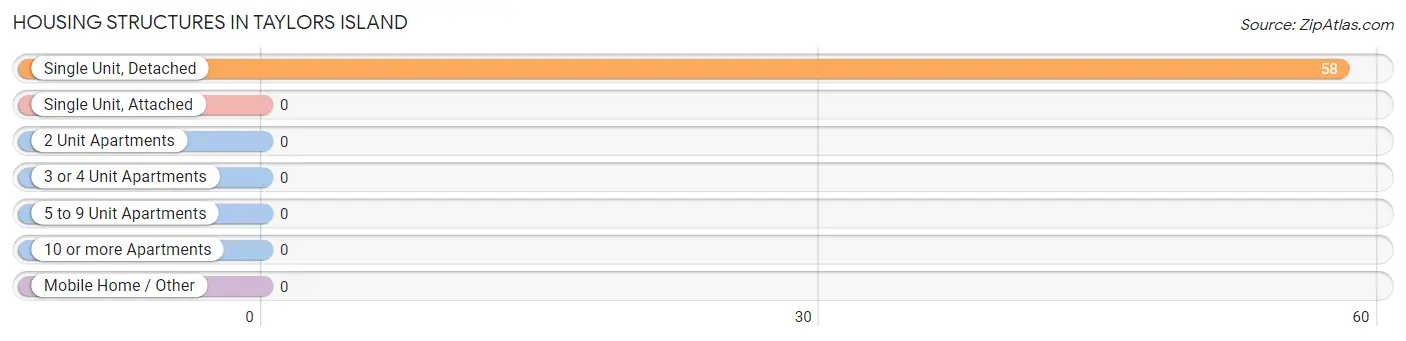
| Structure Type | # Housing Units | % Housing Units |
| Single Unit, Detached | 58 | 100.0% |
| Single Unit, Attached | 0 | 0.0% |
| 2 Unit Apartments | 0 | 0.0% |
| 3 or 4 Unit Apartments | 0 | 0.0% |
| 5 to 9 Unit Apartments | 0 | 0.0% |
| 10 or more Apartments | 0 | 0.0% |
| Mobile Home / Other | 0 | 0.0% |
| Total | 58 | 100.0% |
Housing Structures by Occupancy in Taylors Island
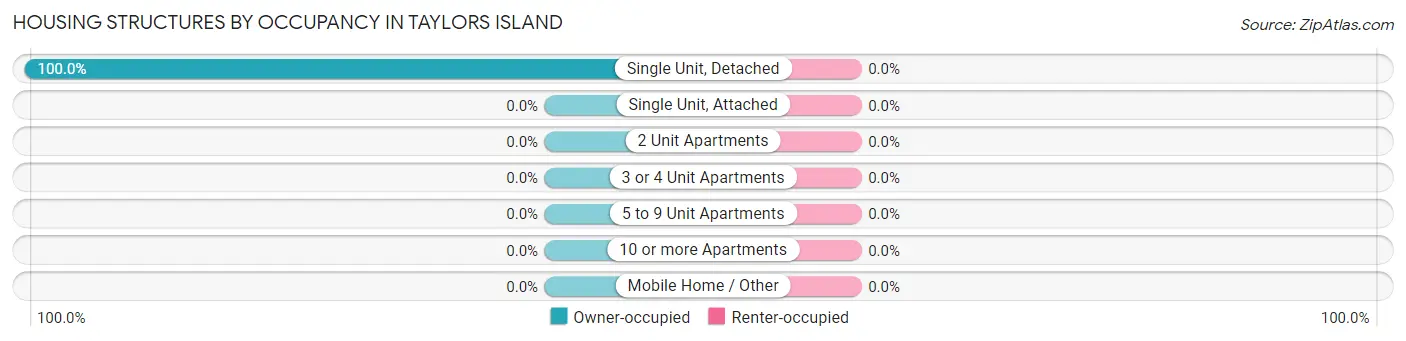
| Structure Type | Owner-occupied | Renter-occupied |
| Single Unit, Detached | 58 (100.0%) | 0 (0.0%) |
| Single Unit, Attached | 0 (0.0%) | 0 (0.0%) |
| 2 Unit Apartments | 0 (0.0%) | 0 (0.0%) |
| 3 or 4 Unit Apartments | 0 (0.0%) | 0 (0.0%) |
| 5 to 9 Unit Apartments | 0 (0.0%) | 0 (0.0%) |
| 10 or more Apartments | 0 (0.0%) | 0 (0.0%) |
| Mobile Home / Other | 0 (0.0%) | 0 (0.0%) |
| Total | 58 (100.0%) | 0 (0.0%) |
Housing Structures by Number of Rooms in Taylors Island
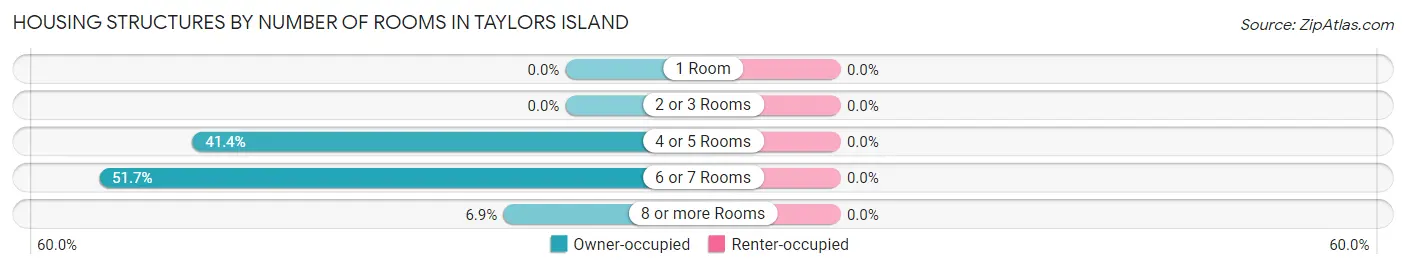
| Number of Rooms | Owner-occupied | Renter-occupied |
| 1 Room | 0 (0.0%) | 0 (0.0%) |
| 2 or 3 Rooms | 0 (0.0%) | 0 (0.0%) |
| 4 or 5 Rooms | 24 (41.4%) | 0 (0.0%) |
| 6 or 7 Rooms | 30 (51.7%) | 0 (0.0%) |
| 8 or more Rooms | 4 (6.9%) | 0 (0.0%) |
| Total | 58 (100.0%) | 0 (0.0%) |
Housing Structure by Heating Type in Taylors Island
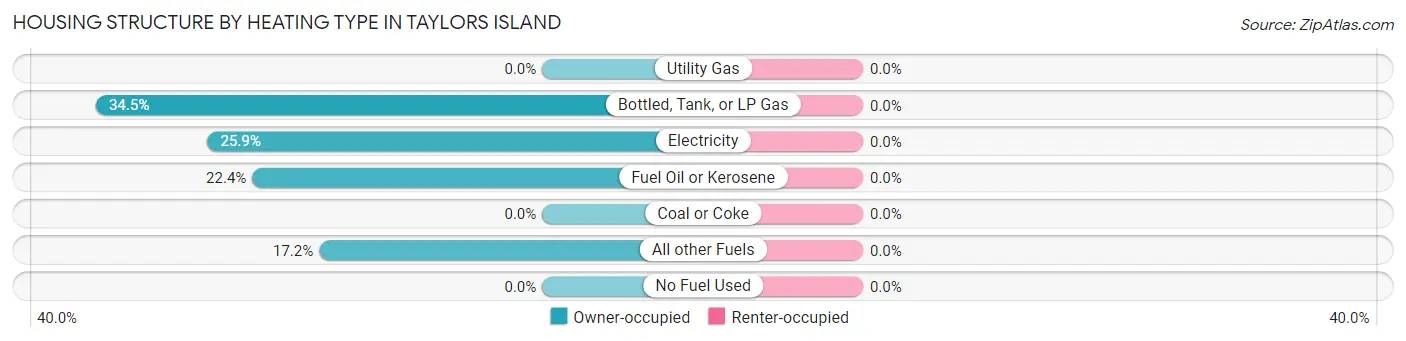
| Heating Type | Owner-occupied | Renter-occupied |
| Utility Gas | 0 (0.0%) | 0 (0.0%) |
| Bottled, Tank, or LP Gas | 20 (34.5%) | 0 (0.0%) |
| Electricity | 15 (25.9%) | 0 (0.0%) |
| Fuel Oil or Kerosene | 13 (22.4%) | 0 (0.0%) |
| Coal or Coke | 0 (0.0%) | 0 (0.0%) |
| All other Fuels | 10 (17.2%) | 0 (0.0%) |
| No Fuel Used | 0 (0.0%) | 0 (0.0%) |
| Total | 58 (100.0%) | 0 (0.0%) |
Household Vehicle Usage in Taylors Island
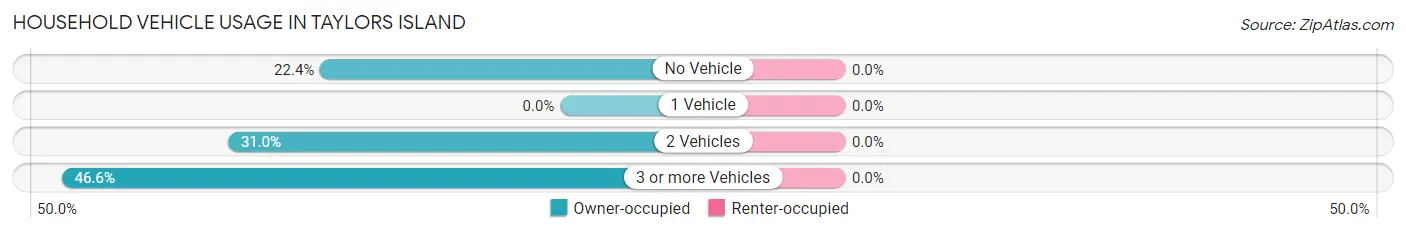
| Vehicles per Household | Owner-occupied | Renter-occupied |
| No Vehicle | 13 (22.4%) | 0 (0.0%) |
| 1 Vehicle | 0 (0.0%) | 0 (0.0%) |
| 2 Vehicles | 18 (31.0%) | 0 (0.0%) |
| 3 or more Vehicles | 27 (46.6%) | 0 (0.0%) |
| Total | 58 (100.0%) | 0 (0.0%) |
Real Estate & Mortgages in Taylors Island
Real Estate and Mortgage Overview in Taylors Island
| Characteristic | Without Mortgage | With Mortgage |
| Housing Units | 28 | 30 |
| Median Property Value | $1,055,600 | $266,700 |
| Median Household Income | - | - |
| Monthly Housing Costs | $977 | $7 |
| Real Estate Taxes | $4,417 | $0 |
Property Value by Mortgage Status in Taylors Island
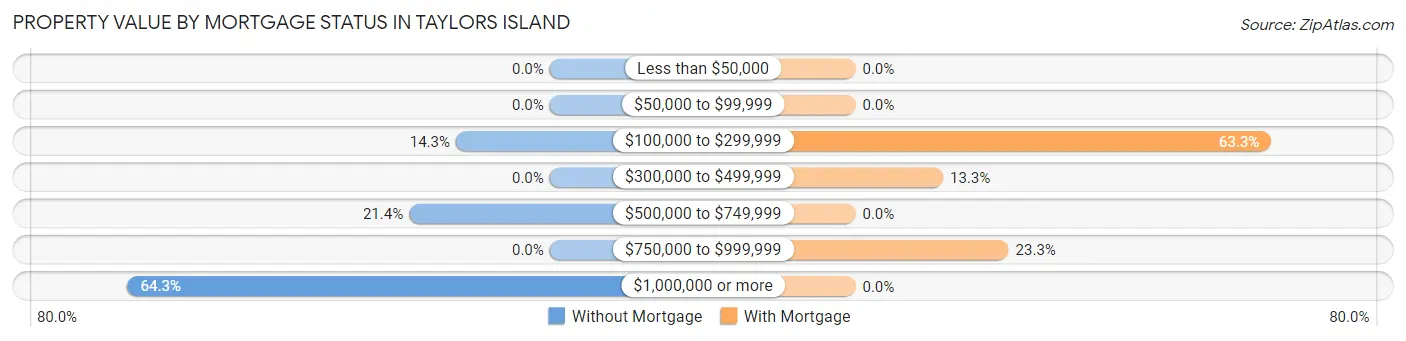
| Property Value | Without Mortgage | With Mortgage |
| Less than $50,000 | 0 (0.0%) | 0 (0.0%) |
| $50,000 to $99,999 | 0 (0.0%) | 0 (0.0%) |
| $100,000 to $299,999 | 4 (14.3%) | 19 (63.3%) |
| $300,000 to $499,999 | 0 (0.0%) | 4 (13.3%) |
| $500,000 to $749,999 | 6 (21.4%) | 0 (0.0%) |
| $750,000 to $999,999 | 0 (0.0%) | 7 (23.3%) |
| $1,000,000 or more | 18 (64.3%) | 0 (0.0%) |
| Total | 28 (100.0%) | 30 (100.0%) |
Household Income by Mortgage Status in Taylors Island
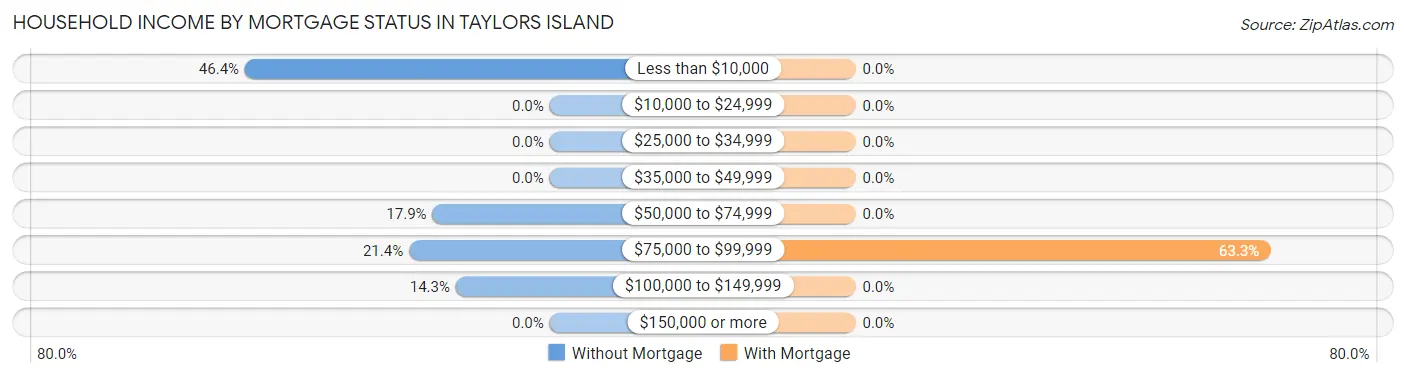
| Household Income | Without Mortgage | With Mortgage |
| Less than $10,000 | 13 (46.4%) | 0 (0.0%) |
| $10,000 to $24,999 | 0 (0.0%) | 0 (0.0%) |
| $25,000 to $34,999 | 0 (0.0%) | 0 (0.0%) |
| $35,000 to $49,999 | 0 (0.0%) | 0 (0.0%) |
| $50,000 to $74,999 | 5 (17.9%) | 0 (0.0%) |
| $75,000 to $99,999 | 6 (21.4%) | 19 (63.3%) |
| $100,000 to $149,999 | 4 (14.3%) | 0 (0.0%) |
| $150,000 or more | 0 (0.0%) | 0 (0.0%) |
| Total | 28 (100.0%) | 30 (100.0%) |
Property Value to Household Income Ratio in Taylors Island
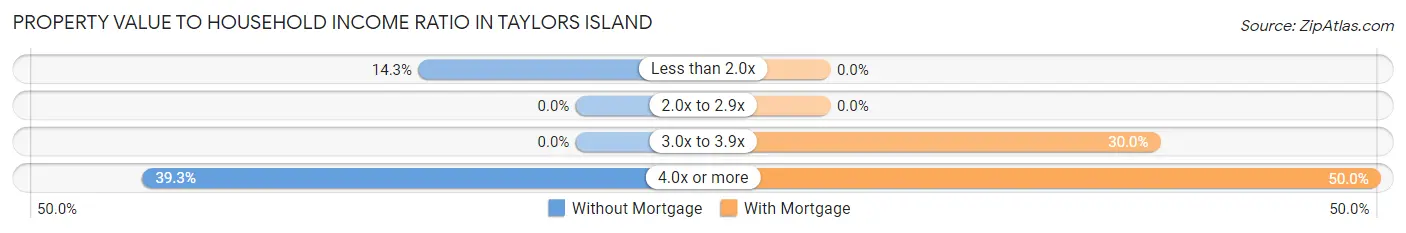
| Value-to-Income Ratio | Without Mortgage | With Mortgage |
| Less than 2.0x | 4 (14.3%) | 0 (0.0%) |
| 2.0x to 2.9x | 0 (0.0%) | 0 (0.0%) |
| 3.0x to 3.9x | 0 (0.0%) | 9 (30.0%) |
| 4.0x or more | 11 (39.3%) | 15 (50.0%) |
| Total | 28 (100.0%) | 30 (100.0%) |
Real Estate Taxes by Mortgage Status in Taylors Island
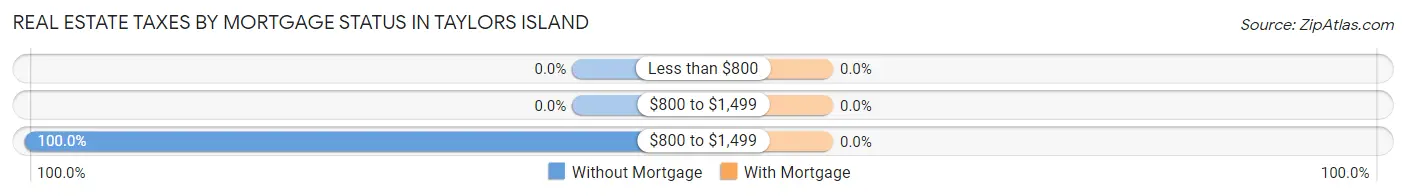
| Property Taxes | Without Mortgage | With Mortgage |
| Less than $800 | 0 (0.0%) | 0 (0.0%) |
| $800 to $1,499 | 0 (0.0%) | 0 (0.0%) |
| $800 to $1,499 | 28 (100.0%) | 0 (0.0%) |
| Total | 28 (100.0%) | 30 (100.0%) |
Health & Disability in Taylors Island
Health Insurance Coverage by Age in Taylors Island
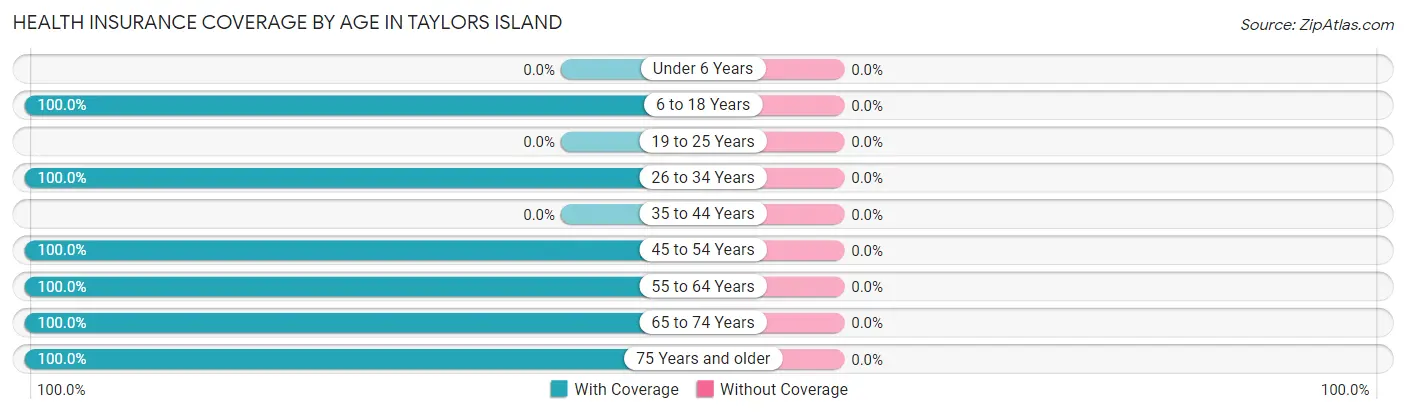
| Age Bracket | With Coverage | Without Coverage |
| Under 6 Years | 0 (0.0%) | 0 (0.0%) |
| 6 to 18 Years | 10 (100.0%) | 0 (0.0%) |
| 19 to 25 Years | 0 (0.0%) | 0 (0.0%) |
| 26 to 34 Years | 11 (100.0%) | 0 (0.0%) |
| 35 to 44 Years | 0 (0.0%) | 0 (0.0%) |
| 45 to 54 Years | 13 (100.0%) | 0 (0.0%) |
| 55 to 64 Years | 29 (100.0%) | 0 (0.0%) |
| 65 to 74 Years | 35 (100.0%) | 0 (0.0%) |
| 75 Years and older | 11 (100.0%) | 0 (0.0%) |
| Total | 109 (100.0%) | 0 (0.0%) |
Health Insurance Coverage by Citizenship Status in Taylors Island
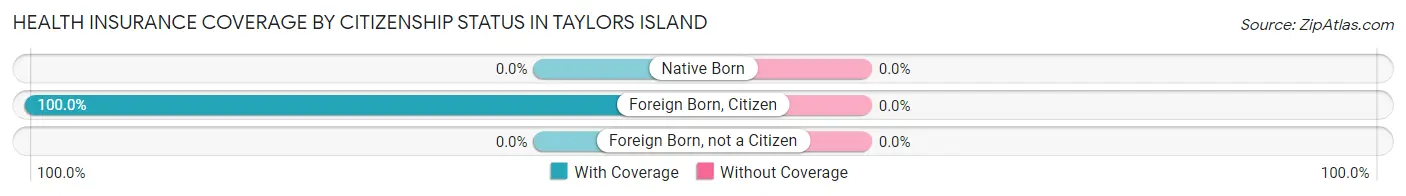
| Citizenship Status | With Coverage | Without Coverage |
| Native Born | 0 (0.0%) | 0 (0.0%) |
| Foreign Born, Citizen | 10 (100.0%) | 0 (0.0%) |
| Foreign Born, not a Citizen | 0 (0.0%) | 0 (0.0%) |
Health Insurance Coverage by Household Income in Taylors Island
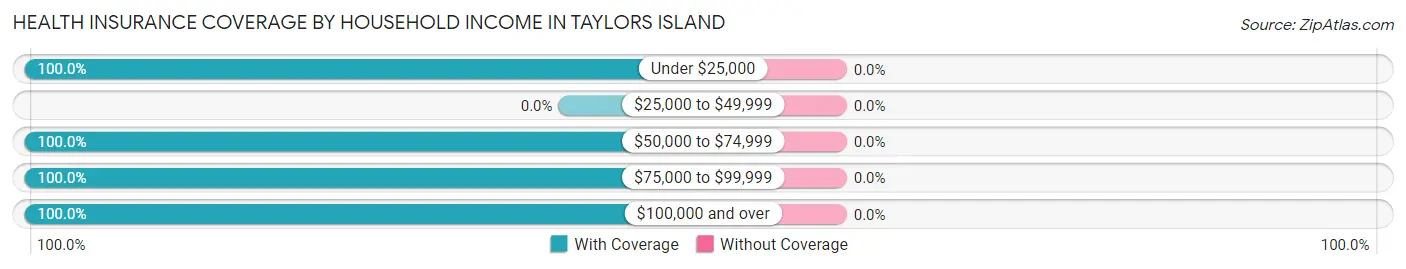
| Household Income | With Coverage | Without Coverage |
| Under $25,000 | 13 (100.0%) | 0 (0.0%) |
| $25,000 to $49,999 | 0 (0.0%) | 0 (0.0%) |
| $50,000 to $74,999 | 60 (100.0%) | 0 (0.0%) |
| $75,000 to $99,999 | 6 (100.0%) | 0 (0.0%) |
| $100,000 and over | 30 (100.0%) | 0 (0.0%) |
Public vs Private Health Insurance Coverage by Age in Taylors Island
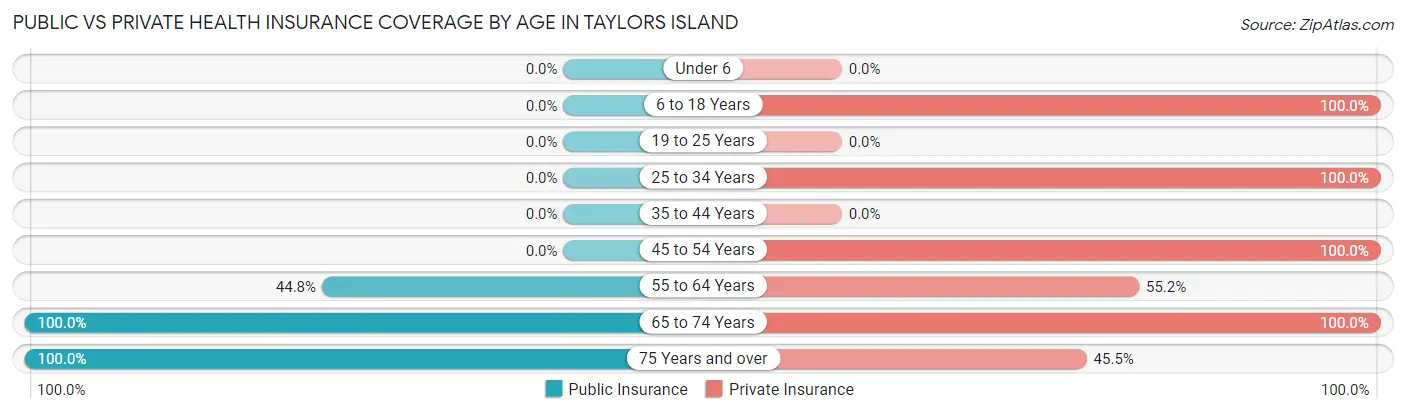
| Age Bracket | Public Insurance | Private Insurance |
| Under 6 | 0 (0.0%) | 0 (0.0%) |
| 6 to 18 Years | 0 (0.0%) | 10 (100.0%) |
| 19 to 25 Years | 0 (0.0%) | 0 (0.0%) |
| 25 to 34 Years | 0 (0.0%) | 11 (100.0%) |
| 35 to 44 Years | 0 (0.0%) | 0 (0.0%) |
| 45 to 54 Years | 0 (0.0%) | 13 (100.0%) |
| 55 to 64 Years | 13 (44.8%) | 16 (55.2%) |
| 65 to 74 Years | 35 (100.0%) | 35 (100.0%) |
| 75 Years and over | 11 (100.0%) | 5 (45.5%) |
| Total | 59 (54.1%) | 90 (82.6%) |
Disability Status by Sex by Age in Taylors Island
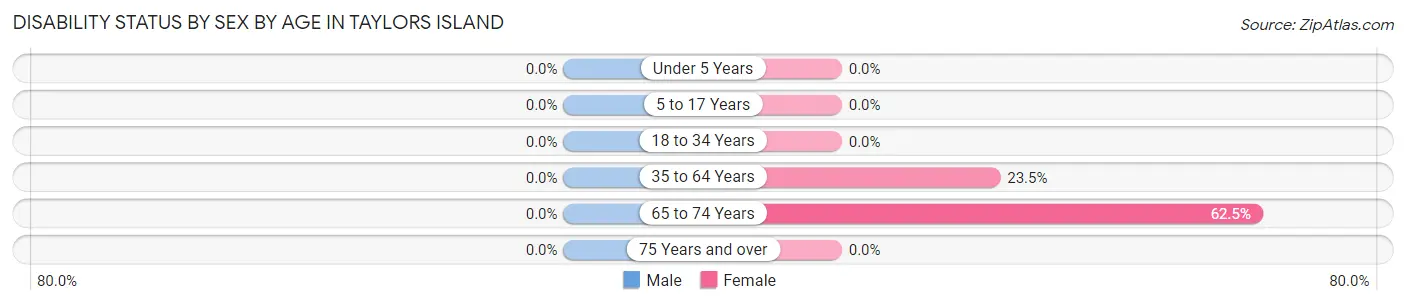
| Age Bracket | Male | Female |
| Under 5 Years | 0 (0.0%) | 0 (0.0%) |
| 5 to 17 Years | 0 (0.0%) | 0 (0.0%) |
| 18 to 34 Years | 0 (0.0%) | 0 (0.0%) |
| 35 to 64 Years | 0 (0.0%) | 4 (23.5%) |
| 65 to 74 Years | 0 (0.0%) | 10 (62.5%) |
| 75 Years and over | 0 (0.0%) | 0 (0.0%) |
Disability Class by Sex by Age in Taylors Island
Disability Class: Hearing Difficulty
| Age Bracket | Male | Female |
| Under 5 Years | 0 (0.0%) | 0 (0.0%) |
| 5 to 17 Years | 0 (0.0%) | 0 (0.0%) |
| 18 to 34 Years | 0 (0.0%) | 0 (0.0%) |
| 35 to 64 Years | 0 (0.0%) | 0 (0.0%) |
| 65 to 74 Years | 0 (0.0%) | 0 (0.0%) |
| 75 Years and over | 0 (0.0%) | 0 (0.0%) |
Disability Class: Vision Difficulty
| Age Bracket | Male | Female |
| Under 5 Years | 0 (0.0%) | 0 (0.0%) |
| 5 to 17 Years | 0 (0.0%) | 0 (0.0%) |
| 18 to 34 Years | 0 (0.0%) | 0 (0.0%) |
| 35 to 64 Years | 0 (0.0%) | 0 (0.0%) |
| 65 to 74 Years | 0 (0.0%) | 0 (0.0%) |
| 75 Years and over | 0 (0.0%) | 0 (0.0%) |
Disability Class: Cognitive Difficulty
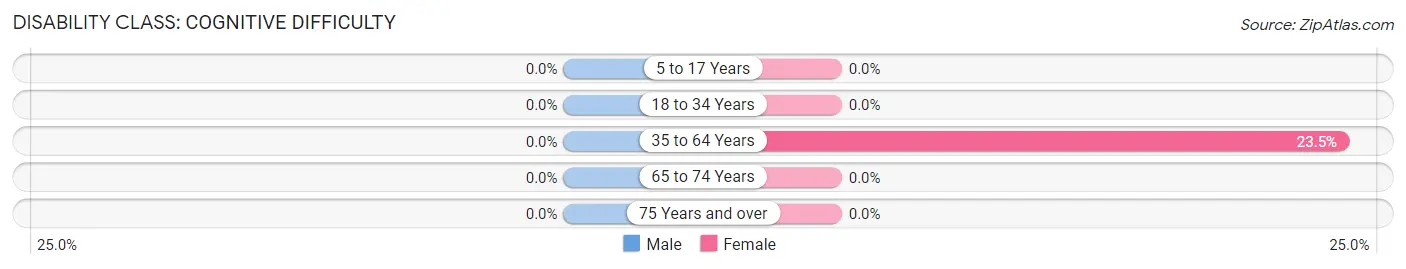
| Age Bracket | Male | Female |
| 5 to 17 Years | 0 (0.0%) | 0 (0.0%) |
| 18 to 34 Years | 0 (0.0%) | 0 (0.0%) |
| 35 to 64 Years | 0 (0.0%) | 4 (23.5%) |
| 65 to 74 Years | 0 (0.0%) | 0 (0.0%) |
| 75 Years and over | 0 (0.0%) | 0 (0.0%) |
Disability Class: Ambulatory Difficulty
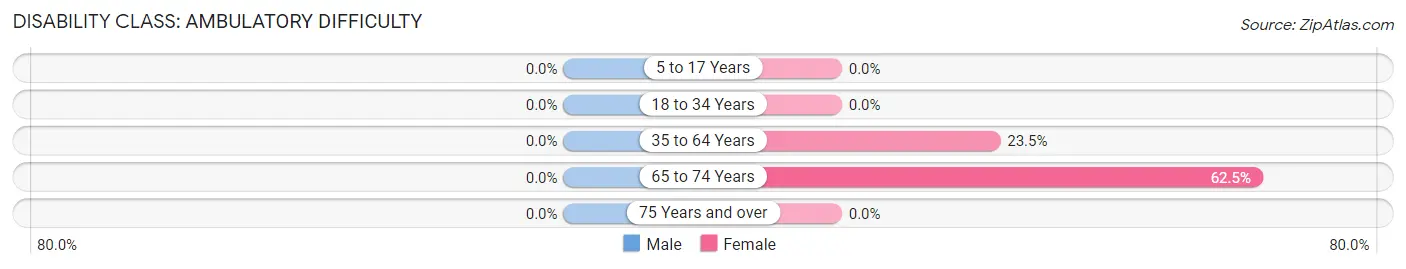
| Age Bracket | Male | Female |
| 5 to 17 Years | 0 (0.0%) | 0 (0.0%) |
| 18 to 34 Years | 0 (0.0%) | 0 (0.0%) |
| 35 to 64 Years | 0 (0.0%) | 4 (23.5%) |
| 65 to 74 Years | 0 (0.0%) | 10 (62.5%) |
| 75 Years and over | 0 (0.0%) | 0 (0.0%) |
Disability Class: Self-Care Difficulty
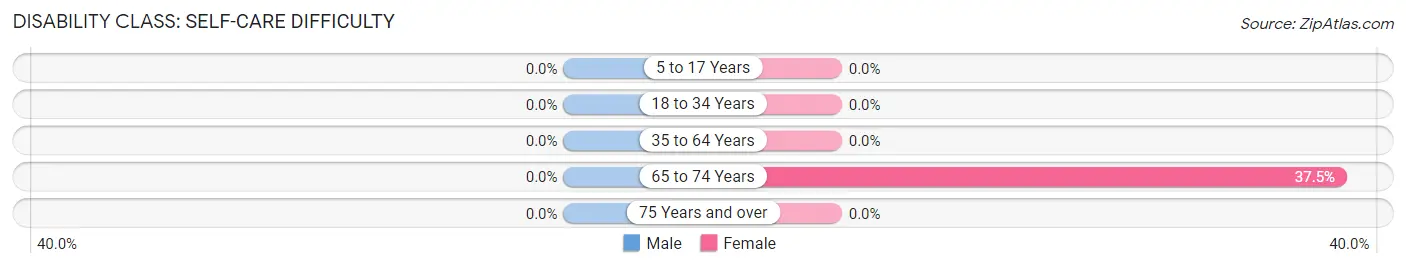
| Age Bracket | Male | Female |
| 5 to 17 Years | 0 (0.0%) | 0 (0.0%) |
| 18 to 34 Years | 0 (0.0%) | 0 (0.0%) |
| 35 to 64 Years | 0 (0.0%) | 0 (0.0%) |
| 65 to 74 Years | 0 (0.0%) | 6 (37.5%) |
| 75 Years and over | 0 (0.0%) | 0 (0.0%) |
Technology Access in Taylors Island
Computing Device Access in Taylors Island
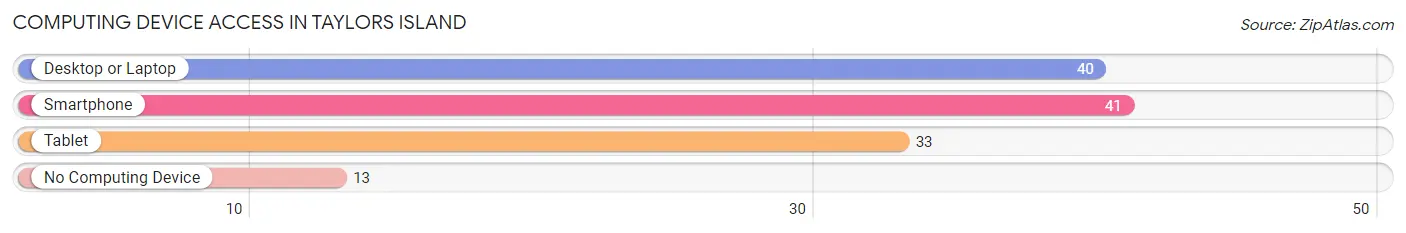
| Device Type | # Households | % Households |
| Desktop or Laptop | 40 | 69.0% |
| Smartphone | 41 | 70.7% |
| Tablet | 33 | 56.9% |
| No Computing Device | 13 | 22.4% |
| Total | 58 | 100.0% |
Internet Access in Taylors Island
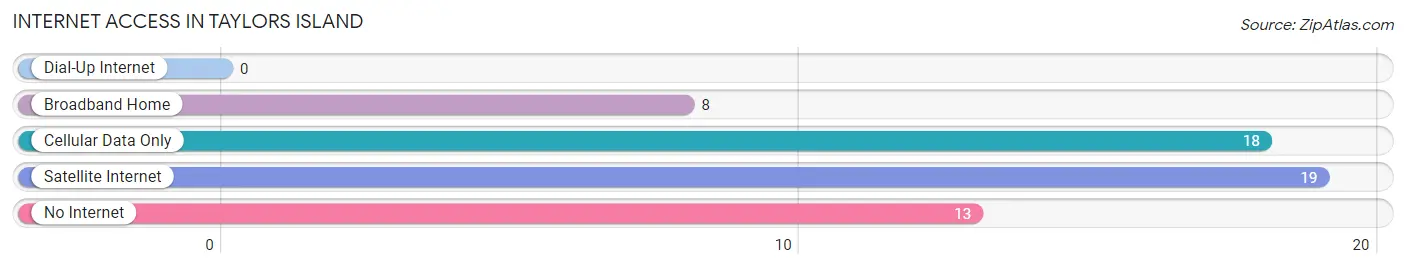
| Internet Type | # Households | % Households |
| Dial-Up Internet | 0 | 0.0% |
| Broadband Home | 8 | 13.8% |
| Cellular Data Only | 18 | 31.0% |
| Satellite Internet | 19 | 32.8% |
| No Internet | 13 | 22.4% |
| Total | 58 | 100.0% |
Taylors Island Summary
Taylors Island is a small island located in Dorchester County, Maryland, United States. It is situated in the Chesapeake Bay, approximately 8 miles south of Cambridge, Maryland. The island is approximately 4 miles long and 1 mile wide, and is home to a population of approximately 200 people.
History
Taylors Island was first settled in the early 1600s by English settlers. The island was named after the Taylor family, who were among the first settlers. The island was used primarily for farming and fishing, and the population remained relatively small until the late 1800s. In the late 1800s, the island began to be used for oyster harvesting, and the population began to grow. By the early 1900s, the island had become a popular destination for tourists, and the population had grown to over 500 people.
In the mid-1900s, the island began to decline in population as the oyster industry declined and the island became less attractive to tourists. By the late 1900s, the population had dropped to around 200 people.
Geography
Taylors Island is located in the Chesapeake Bay, approximately 8 miles south of Cambridge, Maryland. The island is approximately 4 miles long and 1 mile wide, and is bordered by the Choptank River to the north and the Honga River to the south. The island is mostly flat, with an elevation of just 10 feet above sea level.
The island is home to a variety of wildlife, including white-tailed deer, wild turkeys, and a variety of waterfowl. The island is also home to a variety of plant life, including marsh grasses, cattails, and a variety of trees.
Economy
The economy of Taylors Island is largely based on fishing and tourism. The island is home to a number of seafood restaurants, as well as a few small shops and businesses. The island is also home to a number of marinas, which provide services to boaters and fishermen.
Tourism is also an important part of the economy of Taylors Island. The island is home to a number of bed and breakfasts, as well as a few small hotels. The island is also home to a number of attractions, including a lighthouse, a museum, and a number of historic sites.
Demographics
As of the 2010 census, the population of Taylors Island was 200 people. The population is largely white (95%), with a small minority of African Americans (4%) and other races (1%). The median age of the population is 44 years, and the median household income is $45,000.
Conclusion
Taylors Island is a small island located in Dorchester County, Maryland, United States. It is situated in the Chesapeake Bay, approximately 8 miles south of Cambridge, Maryland. The island is approximately 4 miles long and 1 mile wide, and is home to a population of approximately 200 people. The economy of Taylors Island is largely based on fishing and tourism, and the population is largely white (95%), with a small minority of African Americans (4%) and other races (1%). The island is home to a variety of wildlife, as well as a number of attractions, including a lighthouse, a museum, and a number of historic sites.
Common Questions
What is the Total Population of Taylors Island?
Total Population of Taylors Island is 109.
What is the Total Male Population of Taylors Island?
Total Male Population of Taylors Island is 65.
What is the Total Female Population of Taylors Island?
Total Female Population of Taylors Island is 44.
What is the Ratio of Males per 100 Females in Taylors Island?
There are 147.73 Males per 100 Females in Taylors Island.
What is the Ratio of Females per 100 Males in Taylors Island?
There are 67.69 Females per 100 Males in Taylors Island.
What is the Median Population Age in Taylors Island?
Median Population Age in Taylors Island is 59.0 Years.
What is the Average Family Size in Taylors Island
Average Family Size in Taylors Island is 2.3 People.
What is the Average Household Size in Taylors Island
Average Household Size in Taylors Island is 1.9 People.
What is Per Capita Income in Taylors Island?
Per Capita income in Taylors Island is $45,495.
What is the Median Family Income in Taylors Island?
Median Family Income in Taylors Island is $68,977.
What is the Median Household income in Taylors Island?
Median Household Income in Taylors Island is $68,182.
What is Inequality or Gini Index in Taylors Island?
Inequality or Gini Index in Taylors Island is 0.47.
How Large is the Labor Force in Taylors Island?
There are 48 People in the Labor Forcein in Taylors Island.
What is the Percentage of People in the Labor Force in Taylors Island?
48.5% of People are in the Labor Force in Taylors Island.