Rosaryville, MD
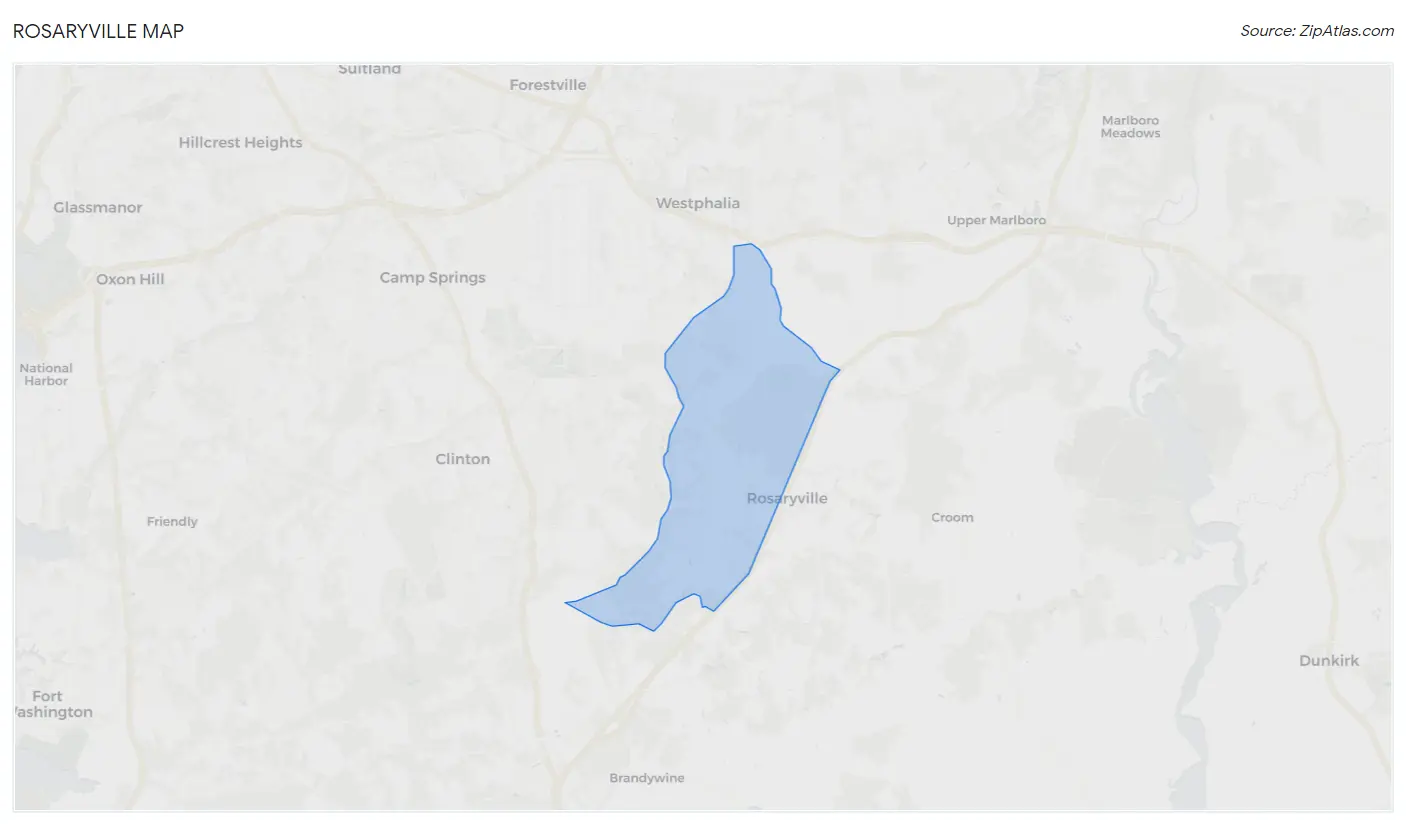
Rosaryville Map
Rosaryville Overview
12,026
TOTAL POPULATION
5,572
MALE POPULATION
6,454
FEMALE POPULATION
86.33
MALES / 100 FEMALES
115.83
FEMALES / 100 MALES
47.8
MEDIAN AGE
3.6
AVG FAMILY SIZE
3.2
AVG HOUSEHOLD SIZE
$53,205
PER CAPITA INCOME
$144,779
AVG FAMILY INCOME
$135,733
AVG HOUSEHOLD INCOME
17.3%
WAGE / INCOME GAP [ % ]
82.7¢/ $1
WAGE / INCOME GAP [ $ ]
$8,961
FAMILY INCOME DEFICIT
0.37
INEQUALITY / GINI INDEX
6,552
LABOR FORCE [ PEOPLE ]
65.8%
PERCENT IN LABOR FORCE
7.3%
UNEMPLOYMENT RATE
Race in Rosaryville
The most populous races in Rosaryville are Black / African American (9,833 | 81.8%), Some other Race (839 | 7.0%), and Hispanic or Latino (676 | 5.6%).
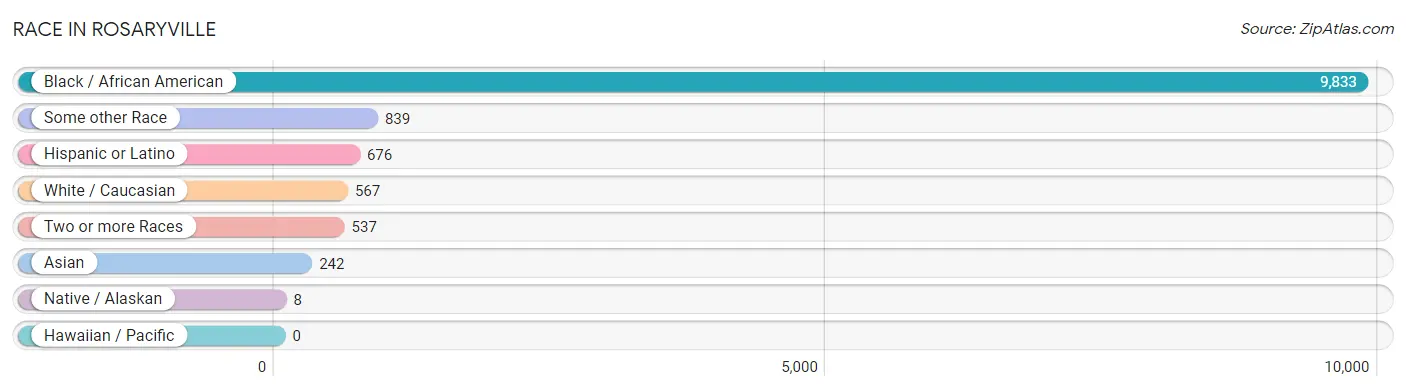
| Race | # Population | % Population |
| Asian | 242 | 2.0% |
| Black / African American | 9,833 | 81.8% |
| Hawaiian / Pacific | 0 | 0.0% |
| Hispanic or Latino | 676 | 5.6% |
| Native / Alaskan | 8 | 0.1% |
| White / Caucasian | 567 | 4.7% |
| Two or more Races | 537 | 4.5% |
| Some other Race | 839 | 7.0% |
| Total | 12,026 | 100.0% |
Ancestry in Rosaryville
The most populous ancestries reported in Rosaryville are Subsaharan African (961 | 8.0%), African (542 | 4.5%), Nigerian (267 | 2.2%), Brazilian (254 | 2.1%), and German (253 | 2.1%), together accounting for 18.9% of all Rosaryville residents.
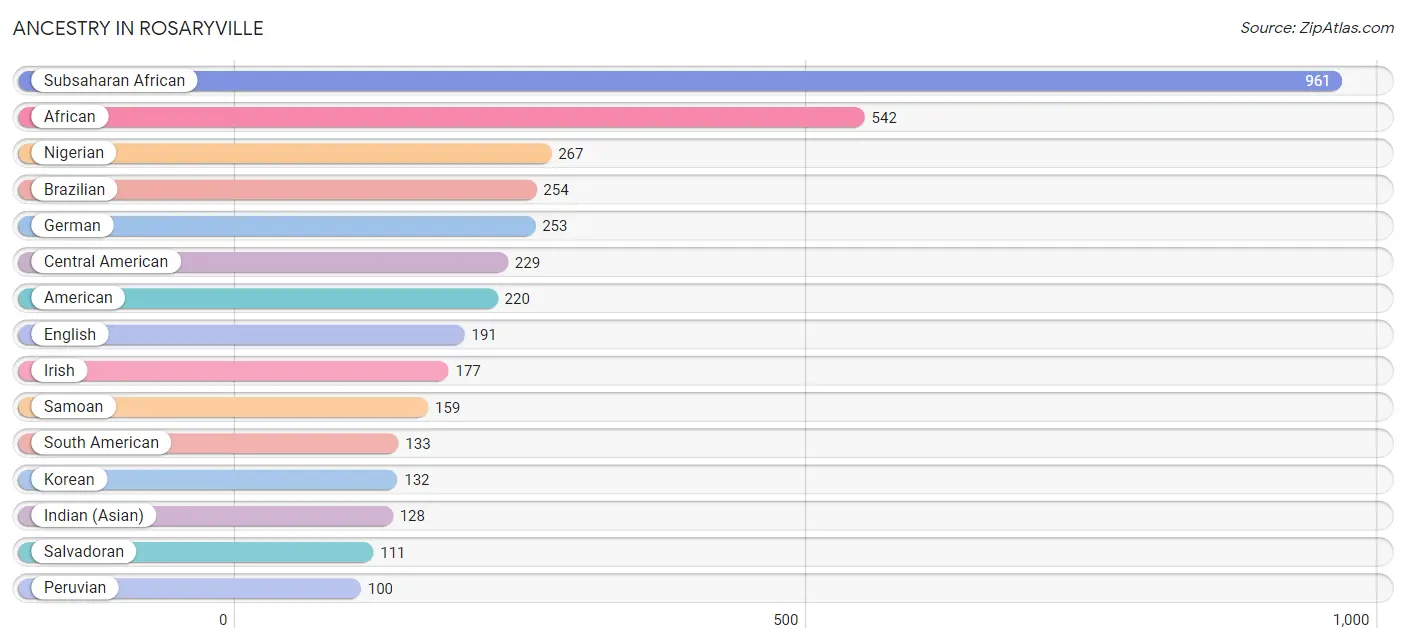
| Ancestry | # Population | % Population |
| African | 542 | 4.5% |
| American | 220 | 1.8% |
| Arab | 74 | 0.6% |
| Austrian | 7 | 0.1% |
| Brazilian | 254 | 2.1% |
| British | 1 | 0.0% |
| British West Indian | 89 | 0.7% |
| Cape Verdean | 7 | 0.1% |
| Central American | 229 | 1.9% |
| Cherokee | 18 | 0.2% |
| Colombian | 33 | 0.3% |
| Cuban | 38 | 0.3% |
| Dominican | 11 | 0.1% |
| Dutch | 27 | 0.2% |
| English | 191 | 1.6% |
| French | 32 | 0.3% |
| French Canadian | 7 | 0.1% |
| German | 253 | 2.1% |
| Greek | 8 | 0.1% |
| Guatemalan | 92 | 0.8% |
| Guyanese | 58 | 0.5% |
| Haitian | 11 | 0.1% |
| Honduran | 12 | 0.1% |
| Indian (Asian) | 128 | 1.1% |
| Irish | 177 | 1.5% |
| Italian | 46 | 0.4% |
| Jamaican | 73 | 0.6% |
| Kenyan | 8 | 0.1% |
| Korean | 132 | 1.1% |
| Laotian | 7 | 0.1% |
| Lebanese | 74 | 0.6% |
| Mexican | 56 | 0.5% |
| Nigerian | 267 | 2.2% |
| Norwegian | 13 | 0.1% |
| Pakistani | 8 | 0.1% |
| Panamanian | 14 | 0.1% |
| Peruvian | 100 | 0.8% |
| Polish | 12 | 0.1% |
| Puerto Rican | 7 | 0.1% |
| Puget Sound Salish | 16 | 0.1% |
| Salvadoran | 111 | 0.9% |
| Samoan | 159 | 1.3% |
| Scandinavian | 1 | 0.0% |
| Scottish | 12 | 0.1% |
| Sierra Leonean | 86 | 0.7% |
| Slovak | 14 | 0.1% |
| South American | 133 | 1.1% |
| Subsaharan African | 961 | 8.0% |
| Swiss | 10 | 0.1% |
| Trinidadian and Tobagonian | 8 | 0.1% | View All 50 Rows |
Immigrants in Rosaryville
The most numerous immigrant groups reported in Rosaryville came from Latin America (786 | 6.5%), Africa (740 | 6.1%), Western Africa (540 | 4.5%), Nigeria (501 | 4.2%), and South America (412 | 3.4%), together accounting for 24.8% of all Rosaryville residents.
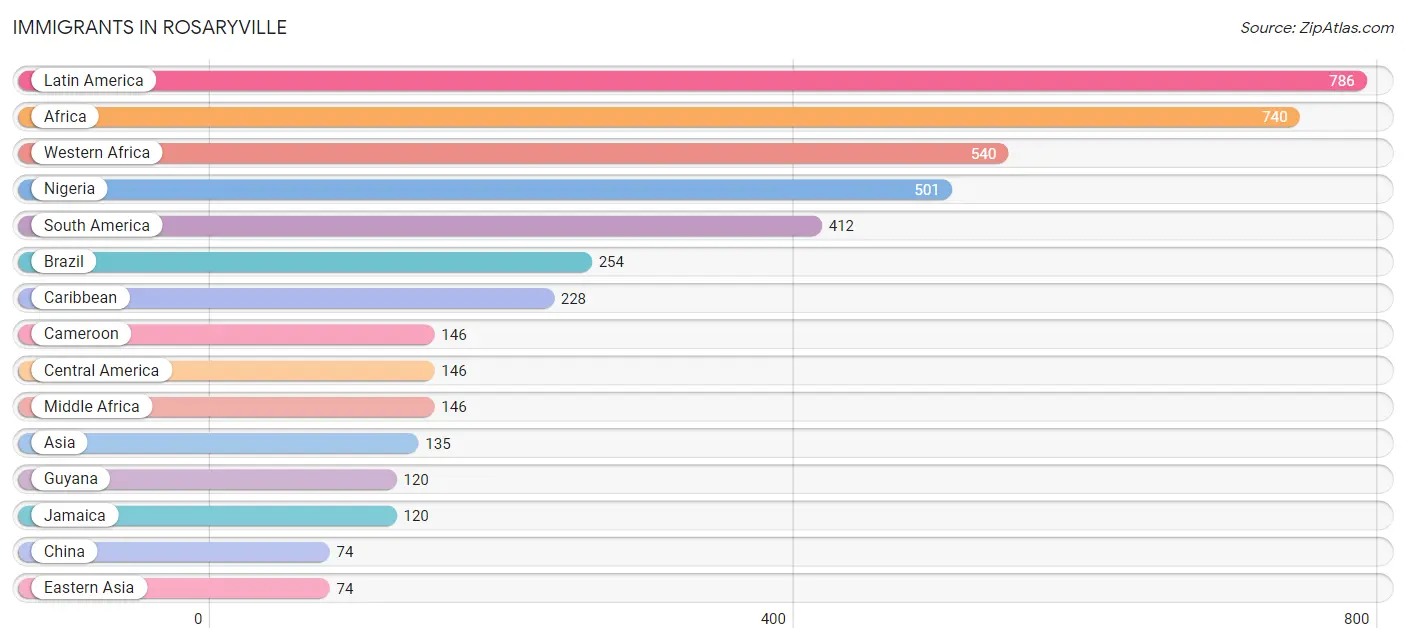
| Immigration Origin | # Population | % Population |
| Africa | 740 | 6.1% |
| Asia | 135 | 1.1% |
| Brazil | 254 | 2.1% |
| Cameroon | 146 | 1.2% |
| Canada | 7 | 0.1% |
| Caribbean | 228 | 1.9% |
| Central America | 146 | 1.2% |
| China | 74 | 0.6% |
| Colombia | 22 | 0.2% |
| Cuba | 36 | 0.3% |
| Dominica | 29 | 0.2% |
| Dominican Republic | 11 | 0.1% |
| Eastern Asia | 74 | 0.6% |
| El Salvador | 57 | 0.5% |
| England | 10 | 0.1% |
| Europe | 29 | 0.2% |
| Germany | 10 | 0.1% |
| Guatemala | 56 | 0.5% |
| Guyana | 120 | 1.0% |
| Honduras | 12 | 0.1% |
| Indonesia | 7 | 0.1% |
| Italy | 9 | 0.1% |
| Jamaica | 120 | 1.0% |
| Latin America | 786 | 6.5% |
| Mexico | 21 | 0.2% |
| Middle Africa | 146 | 1.2% |
| Nigeria | 501 | 4.2% |
| Northern Europe | 10 | 0.1% |
| Oceania | 36 | 0.3% |
| Peru | 16 | 0.1% |
| Philippines | 46 | 0.4% |
| Sierra Leone | 39 | 0.3% |
| South America | 412 | 3.4% |
| South Eastern Asia | 61 | 0.5% |
| Southern Europe | 9 | 0.1% |
| Thailand | 8 | 0.1% |
| Trinidad and Tobago | 8 | 0.1% |
| Western Africa | 540 | 4.5% |
| Western Europe | 10 | 0.1% | View All 39 Rows |
Sex and Age in Rosaryville
Sex and Age in Rosaryville
The most populous age groups in Rosaryville are 65 to 69 Years (534 | 9.6%) for men and 55 to 59 Years (656 | 10.2%) for women.
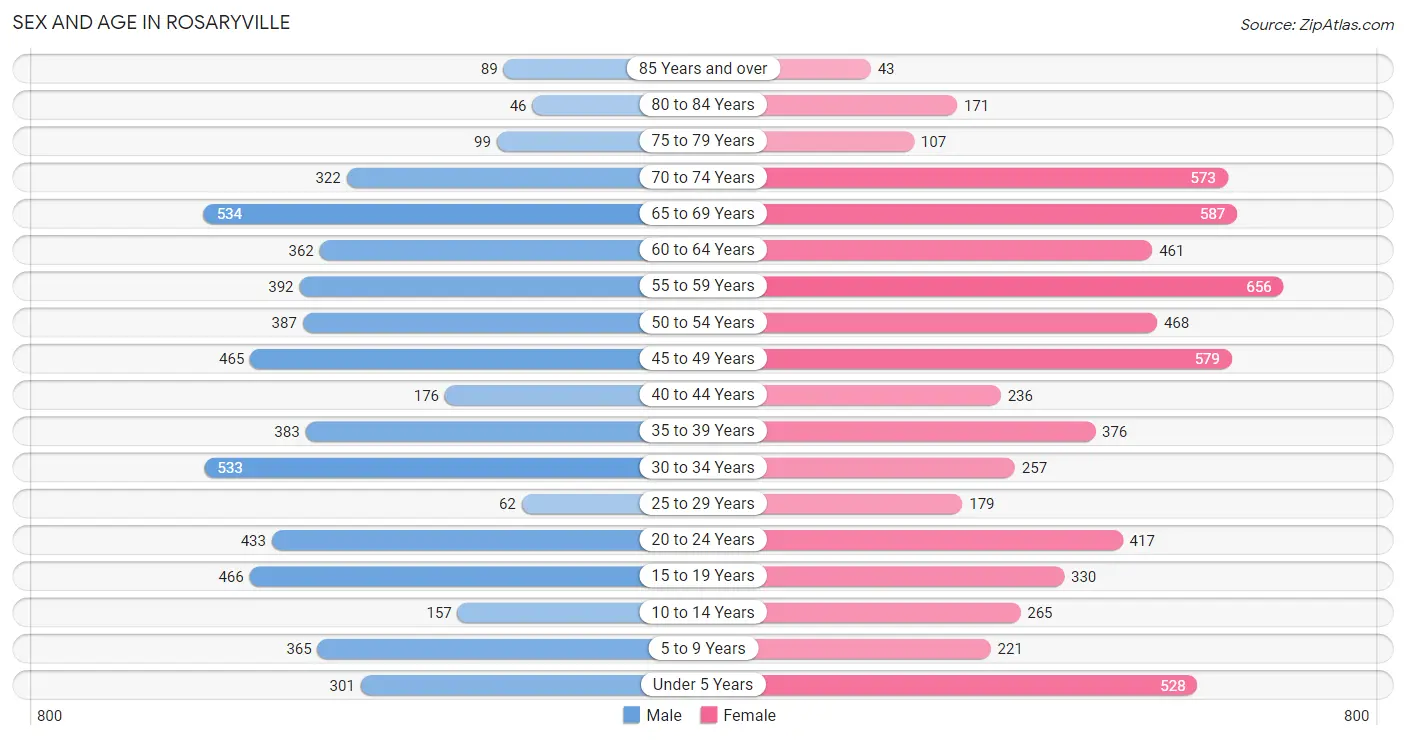
| Age Bracket | Male | Female |
| Under 5 Years | 301 (5.4%) | 528 (8.2%) |
| 5 to 9 Years | 365 (6.6%) | 221 (3.4%) |
| 10 to 14 Years | 157 (2.8%) | 265 (4.1%) |
| 15 to 19 Years | 466 (8.4%) | 330 (5.1%) |
| 20 to 24 Years | 433 (7.8%) | 417 (6.5%) |
| 25 to 29 Years | 62 (1.1%) | 179 (2.8%) |
| 30 to 34 Years | 533 (9.6%) | 257 (4.0%) |
| 35 to 39 Years | 383 (6.9%) | 376 (5.8%) |
| 40 to 44 Years | 176 (3.2%) | 236 (3.7%) |
| 45 to 49 Years | 465 (8.4%) | 579 (9.0%) |
| 50 to 54 Years | 387 (7.0%) | 468 (7.2%) |
| 55 to 59 Years | 392 (7.0%) | 656 (10.2%) |
| 60 to 64 Years | 362 (6.5%) | 461 (7.1%) |
| 65 to 69 Years | 534 (9.6%) | 587 (9.1%) |
| 70 to 74 Years | 322 (5.8%) | 573 (8.9%) |
| 75 to 79 Years | 99 (1.8%) | 107 (1.7%) |
| 80 to 84 Years | 46 (0.8%) | 171 (2.6%) |
| 85 Years and over | 89 (1.6%) | 43 (0.7%) |
| Total | 5,572 (100.0%) | 6,454 (100.0%) |
Families and Households in Rosaryville
Median Family Size in Rosaryville
The median family size in Rosaryville is 3.59 persons per family, with married-couple families (2,149 | 71.3%) accounting for the largest median family size of 3.73 persons per family. On the other hand, single female/mother families (551 | 18.3%) represent the smallest median family size with 3.15 persons per family.
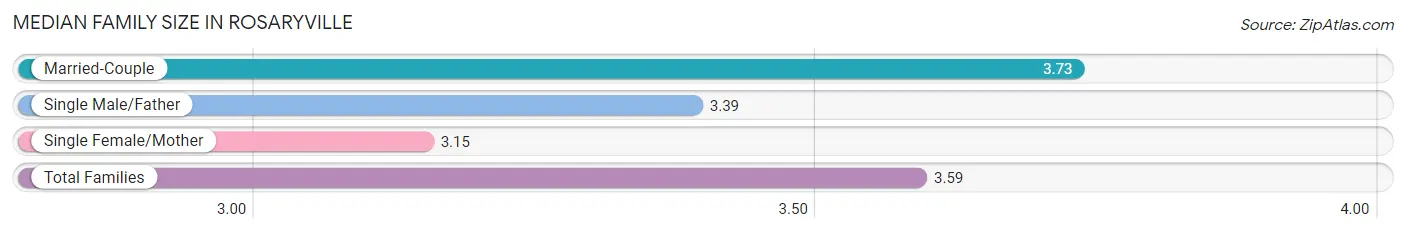
| Family Type | # Families | Family Size |
| Married-Couple | 2,149 (71.3%) | 3.73 |
| Single Male/Father | 315 (10.4%) | 3.39 |
| Single Female/Mother | 551 (18.3%) | 3.15 |
| Total Families | 3,015 (100.0%) | 3.59 |
Median Household Size in Rosaryville
The median household size in Rosaryville is 3.18 persons per household, with married-couple households (2,149 | 57.1%) accounting for the largest median household size of 3.78 persons per household. non-family households (752 | 20.0%) represent the smallest median household size with 1.14 persons per household.
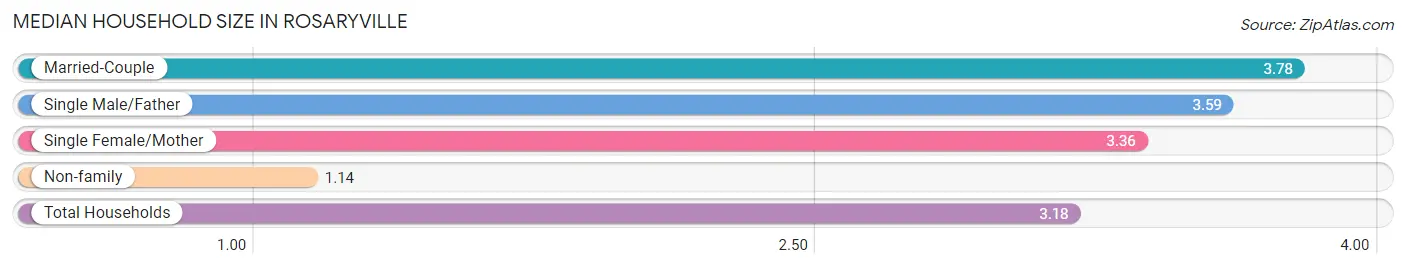
| Household Type | # Households | Household Size |
| Married-Couple | 2,149 (57.1%) | 3.78 |
| Single Male/Father | 315 (8.4%) | 3.59 |
| Single Female/Mother | 551 (14.6%) | 3.36 |
| Non-family | 752 (20.0%) | 1.14 |
| Total Households | 3,767 (100.0%) | 3.18 |
Household Size by Marriage Status in Rosaryville
Out of a total of 3,767 households in Rosaryville, 3,015 (80.0%) are family households, while 752 (20.0%) are nonfamily households. The most numerous type of family households are 2-person households, comprising 1,092, and the most common type of nonfamily households are 1-person households, comprising 648.
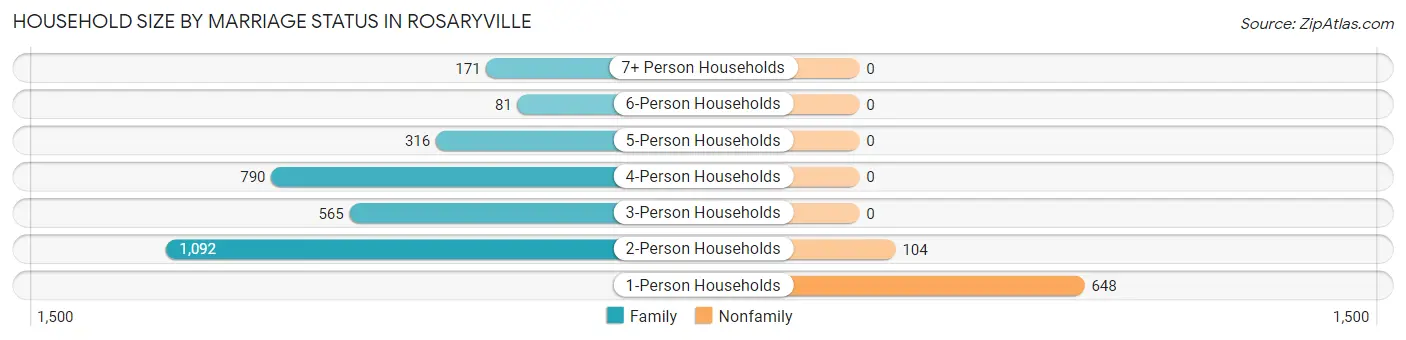
| Household Size | Family Households | Nonfamily Households |
| 1-Person Households | - | 648 (17.2%) |
| 2-Person Households | 1,092 (29.0%) | 104 (2.8%) |
| 3-Person Households | 565 (15.0%) | 0 (0.0%) |
| 4-Person Households | 790 (21.0%) | 0 (0.0%) |
| 5-Person Households | 316 (8.4%) | 0 (0.0%) |
| 6-Person Households | 81 (2.1%) | 0 (0.0%) |
| 7+ Person Households | 171 (4.5%) | 0 (0.0%) |
| Total | 3,015 (80.0%) | 752 (20.0%) |
Female Fertility in Rosaryville
Fertility by Age in Rosaryville
Average fertility rate in Rosaryville is 43.0 births per 1,000 women. Women in the age bracket of 20 to 34 years have the highest fertility rate with 89.0 births per 1,000 women. Women in the age bracket of 20 to 34 years acount for 73.8% of all women with births.
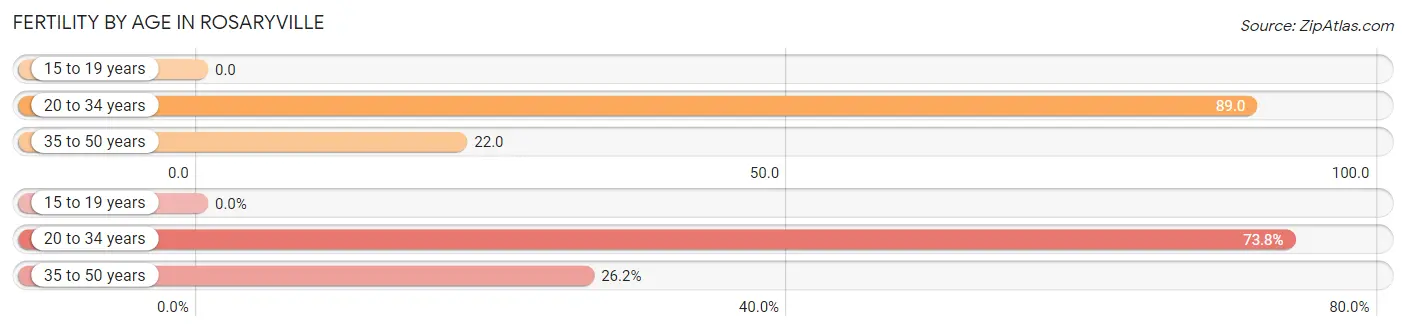
| Age Bracket | Women with Births | Births / 1,000 Women |
| 15 to 19 years | 0 (0.0%) | 0.0 |
| 20 to 34 years | 76 (73.8%) | 89.0 |
| 35 to 50 years | 27 (26.2%) | 22.0 |
| Total | 103 (100.0%) | 43.0 |
Fertility by Age by Marriage Status in Rosaryville
65.0% of women with births (103) in Rosaryville are married. The highest percentage of unmarried women with births falls into 20 to 34 years age bracket with 40.8% of them unmarried at the time of birth, while the lowest percentage of unmarried women with births belong to 35 to 50 years age bracket with 18.5% of them unmarried.
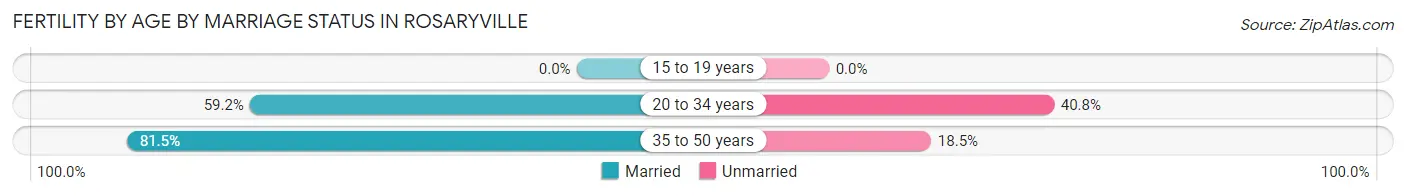
| Age Bracket | Married | Unmarried |
| 15 to 19 years | 0 (0.0%) | 0 (0.0%) |
| 20 to 34 years | 45 (59.2%) | 31 (40.8%) |
| 35 to 50 years | 22 (81.5%) | 5 (18.5%) |
| Total | 67 (65.0%) | 36 (34.9%) |
Fertility by Education in Rosaryville
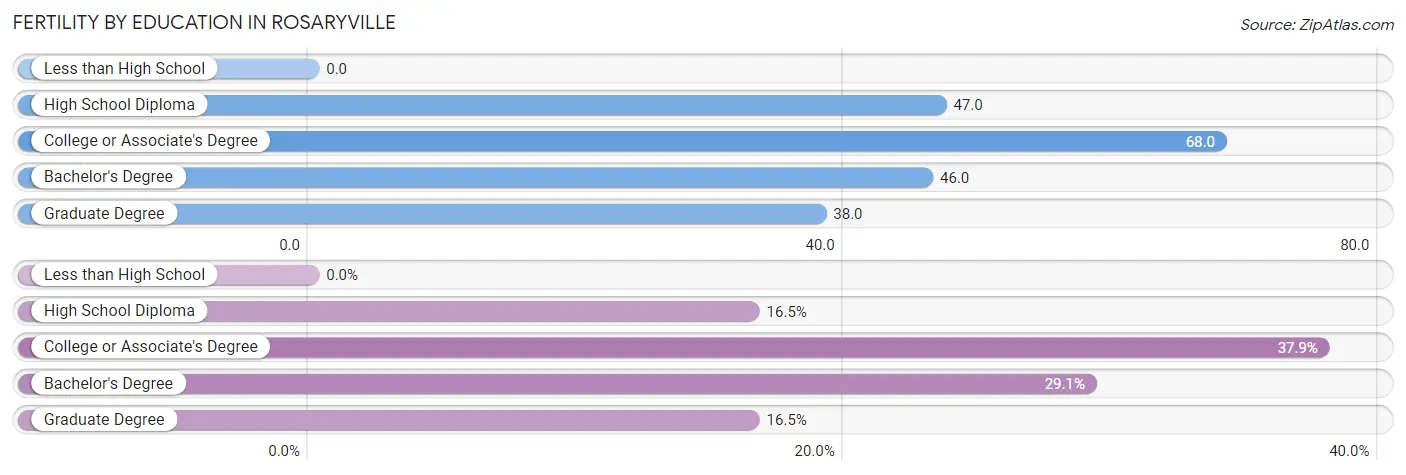
| Educational Attainment | Women with Births | Births / 1,000 Women |
| Less than High School | 0 (0.0%) | 0.0 |
| High School Diploma | 17 (16.5%) | 47.0 |
| College or Associate's Degree | 39 (37.9%) | 68.0 |
| Bachelor's Degree | 30 (29.1%) | 46.0 |
| Graduate Degree | 17 (16.5%) | 38.0 |
| Total | 103 (100.0%) | 43.0 |
Fertility by Education by Marriage Status in Rosaryville
34.9% of women with births in Rosaryville are unmarried. Women with the educational attainment of college or associate's degree are most likely to be married with 100.0% of them married at childbirth, while women with the educational attainment of high school diploma are least likely to be married with 70.6% of them unmarried at childbirth.
| Educational Attainment | Married | Unmarried |
| Less than High School | 0 (0.0%) | 0 (0.0%) |
| High School Diploma | 5 (29.4%) | 12 (70.6%) |
| College or Associate's Degree | 39 (100.0%) | 0 (0.0%) |
| Bachelor's Degree | 11 (36.7%) | 19 (63.3%) |
| Graduate Degree | 12 (70.6%) | 5 (29.4%) |
| Total | 67 (65.0%) | 36 (34.9%) |
Income in Rosaryville
Income Overview in Rosaryville
Per Capita Income in Rosaryville is $53,205, while median incomes of families and households are $144,779 and $135,733 respectively.
| Characteristic | Number | Measure |
| Per Capita Income | 12,026 | $53,205 |
| Median Family Income | 3,015 | $144,779 |
| Mean Family Income | 3,015 | $171,431 |
| Median Household Income | 3,767 | $135,733 |
| Mean Household Income | 3,767 | $164,847 |
| Income Deficit | 3,015 | $8,961 |
| Wage / Income Gap (%) | 12,026 | 17.26% |
| Wage / Income Gap ($) | 12,026 | 82.74¢ per $1 |
| Gini / Inequality Index | 12,026 | 0.37 |
Earnings by Sex in Rosaryville
Average Earnings in Rosaryville are $72,841, $63,750 for men and $77,049 for women, a difference of 17.3%.
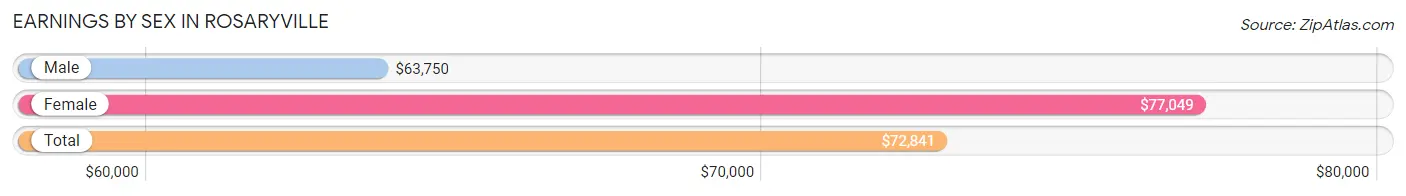
| Sex | Number | Average Earnings |
| Male | 3,120 (48.3%) | $63,750 |
| Female | 3,338 (51.7%) | $77,049 |
| Total | 6,458 (100.0%) | $72,841 |
Earnings by Sex by Income Bracket in Rosaryville
The most common earnings brackets in Rosaryville are $100,000+ for men (924 | 29.6%) and $100,000+ for women (982 | 29.4%).
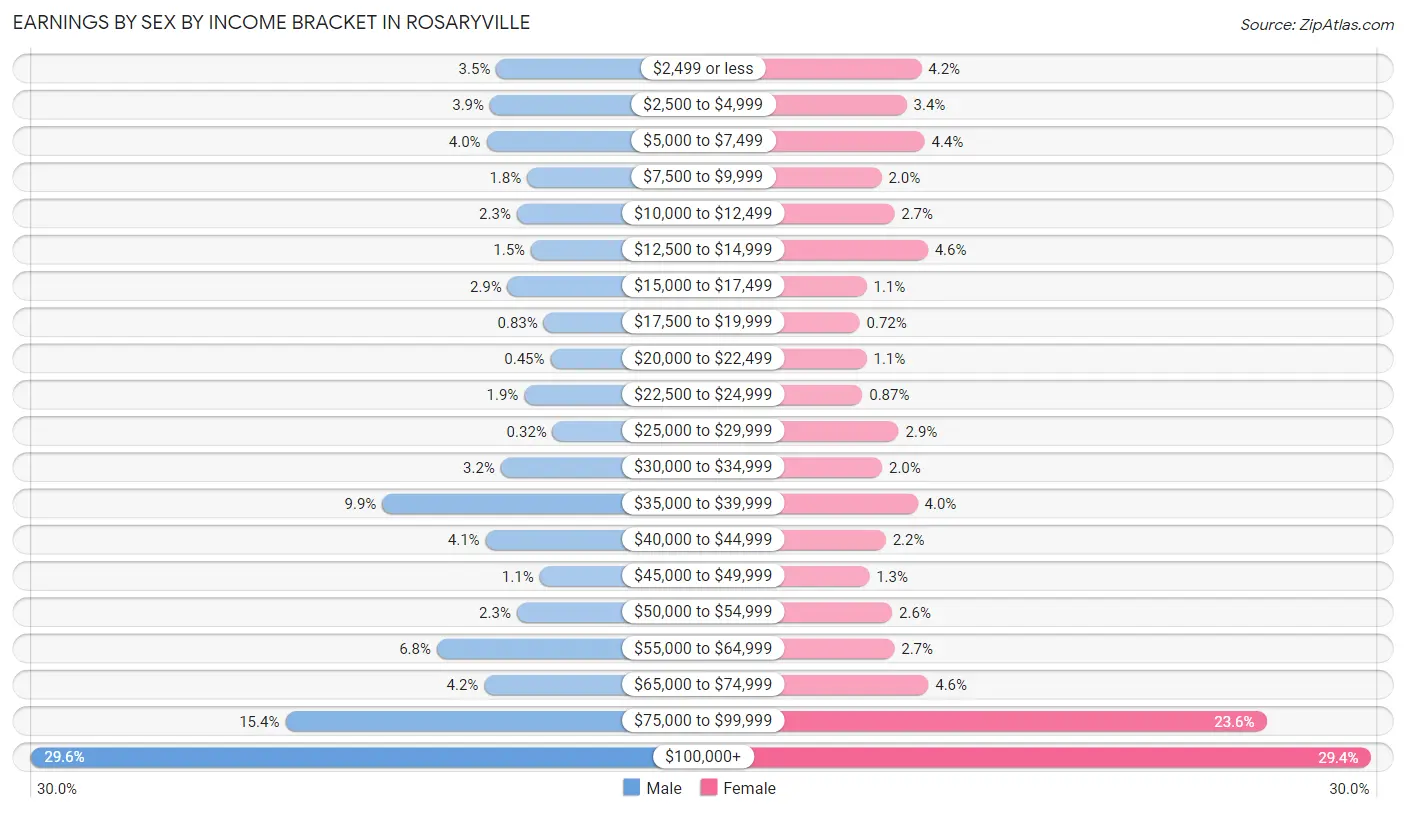
| Income | Male | Female |
| $2,499 or less | 109 (3.5%) | 140 (4.2%) |
| $2,500 to $4,999 | 120 (3.8%) | 112 (3.4%) |
| $5,000 to $7,499 | 126 (4.0%) | 146 (4.4%) |
| $7,500 to $9,999 | 55 (1.8%) | 65 (1.9%) |
| $10,000 to $12,499 | 73 (2.3%) | 89 (2.7%) |
| $12,500 to $14,999 | 48 (1.5%) | 152 (4.5%) |
| $15,000 to $17,499 | 89 (2.9%) | 37 (1.1%) |
| $17,500 to $19,999 | 26 (0.8%) | 24 (0.7%) |
| $20,000 to $22,499 | 14 (0.4%) | 37 (1.1%) |
| $22,500 to $24,999 | 60 (1.9%) | 29 (0.9%) |
| $25,000 to $29,999 | 10 (0.3%) | 97 (2.9%) |
| $30,000 to $34,999 | 101 (3.2%) | 66 (2.0%) |
| $35,000 to $39,999 | 309 (9.9%) | 133 (4.0%) |
| $40,000 to $44,999 | 128 (4.1%) | 73 (2.2%) |
| $45,000 to $49,999 | 33 (1.1%) | 42 (1.3%) |
| $50,000 to $54,999 | 73 (2.3%) | 85 (2.5%) |
| $55,000 to $64,999 | 213 (6.8%) | 89 (2.7%) |
| $65,000 to $74,999 | 130 (4.2%) | 153 (4.6%) |
| $75,000 to $99,999 | 479 (15.3%) | 787 (23.6%) |
| $100,000+ | 924 (29.6%) | 982 (29.4%) |
| Total | 3,120 (100.0%) | 3,338 (100.0%) |
Earnings by Sex by Educational Attainment in Rosaryville
Average earnings in Rosaryville are $78,136 for men and $78,672 for women, a difference of 0.7%. Men with an educational attainment of graduate degree enjoy the highest average annual earnings of $121,635, while those with less than high school education earn the least with $36,569. Women with an educational attainment of graduate degree earn the most with the average annual earnings of $108,281, while those with college or associate's degree education have the smallest earnings of $77,022.
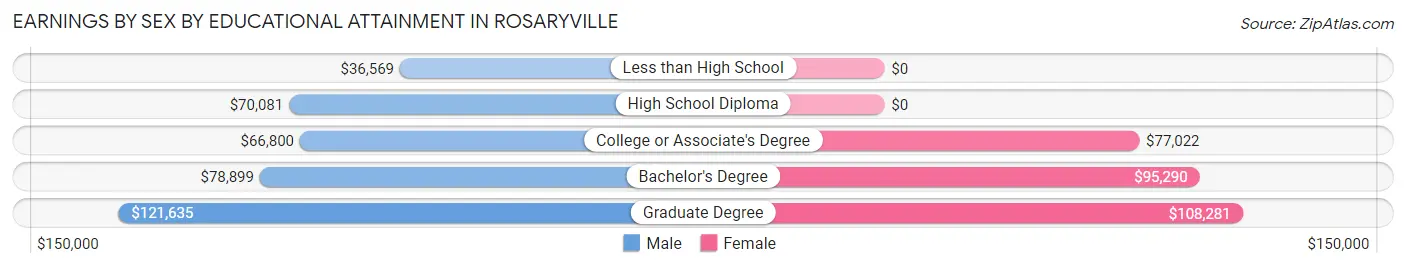
| Educational Attainment | Male Income | Female Income |
| Less than High School | $36,569 | $0 |
| High School Diploma | $70,081 | $0 |
| College or Associate's Degree | $66,800 | $77,022 |
| Bachelor's Degree | $78,899 | $95,290 |
| Graduate Degree | $121,635 | $108,281 |
| Total | $78,136 | $78,672 |
Family Income in Rosaryville
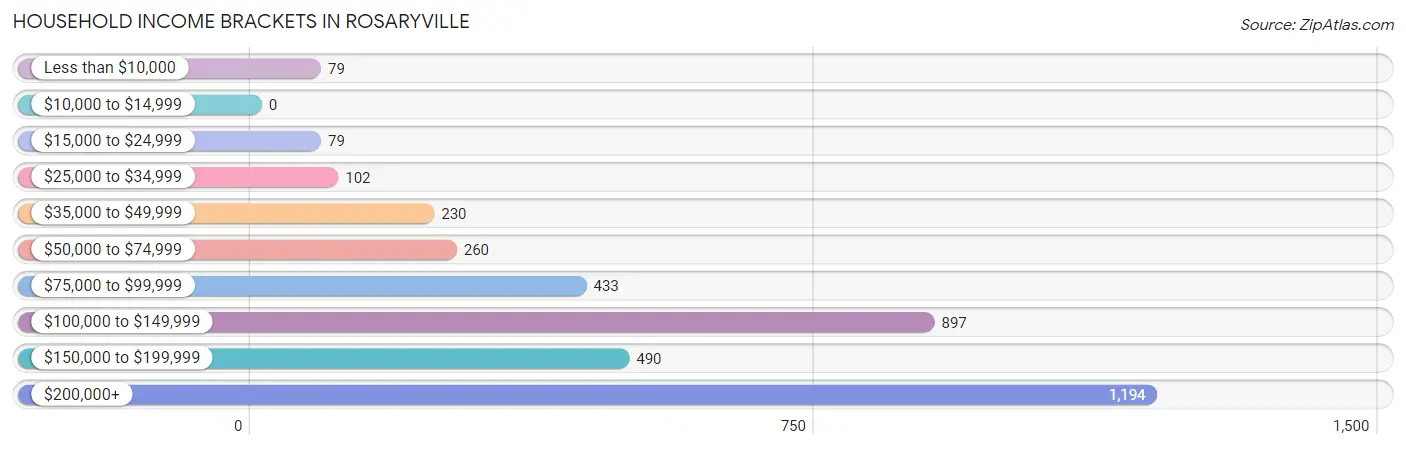
Family Income Brackets in Rosaryville
According to the Rosaryville family income data, there are 1,061 families falling into the $200,000+ income range, which is the most common income bracket and makes up 35.2% of all families.
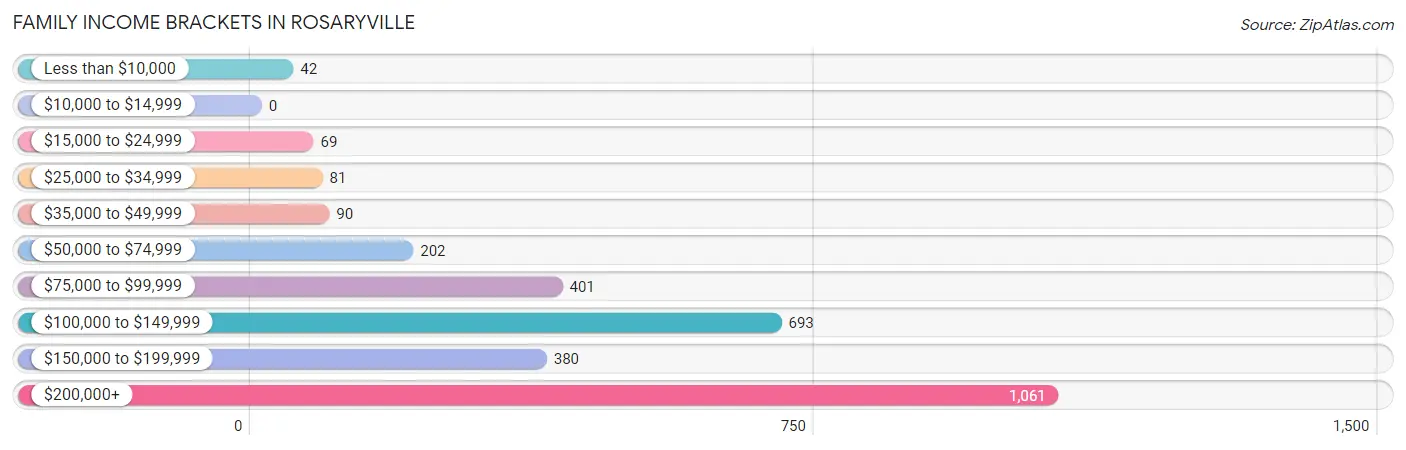
| Income Bracket | # Families | % Families |
| Less than $10,000 | 42 | 1.4% |
| $10,000 to $14,999 | 0 | 0.0% |
| $15,000 to $24,999 | 69 | 2.3% |
| $25,000 to $34,999 | 81 | 2.7% |
| $35,000 to $49,999 | 90 | 3.0% |
| $50,000 to $74,999 | 202 | 6.7% |
| $75,000 to $99,999 | 401 | 13.3% |
| $100,000 to $149,999 | 693 | 23.0% |
| $150,000 to $199,999 | 380 | 12.6% |
| $200,000+ | 1,061 | 35.2% |
Family Income by Famaliy Size in Rosaryville
7+ person families (171 | 5.7%) account for the highest median family income in Rosaryville with $250,001 per family, while 2-person families (1,120 | 37.1%) have the highest median income of $59,948 per family member.
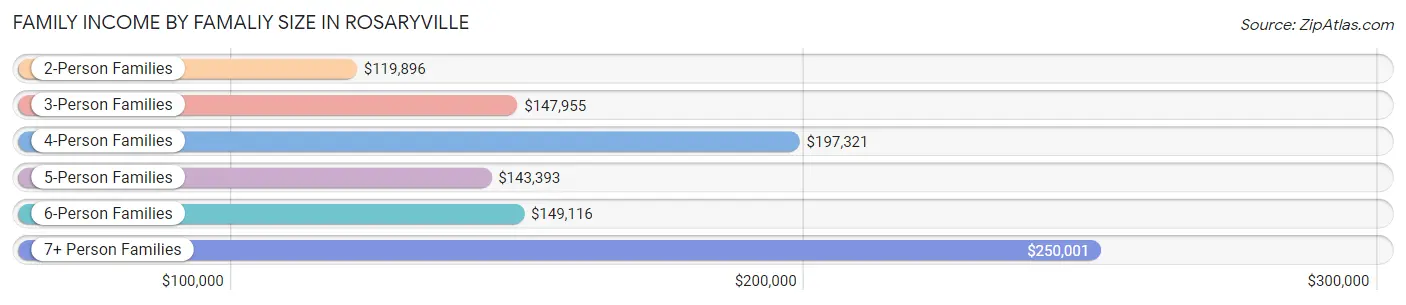
| Income Bracket | # Families | Median Income |
| 2-Person Families | 1,120 (37.1%) | $119,896 |
| 3-Person Families | 606 (20.1%) | $147,955 |
| 4-Person Families | 775 (25.7%) | $197,321 |
| 5-Person Families | 270 (9.0%) | $143,393 |
| 6-Person Families | 73 (2.4%) | $149,116 |
| 7+ Person Families | 171 (5.7%) | $250,001 |
| Total | 3,015 (100.0%) | $144,779 |
Family Income by Number of Earners in Rosaryville
The median family income in Rosaryville is $144,779, with families comprising 3+ earners (645) having the highest median family income of $246,580, while families with no earners (407) have the lowest median family income of $93,125, accounting for 21.4% and 13.5% of families, respectively.
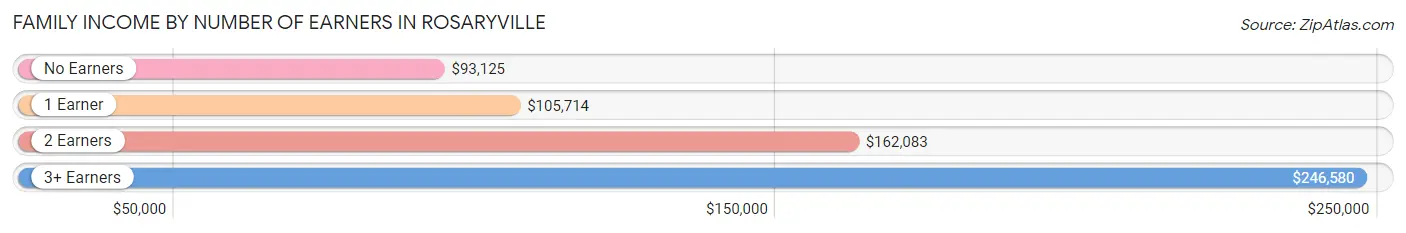
| Number of Earners | # Families | Median Income |
| No Earners | 407 (13.5%) | $93,125 |
| 1 Earner | 668 (22.2%) | $105,714 |
| 2 Earners | 1,295 (42.9%) | $162,083 |
| 3+ Earners | 645 (21.4%) | $246,580 |
| Total | 3,015 (100.0%) | $144,779 |
Household Income in Rosaryville
Household Income Brackets in Rosaryville
With 1,194 households falling in the category, the $200,000+ income range is the most frequent in Rosaryville, accounting for 31.7% of all households.
| Income Bracket | # Households | % Households |
| Less than $10,000 | 79 | 2.1% |
| $10,000 to $14,999 | 0 | 0.0% |
| $15,000 to $24,999 | 79 | 2.1% |
| $25,000 to $34,999 | 102 | 2.7% |
| $35,000 to $49,999 | 230 | 6.1% |
| $50,000 to $74,999 | 260 | 6.9% |
| $75,000 to $99,999 | 433 | 11.5% |
| $100,000 to $149,999 | 897 | 23.8% |
| $150,000 to $199,999 | 490 | 13.0% |
| $200,000+ | 1,194 | 31.7% |
Household Income by Householder Age in Rosaryville
The median household income in Rosaryville is $135,733, with the highest median household income of $158,542 found in the 45 to 64 years age bracket for the primary householder. A total of 1,847 households (49.0%) fall into this category.
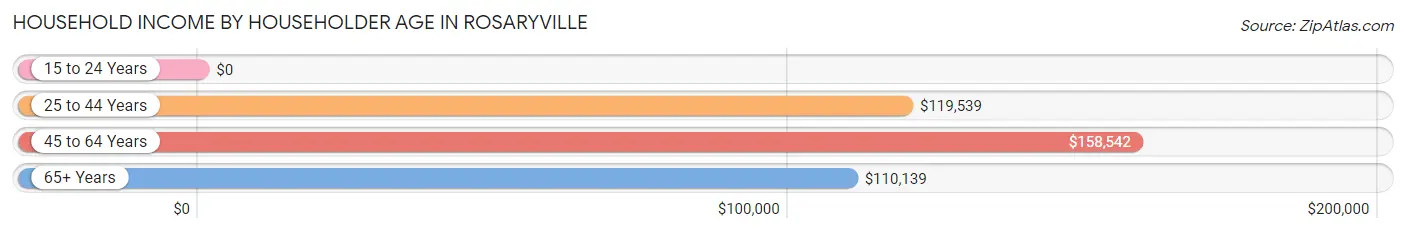
| Income Bracket | # Households | Median Income |
| 15 to 24 Years | 0 (0.0%) | $0 |
| 25 to 44 Years | 765 (20.3%) | $119,539 |
| 45 to 64 Years | 1,847 (49.0%) | $158,542 |
| 65+ Years | 1,155 (30.7%) | $110,139 |
| Total | 3,767 (100.0%) | $135,733 |
Poverty in Rosaryville
Income Below Poverty by Sex and Age in Rosaryville
With 5.1% poverty level for males and 6.5% for females among the residents of Rosaryville, 12 to 14 year old males and 5 year old females are the most vulnerable to poverty, with 29 males (34.9%) and 33 females (80.5%) in their respective age groups living below the poverty level.
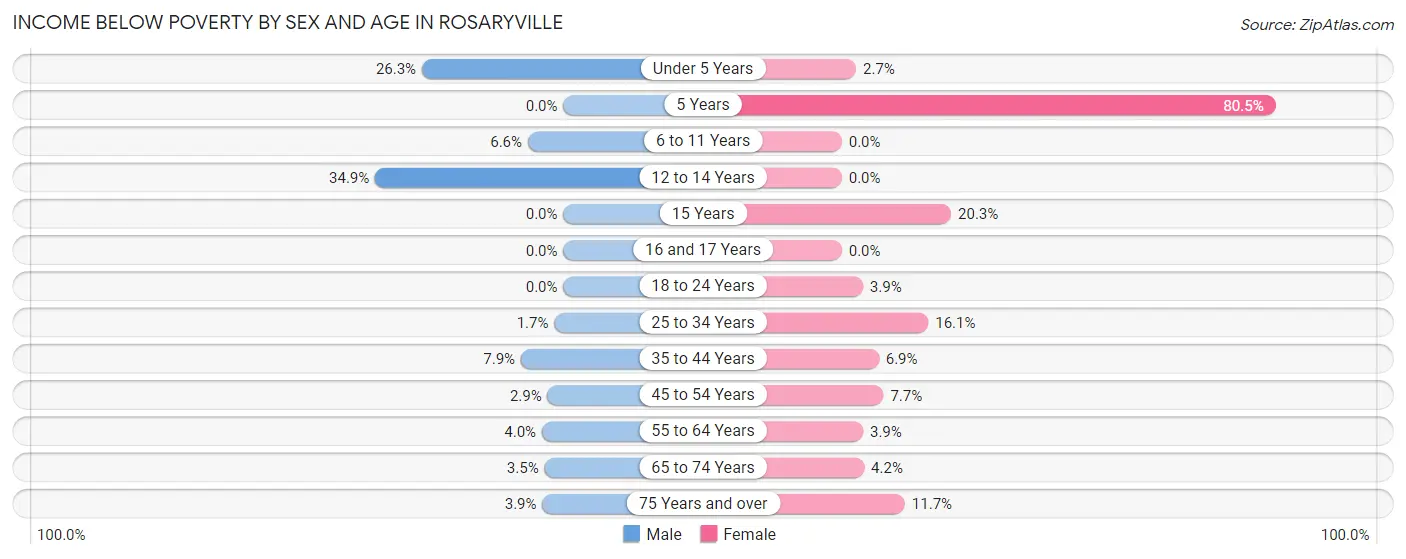
| Age Bracket | Male | Female |
| Under 5 Years | 79 (26.3%) | 14 (2.6%) |
| 5 Years | 0 (0.0%) | 33 (80.5%) |
| 6 to 11 Years | 25 (6.6%) | 0 (0.0%) |
| 12 to 14 Years | 29 (34.9%) | 0 (0.0%) |
| 15 Years | 0 (0.0%) | 28 (20.3%) |
| 16 and 17 Years | 0 (0.0%) | 0 (0.0%) |
| 18 to 24 Years | 0 (0.0%) | 19 (3.9%) |
| 25 to 34 Years | 10 (1.7%) | 70 (16.1%) |
| 35 to 44 Years | 44 (7.9%) | 42 (6.9%) |
| 45 to 54 Years | 25 (2.9%) | 81 (7.7%) |
| 55 to 64 Years | 30 (4.0%) | 44 (3.9%) |
| 65 to 74 Years | 30 (3.5%) | 48 (4.2%) |
| 75 Years and over | 9 (3.9%) | 37 (11.7%) |
| Total | 281 (5.1%) | 416 (6.5%) |
Income Above Poverty by Sex and Age in Rosaryville
According to the poverty statistics in Rosaryville, males aged 5 years and females aged 6 to 11 years are the age groups that are most secure financially, with 100.0% of males and 100.0% of females in these age groups living above the poverty line.
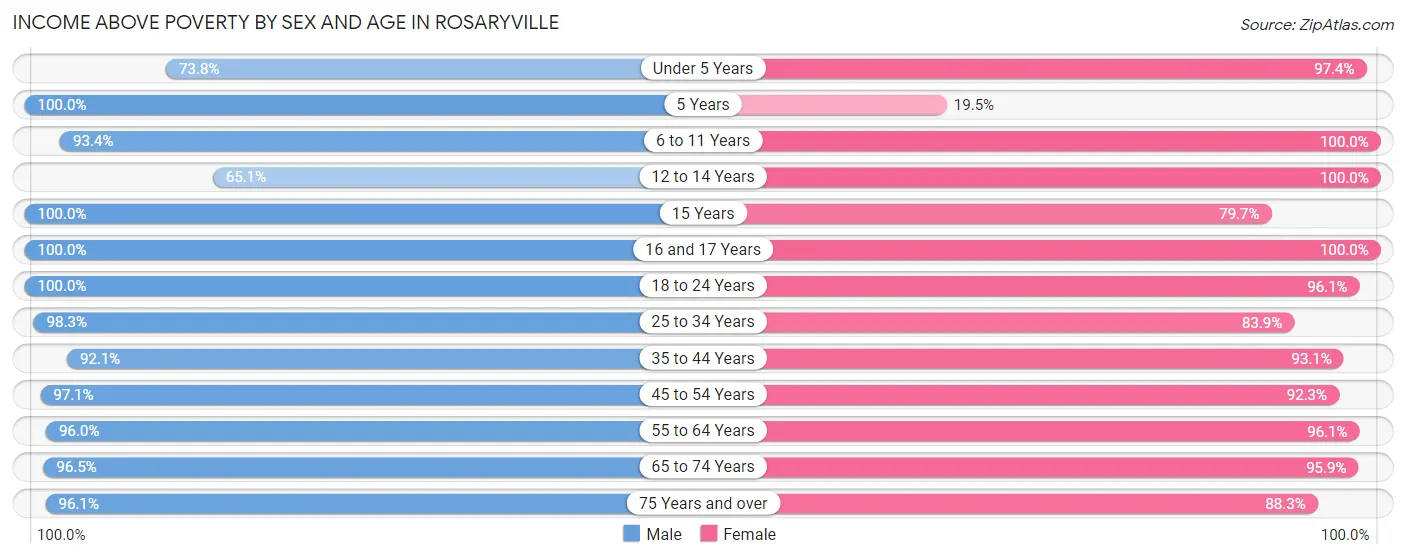
| Age Bracket | Male | Female |
| Under 5 Years | 222 (73.8%) | 514 (97.4%) |
| 5 Years | 58 (100.0%) | 8 (19.5%) |
| 6 to 11 Years | 355 (93.4%) | 245 (100.0%) |
| 12 to 14 Years | 54 (65.1%) | 200 (100.0%) |
| 15 Years | 94 (100.0%) | 110 (79.7%) |
| 16 and 17 Years | 96 (100.0%) | 124 (100.0%) |
| 18 to 24 Years | 691 (100.0%) | 466 (96.1%) |
| 25 to 34 Years | 585 (98.3%) | 366 (83.9%) |
| 35 to 44 Years | 515 (92.1%) | 570 (93.1%) |
| 45 to 54 Years | 827 (97.1%) | 966 (92.3%) |
| 55 to 64 Years | 724 (96.0%) | 1,073 (96.1%) |
| 65 to 74 Years | 826 (96.5%) | 1,108 (95.9%) |
| 75 Years and over | 222 (96.1%) | 279 (88.3%) |
| Total | 5,269 (94.9%) | 6,029 (93.5%) |
Income Below Poverty Among Married-Couple Families in Rosaryville
The poverty statistics for married-couple families in Rosaryville show that 2.6% or 56 of the total 2,149 families live below the poverty line. Families with 3 or 4 children have the highest poverty rate of 8.8%, comprising of 10 families. On the other hand, families with 5 or more children have the lowest poverty rate of 0.0%, which includes 0 families.
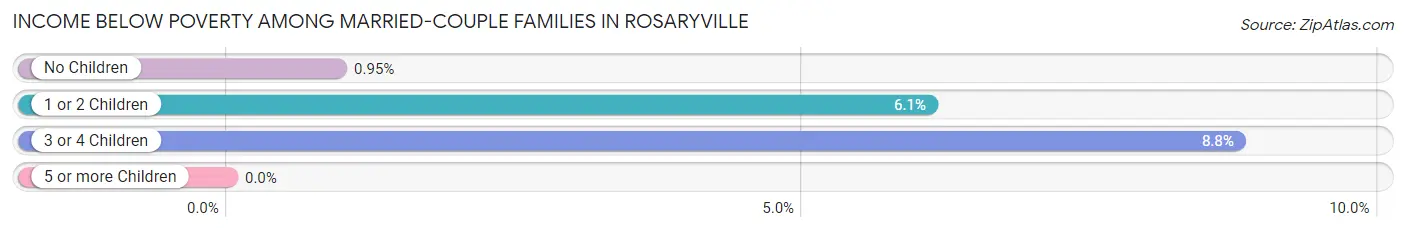
| Children | Above Poverty | Below Poverty |
| No Children | 1,360 (99.1%) | 13 (0.9%) |
| 1 or 2 Children | 509 (93.9%) | 33 (6.1%) |
| 3 or 4 Children | 104 (91.2%) | 10 (8.8%) |
| 5 or more Children | 120 (100.0%) | 0 (0.0%) |
| Total | 2,093 (97.4%) | 56 (2.6%) |
Income Below Poverty Among Single-Parent Households in Rosaryville
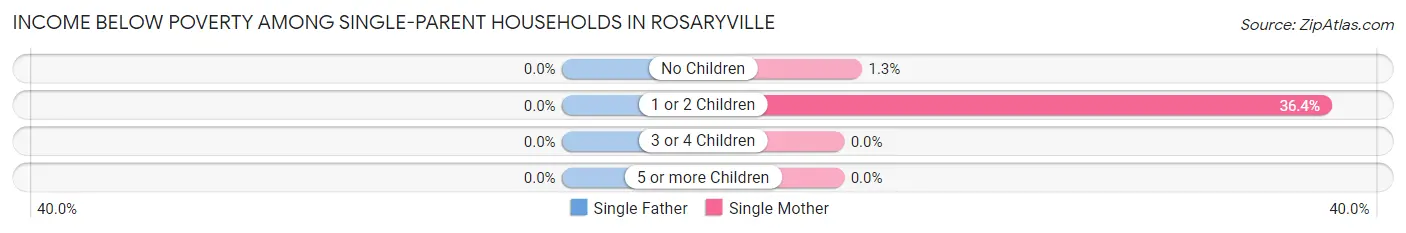
| Children | Single Father | Single Mother |
| No Children | 0 (0.0%) | 5 (1.3%) |
| 1 or 2 Children | 0 (0.0%) | 64 (36.4%) |
| 3 or 4 Children | 0 (0.0%) | 0 (0.0%) |
| 5 or more Children | 0 (0.0%) | 0 (0.0%) |
| Total | 0 (0.0%) | 69 (12.5%) |
Income Below Poverty Among Married-Couple vs Single-Parent Households in Rosaryville
The poverty data for Rosaryville shows that 56 of the married-couple family households (2.6%) and 69 of the single-parent households (8.0%) are living below the poverty level. Within the married-couple family households, those with 3 or 4 children have the highest poverty rate, with 10 households (8.8%) falling below the poverty line. Among the single-parent households, those with 1 or 2 children have the highest poverty rate, with 64 household (25.2%) living below poverty.
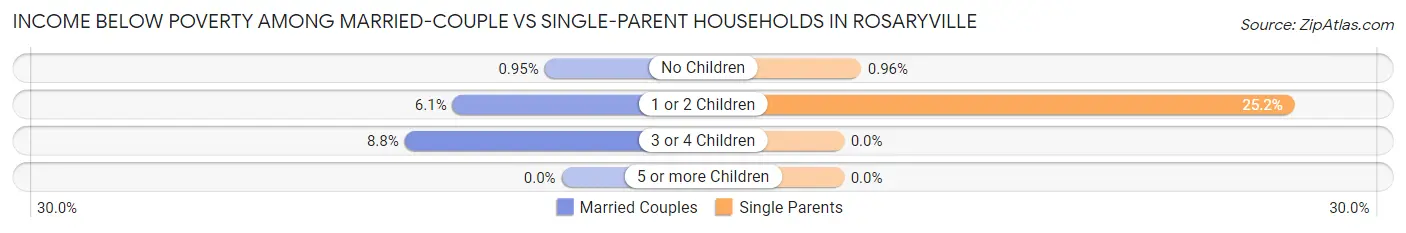
| Children | Married-Couple Families | Single-Parent Households |
| No Children | 13 (0.9%) | 5 (1.0%) |
| 1 or 2 Children | 33 (6.1%) | 64 (25.2%) |
| 3 or 4 Children | 10 (8.8%) | 0 (0.0%) |
| 5 or more Children | 0 (0.0%) | 0 (0.0%) |
| Total | 56 (2.6%) | 69 (8.0%) |
Employment Characteristics in Rosaryville
Employment by Class of Employer in Rosaryville
Among the 5,960 employed individuals in Rosaryville, private company employees (2,902 | 48.7%), federal government employees (1,199 | 20.1%), and not-for-profit organizations (737 | 12.4%) make up the most common classes of employment.
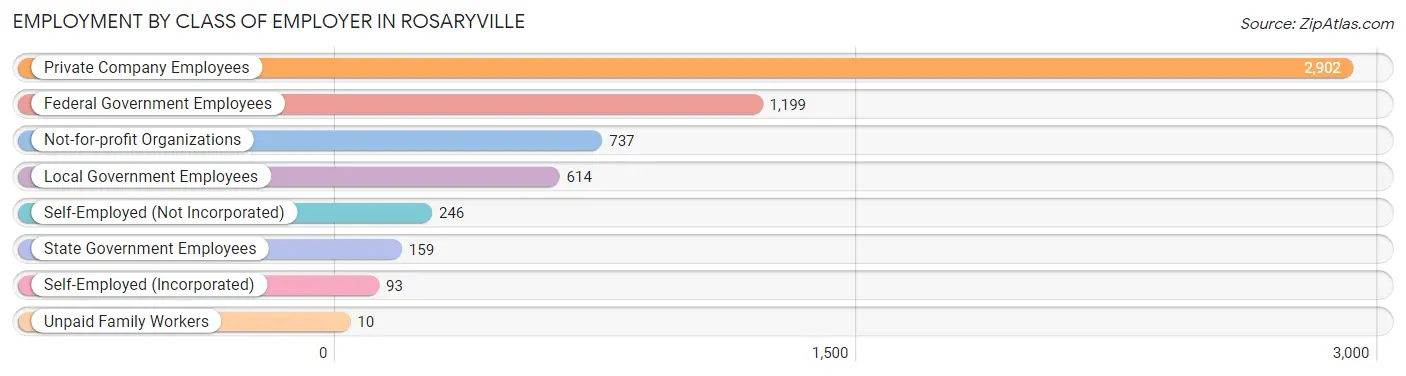
| Employer Class | # Employees | % Employees |
| Private Company Employees | 2,902 | 48.7% |
| Self-Employed (Incorporated) | 93 | 1.6% |
| Self-Employed (Not Incorporated) | 246 | 4.1% |
| Not-for-profit Organizations | 737 | 12.4% |
| Local Government Employees | 614 | 10.3% |
| State Government Employees | 159 | 2.7% |
| Federal Government Employees | 1,199 | 20.1% |
| Unpaid Family Workers | 10 | 0.2% |
| Total | 5,960 | 100.0% |
Employment Status by Age in Rosaryville
According to the labor force statistics for Rosaryville, out of the total population over 16 years of age (9,957), 65.8% or 6,552 individuals are in the labor force, with 7.3% or 478 of them unemployed. The age group with the highest labor force participation rate is 25 to 29 years, with 95.9% or 231 individuals in the labor force. Within the labor force, the 16 to 19 years age range has the highest percentage of unemployed individuals, with 36.3% or 122 of them being unemployed.
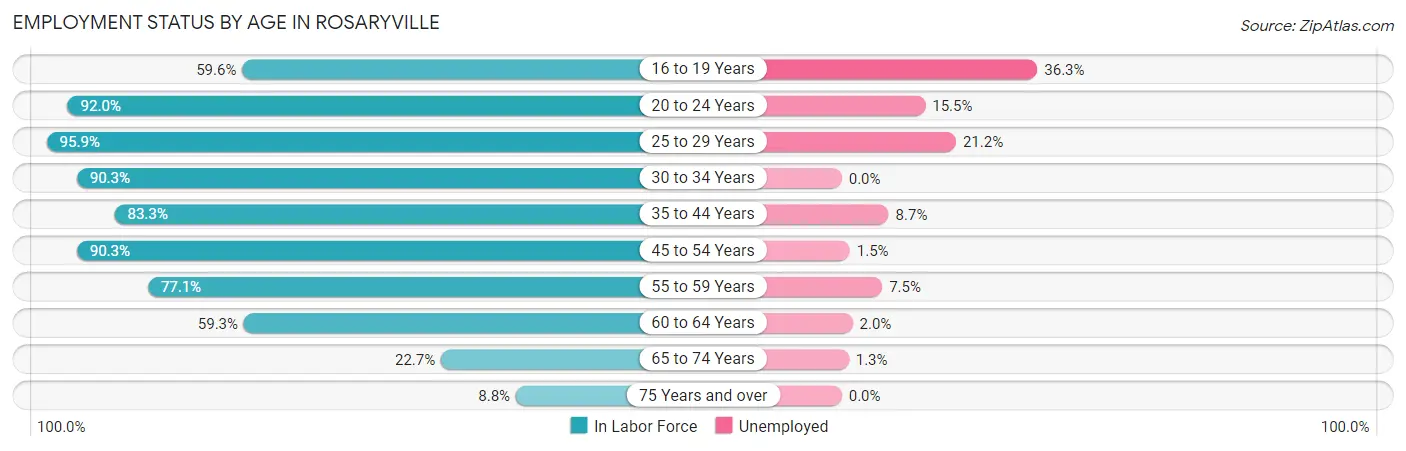
| Age Bracket | In Labor Force | Unemployed |
| 16 to 19 Years | 336 (59.6%) | 122 (36.3%) |
| 20 to 24 Years | 782 (92.0%) | 121 (15.5%) |
| 25 to 29 Years | 231 (95.9%) | 49 (21.2%) |
| 30 to 34 Years | 713 (90.3%) | 0 (0.0%) |
| 35 to 44 Years | 975 (83.3%) | 85 (8.7%) |
| 45 to 54 Years | 1,715 (90.3%) | 26 (1.5%) |
| 55 to 59 Years | 808 (77.1%) | 61 (7.5%) |
| 60 to 64 Years | 488 (59.3%) | 10 (2.0%) |
| 65 to 74 Years | 458 (22.7%) | 6 (1.3%) |
| 75 Years and over | 49 (8.8%) | 0 (0.0%) |
| Total | 6,552 (65.8%) | 478 (7.3%) |
Employment Status by Educational Attainment in Rosaryville
According to labor force statistics for Rosaryville, 82.6% of individuals (4,933) out of the total population between 25 and 64 years of age (5,972) are in the labor force, with 4.7% or 232 of them being unemployed. The group with the highest labor force participation rate are those with the educational attainment of bachelor's degree or higher, with 93.5% or 2,458 individuals in the labor force. Within the labor force, individuals with high school diploma education have the highest percentage of unemployment, with 9.3% or 106 of them being unemployed.
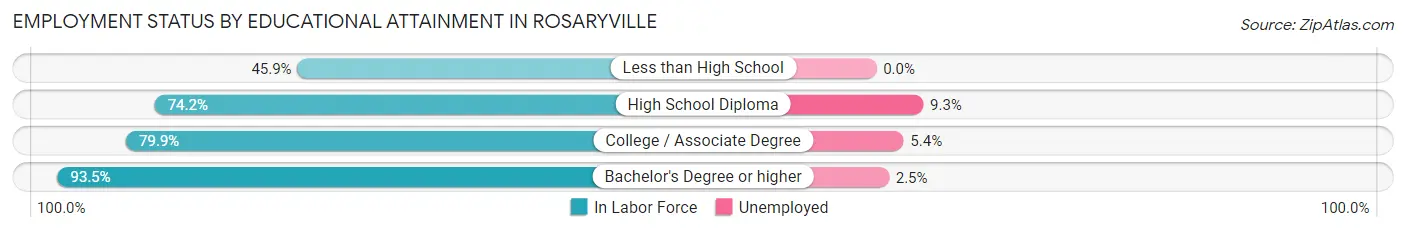
| Educational Attainment | In Labor Force | Unemployed |
| Less than High School | 153 (45.9%) | 0 (0.0%) |
| High School Diploma | 1,140 (74.2%) | 143 (9.3%) |
| College / Associate Degree | 1,177 (79.9%) | 80 (5.4%) |
| Bachelor's Degree or higher | 2,458 (93.5%) | 66 (2.5%) |
| Total | 4,933 (82.6%) | 281 (4.7%) |
Employment Occupations by Sex in Rosaryville
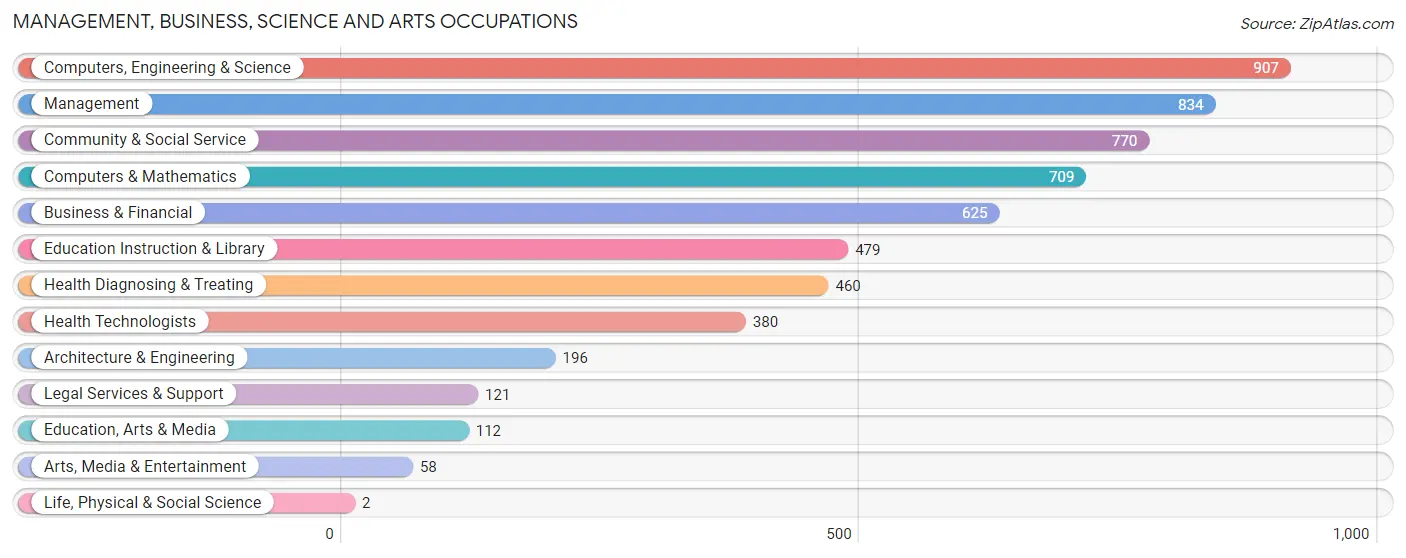
Management, Business, Science and Arts Occupations
The most common Management, Business, Science and Arts occupations in Rosaryville are Computers, Engineering & Science (907 | 14.9%), Management (834 | 13.7%), Community & Social Service (770 | 12.7%), Computers & Mathematics (709 | 11.7%), and Business & Financial (625 | 10.3%).
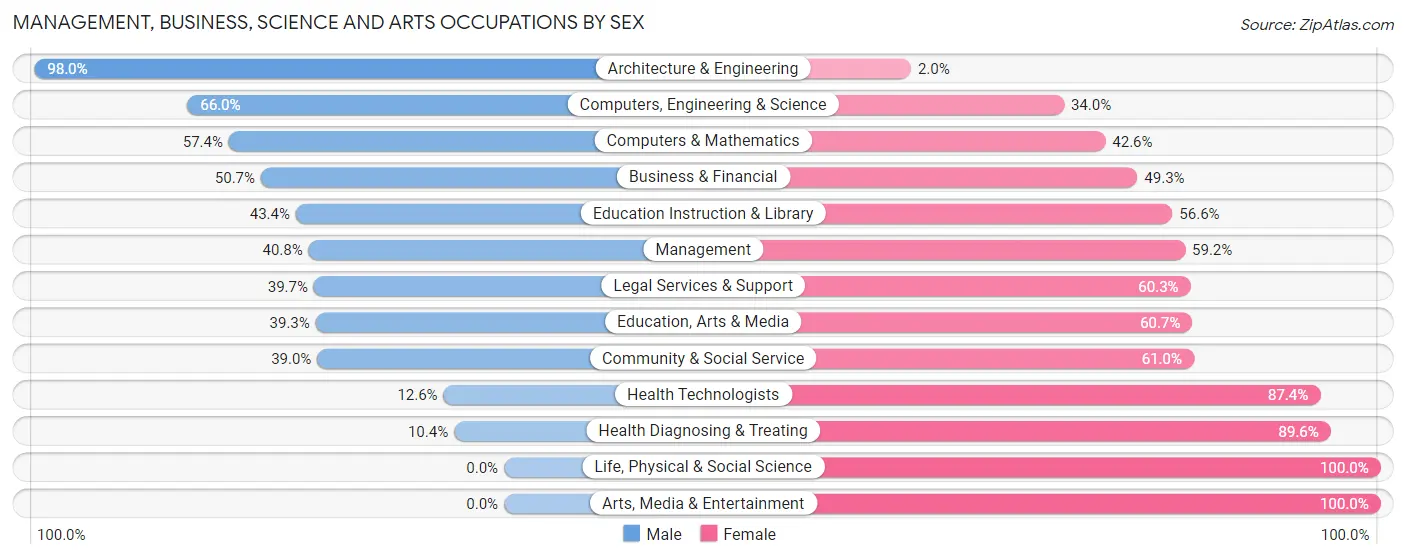
Management, Business, Science and Arts Occupations by Sex
Within the Management, Business, Science and Arts occupations in Rosaryville, the most male-oriented occupations are Architecture & Engineering (98.0%), Computers, Engineering & Science (66.0%), and Computers & Mathematics (57.4%), while the most female-oriented occupations are Life, Physical & Social Science (100.0%), Arts, Media & Entertainment (100.0%), and Health Diagnosing & Treating (89.6%).
| Occupation | Male | Female |
| Management | 340 (40.8%) | 494 (59.2%) |
| Business & Financial | 317 (50.7%) | 308 (49.3%) |
| Computers, Engineering & Science | 599 (66.0%) | 308 (34.0%) |
| Computers & Mathematics | 407 (57.4%) | 302 (42.6%) |
| Architecture & Engineering | 192 (98.0%) | 4 (2.0%) |
| Life, Physical & Social Science | 0 (0.0%) | 2 (100.0%) |
| Community & Social Service | 300 (39.0%) | 470 (61.0%) |
| Education, Arts & Media | 44 (39.3%) | 68 (60.7%) |
| Legal Services & Support | 48 (39.7%) | 73 (60.3%) |
| Education Instruction & Library | 208 (43.4%) | 271 (56.6%) |
| Arts, Media & Entertainment | 0 (0.0%) | 58 (100.0%) |
| Health Diagnosing & Treating | 48 (10.4%) | 412 (89.6%) |
| Health Technologists | 48 (12.6%) | 332 (87.4%) |
| Total (Category) | 1,604 (44.6%) | 1,992 (55.4%) |
| Total (Overall) | 2,948 (48.5%) | 3,128 (51.5%) |
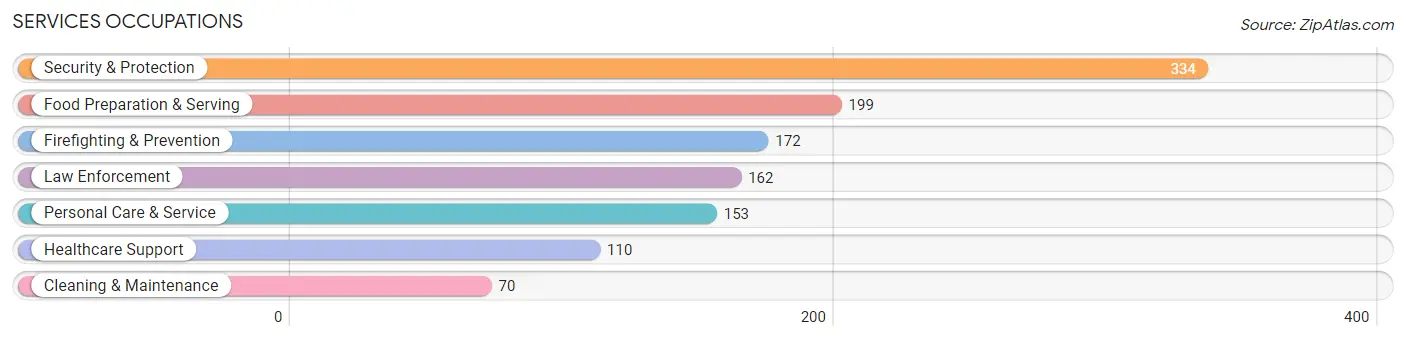
Services Occupations
The most common Services occupations in Rosaryville are Security & Protection (334 | 5.5%), Food Preparation & Serving (199 | 3.3%), Firefighting & Prevention (172 | 2.8%), Law Enforcement (162 | 2.7%), and Personal Care & Service (153 | 2.5%).
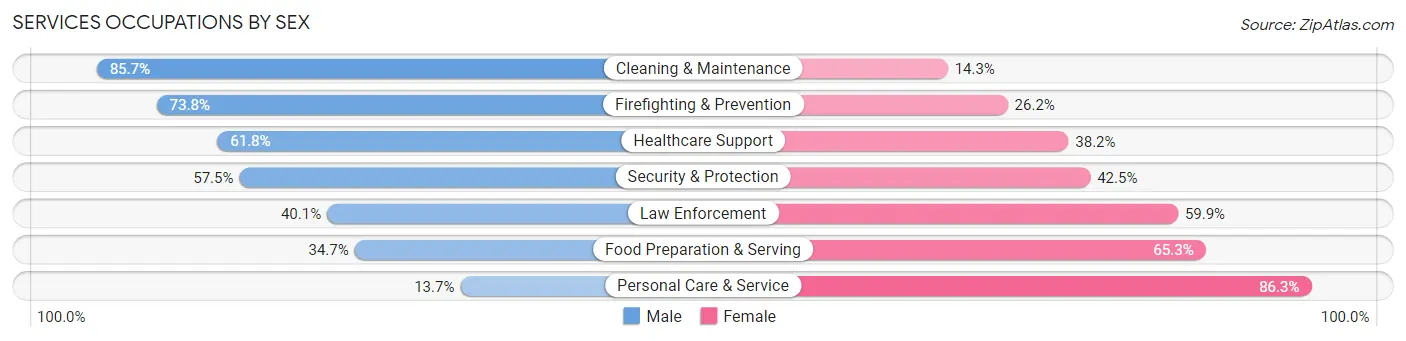
Services Occupations by Sex
Within the Services occupations in Rosaryville, the most male-oriented occupations are Cleaning & Maintenance (85.7%), Firefighting & Prevention (73.8%), and Healthcare Support (61.8%), while the most female-oriented occupations are Personal Care & Service (86.3%), Food Preparation & Serving (65.3%), and Law Enforcement (59.9%).
| Occupation | Male | Female |
| Healthcare Support | 68 (61.8%) | 42 (38.2%) |
| Security & Protection | 192 (57.5%) | 142 (42.5%) |
| Firefighting & Prevention | 127 (73.8%) | 45 (26.2%) |
| Law Enforcement | 65 (40.1%) | 97 (59.9%) |
| Food Preparation & Serving | 69 (34.7%) | 130 (65.3%) |
| Cleaning & Maintenance | 60 (85.7%) | 10 (14.3%) |
| Personal Care & Service | 21 (13.7%) | 132 (86.3%) |
| Total (Category) | 410 (47.3%) | 456 (52.7%) |
| Total (Overall) | 2,948 (48.5%) | 3,128 (51.5%) |
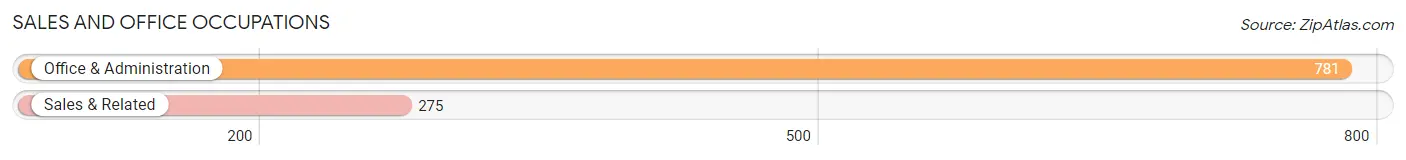
Sales and Office Occupations
The most common Sales and Office occupations in Rosaryville are Office & Administration (781 | 12.9%), and Sales & Related (275 | 4.5%).
Sales and Office Occupations by Sex
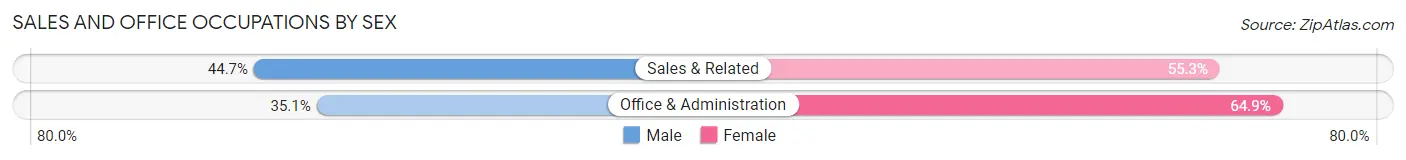
| Occupation | Male | Female |
| Sales & Related | 123 (44.7%) | 152 (55.3%) |
| Office & Administration | 274 (35.1%) | 507 (64.9%) |
| Total (Category) | 397 (37.6%) | 659 (62.4%) |
| Total (Overall) | 2,948 (48.5%) | 3,128 (51.5%) |
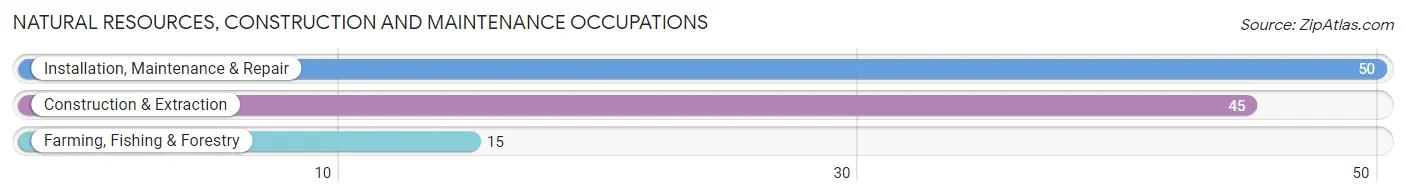
Natural Resources, Construction and Maintenance Occupations
The most common Natural Resources, Construction and Maintenance occupations in Rosaryville are Installation, Maintenance & Repair (50 | 0.8%), Construction & Extraction (45 | 0.7%), and Farming, Fishing & Forestry (15 | 0.3%).
Natural Resources, Construction and Maintenance Occupations by Sex
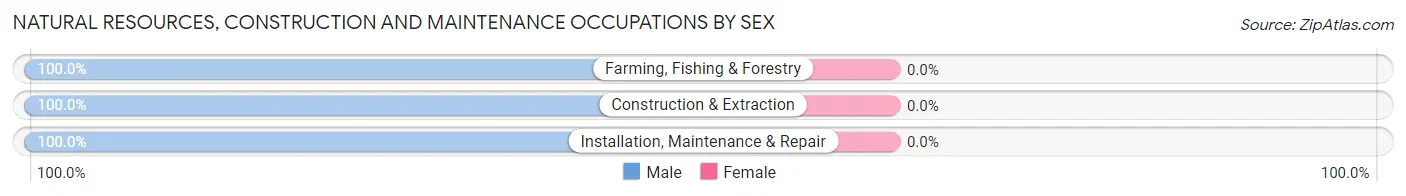
| Occupation | Male | Female |
| Farming, Fishing & Forestry | 15 (100.0%) | 0 (0.0%) |
| Construction & Extraction | 45 (100.0%) | 0 (0.0%) |
| Installation, Maintenance & Repair | 50 (100.0%) | 0 (0.0%) |
| Total (Category) | 110 (100.0%) | 0 (0.0%) |
| Total (Overall) | 2,948 (48.5%) | 3,128 (51.5%) |
Production, Transportation and Moving Occupations
The most common Production, Transportation and Moving occupations in Rosaryville are Transportation (275 | 4.5%), Production (106 | 1.7%), and Material Moving (67 | 1.1%).
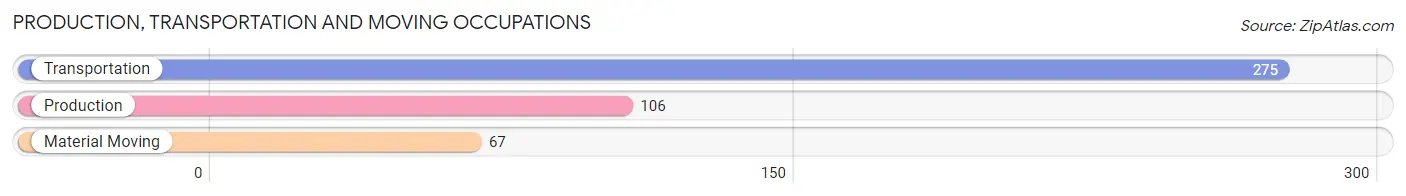
Production, Transportation and Moving Occupations by Sex
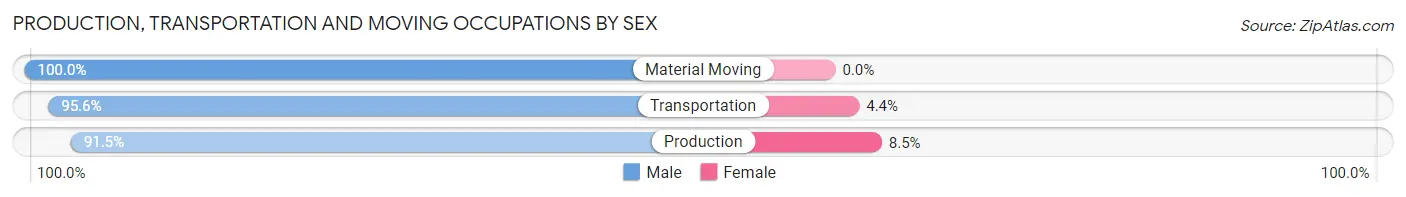
| Occupation | Male | Female |
| Production | 97 (91.5%) | 9 (8.5%) |
| Transportation | 263 (95.6%) | 12 (4.4%) |
| Material Moving | 67 (100.0%) | 0 (0.0%) |
| Total (Category) | 427 (95.3%) | 21 (4.7%) |
| Total (Overall) | 2,948 (48.5%) | 3,128 (51.5%) |
Employment Industries by Sex in Rosaryville
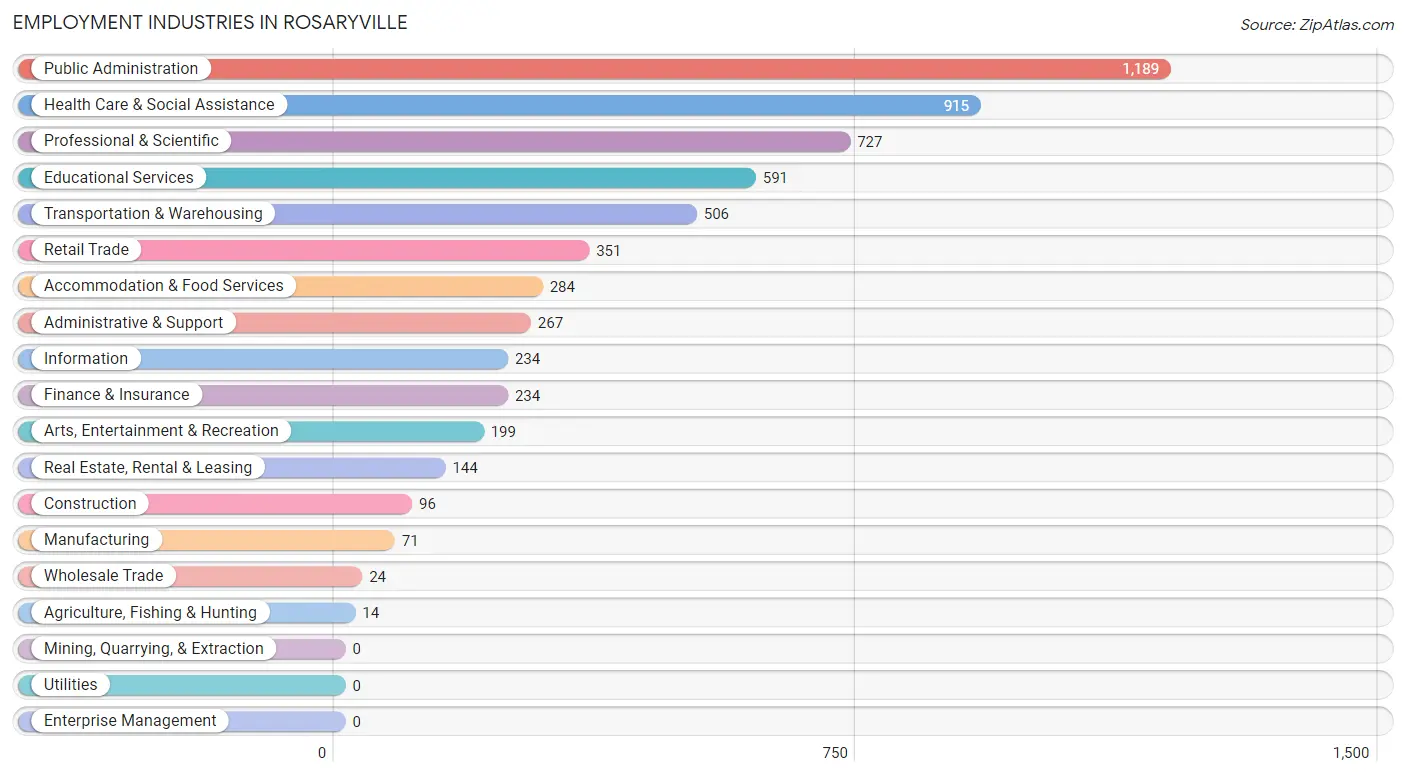
Employment Industries in Rosaryville
The major employment industries in Rosaryville include Public Administration (1,189 | 19.6%), Health Care & Social Assistance (915 | 15.1%), Professional & Scientific (727 | 12.0%), Educational Services (591 | 9.7%), and Transportation & Warehousing (506 | 8.3%).
Employment Industries by Sex in Rosaryville
The Rosaryville industries that see more men than women are Agriculture, Fishing & Hunting (100.0%), Construction (100.0%), and Manufacturing (100.0%), whereas the industries that tend to have a higher number of women are Health Care & Social Assistance (81.3%), Accommodation & Food Services (73.6%), and Public Administration (64.2%).
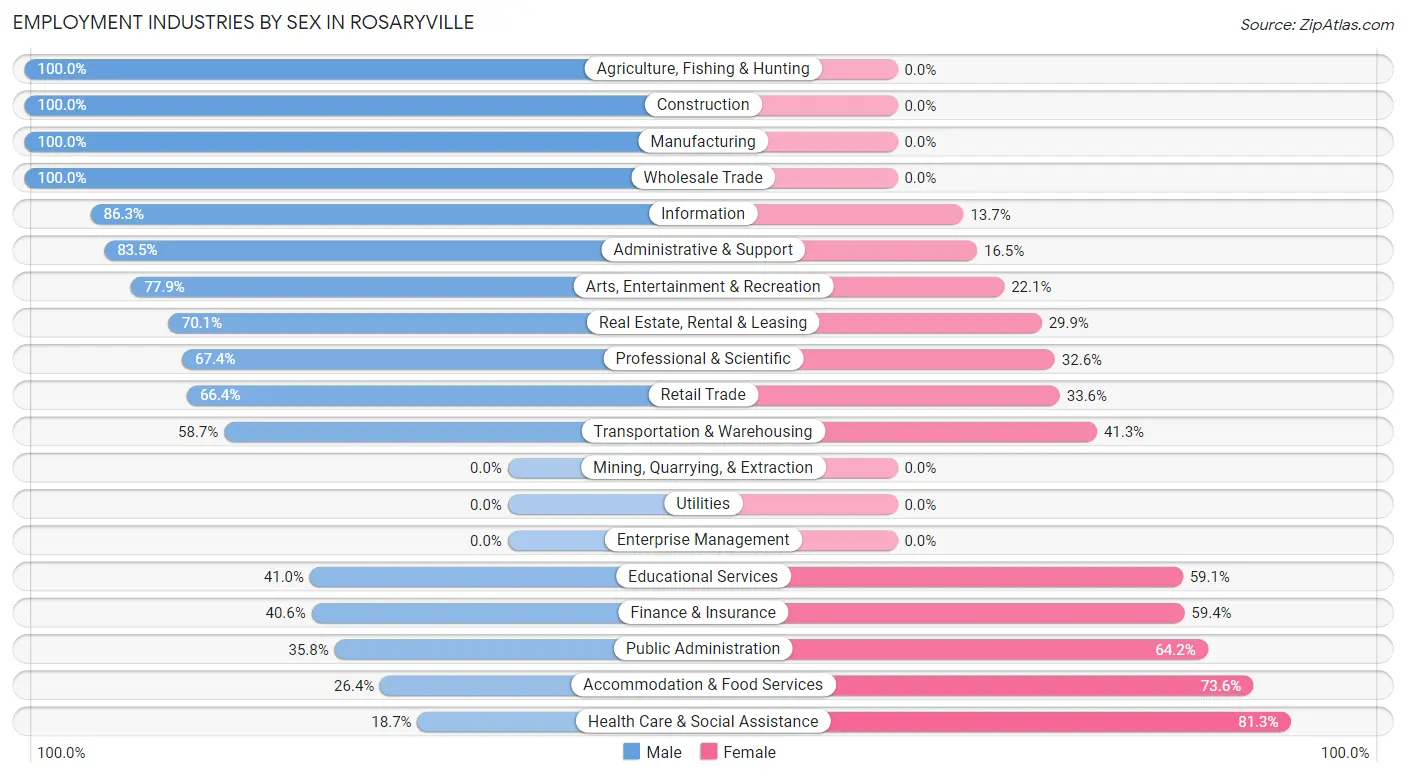
| Industry | Male | Female |
| Agriculture, Fishing & Hunting | 14 (100.0%) | 0 (0.0%) |
| Mining, Quarrying, & Extraction | 0 (0.0%) | 0 (0.0%) |
| Construction | 96 (100.0%) | 0 (0.0%) |
| Manufacturing | 71 (100.0%) | 0 (0.0%) |
| Wholesale Trade | 24 (100.0%) | 0 (0.0%) |
| Retail Trade | 233 (66.4%) | 118 (33.6%) |
| Transportation & Warehousing | 297 (58.7%) | 209 (41.3%) |
| Utilities | 0 (0.0%) | 0 (0.0%) |
| Information | 202 (86.3%) | 32 (13.7%) |
| Finance & Insurance | 95 (40.6%) | 139 (59.4%) |
| Real Estate, Rental & Leasing | 101 (70.1%) | 43 (29.9%) |
| Professional & Scientific | 490 (67.4%) | 237 (32.6%) |
| Enterprise Management | 0 (0.0%) | 0 (0.0%) |
| Administrative & Support | 223 (83.5%) | 44 (16.5%) |
| Educational Services | 242 (40.9%) | 349 (59.1%) |
| Health Care & Social Assistance | 171 (18.7%) | 744 (81.3%) |
| Arts, Entertainment & Recreation | 155 (77.9%) | 44 (22.1%) |
| Accommodation & Food Services | 75 (26.4%) | 209 (73.6%) |
| Public Administration | 426 (35.8%) | 763 (64.2%) |
| Total | 2,948 (48.5%) | 3,128 (51.5%) |
Education in Rosaryville
School Enrollment in Rosaryville
The most common levels of schooling among the 2,707 students in Rosaryville are high school (624 | 23.1%), college / undergraduate (613 | 22.6%), and elementary school (444 | 16.4%).
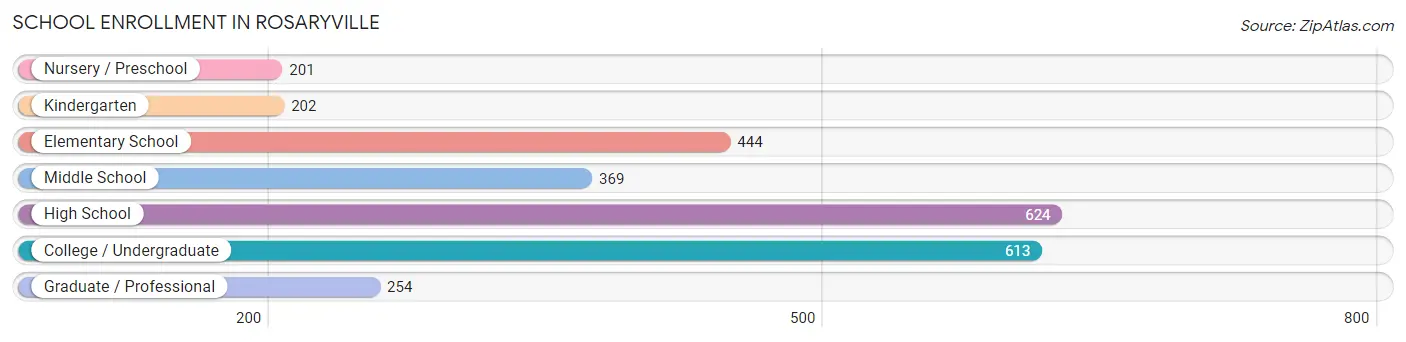
| School Level | # Students | % Students |
| Nursery / Preschool | 201 | 7.4% |
| Kindergarten | 202 | 7.5% |
| Elementary School | 444 | 16.4% |
| Middle School | 369 | 13.6% |
| High School | 624 | 23.1% |
| College / Undergraduate | 613 | 22.6% |
| Graduate / Professional | 254 | 9.4% |
| Total | 2,707 | 100.0% |
School Enrollment by Age by Funding Source in Rosaryville
Out of a total of 2,707 students who are enrolled in schools in Rosaryville, 639 (23.6%) attend a private institution, while the remaining 2,068 (76.4%) are enrolled in public schools. The age group of 18 to 19 year olds has the highest likelihood of being enrolled in private schools, with 62 (35.8% in the age bracket) enrolled. Conversely, the age group of 20 to 24 year olds has the lowest likelihood of being enrolled in a private school, with 247 (99.6% in the age bracket) attending a public institution.
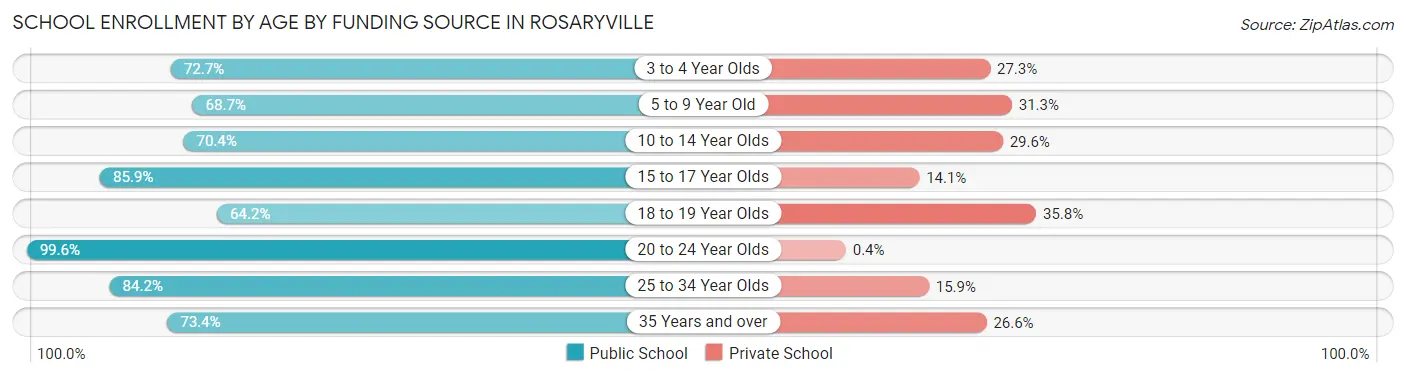
| Age Bracket | Public School | Private School |
| 3 to 4 Year Olds | 176 (72.7%) | 66 (27.3%) |
| 5 to 9 Year Old | 397 (68.7%) | 181 (31.3%) |
| 10 to 14 Year Olds | 297 (70.4%) | 125 (29.6%) |
| 15 to 17 Year Olds | 391 (85.9%) | 64 (14.1%) |
| 18 to 19 Year Olds | 111 (64.2%) | 62 (35.8%) |
| 20 to 24 Year Olds | 247 (99.6%) | 1 (0.4%) |
| 25 to 34 Year Olds | 138 (84.2%) | 26 (15.9%) |
| 35 Years and over | 312 (73.4%) | 113 (26.6%) |
| Total | 2,068 (76.4%) | 639 (23.6%) |
Educational Attainment by Field of Study in Rosaryville
Business (1,364 | 36.1%), computers & mathematics (458 | 12.1%), science & technology (360 | 9.5%), social sciences (274 | 7.2%), and communications (246 | 6.5%) are the most common fields of study among 3,778 individuals in Rosaryville who have obtained a bachelor's degree or higher.
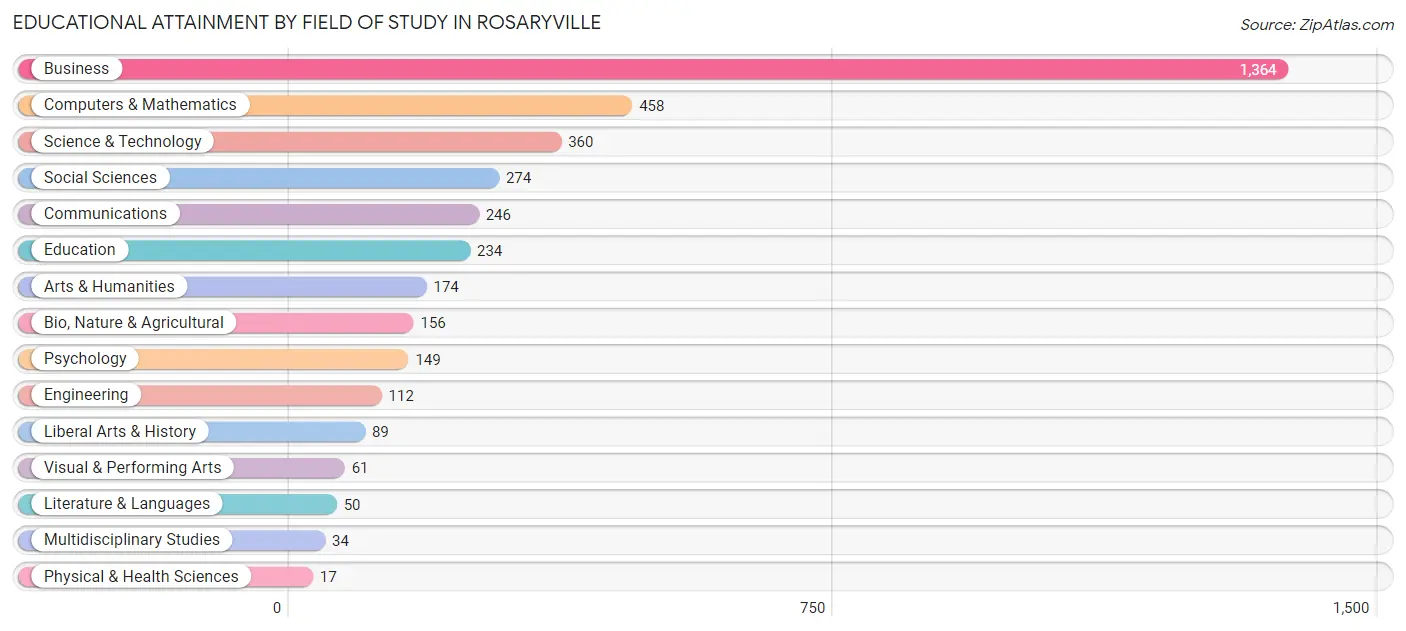
| Field of Study | # Graduates | % Graduates |
| Computers & Mathematics | 458 | 12.1% |
| Bio, Nature & Agricultural | 156 | 4.1% |
| Physical & Health Sciences | 17 | 0.4% |
| Psychology | 149 | 3.9% |
| Social Sciences | 274 | 7.2% |
| Engineering | 112 | 3.0% |
| Multidisciplinary Studies | 34 | 0.9% |
| Science & Technology | 360 | 9.5% |
| Business | 1,364 | 36.1% |
| Education | 234 | 6.2% |
| Literature & Languages | 50 | 1.3% |
| Liberal Arts & History | 89 | 2.4% |
| Visual & Performing Arts | 61 | 1.6% |
| Communications | 246 | 6.5% |
| Arts & Humanities | 174 | 4.6% |
| Total | 3,778 | 100.0% |
Transportation & Commute in Rosaryville
Vehicle Availability by Sex in Rosaryville
The most prevalent vehicle ownership categories in Rosaryville are males with 2 vehicles (848, accounting for 29.6%) and females with 2 vehicles (749, making up 27.5%).
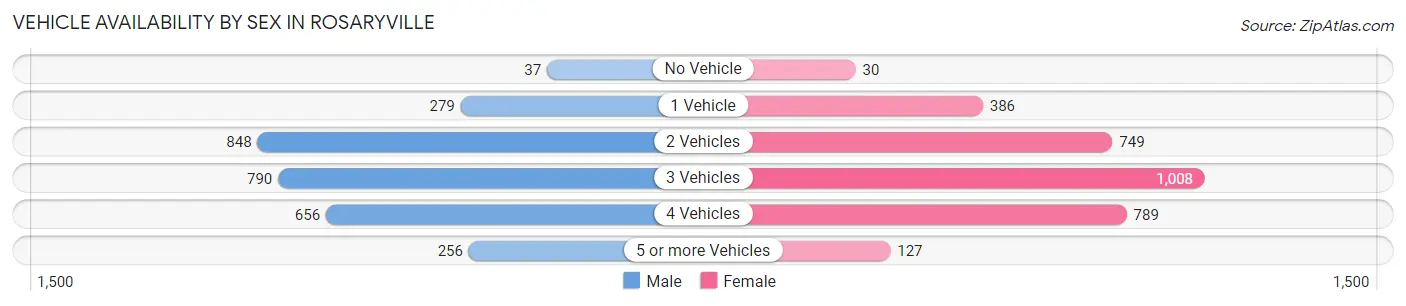
| Vehicles Available | Male | Female |
| No Vehicle | 37 (1.3%) | 30 (1.0%) |
| 1 Vehicle | 279 (9.7%) | 386 (12.5%) |
| 2 Vehicles | 848 (29.6%) | 749 (24.2%) |
| 3 Vehicles | 790 (27.6%) | 1,008 (32.6%) |
| 4 Vehicles | 656 (22.9%) | 789 (25.5%) |
| 5 or more Vehicles | 256 (8.9%) | 127 (4.1%) |
| Total | 2,866 (100.0%) | 3,089 (100.0%) |
Commute Time in Rosaryville
The most frequently occuring commute durations in Rosaryville are 30 to 34 minutes (1,166 commuters, 22.9%), 45 to 59 minutes (1,040 commuters, 20.4%), and 60 to 89 minutes (654 commuters, 12.8%).
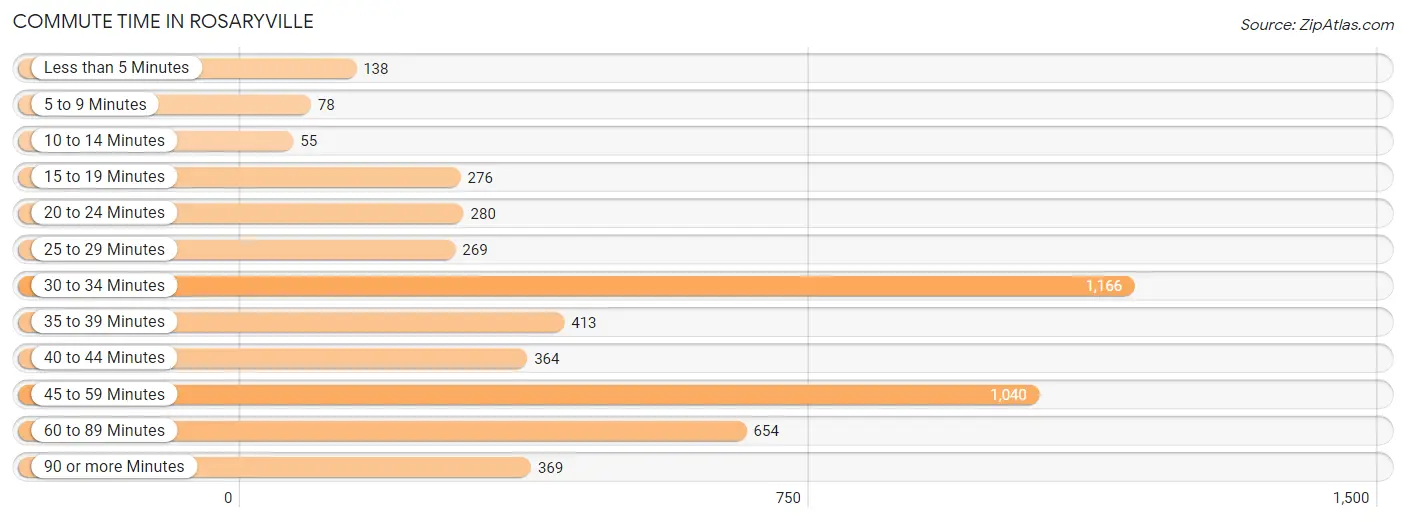
| Commute Time | # Commuters | % Commuters |
| Less than 5 Minutes | 138 | 2.7% |
| 5 to 9 Minutes | 78 | 1.5% |
| 10 to 14 Minutes | 55 | 1.1% |
| 15 to 19 Minutes | 276 | 5.4% |
| 20 to 24 Minutes | 280 | 5.5% |
| 25 to 29 Minutes | 269 | 5.3% |
| 30 to 34 Minutes | 1,166 | 22.9% |
| 35 to 39 Minutes | 413 | 8.1% |
| 40 to 44 Minutes | 364 | 7.1% |
| 45 to 59 Minutes | 1,040 | 20.4% |
| 60 to 89 Minutes | 654 | 12.8% |
| 90 or more Minutes | 369 | 7.2% |
Commute Time by Sex in Rosaryville
The most common commute times in Rosaryville are 30 to 34 minutes (515 commuters, 20.4%) for males and 30 to 34 minutes (651 commuters, 25.2%) for females.
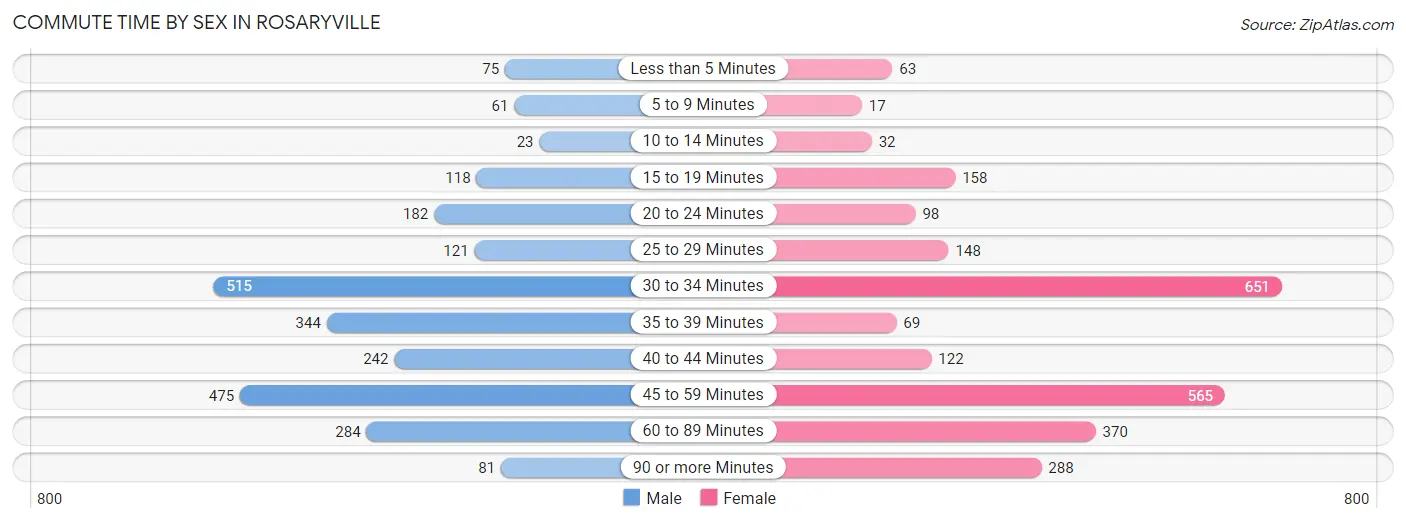
| Commute Time | Male | Female |
| Less than 5 Minutes | 75 (3.0%) | 63 (2.4%) |
| 5 to 9 Minutes | 61 (2.4%) | 17 (0.7%) |
| 10 to 14 Minutes | 23 (0.9%) | 32 (1.2%) |
| 15 to 19 Minutes | 118 (4.7%) | 158 (6.1%) |
| 20 to 24 Minutes | 182 (7.2%) | 98 (3.8%) |
| 25 to 29 Minutes | 121 (4.8%) | 148 (5.7%) |
| 30 to 34 Minutes | 515 (20.4%) | 651 (25.2%) |
| 35 to 39 Minutes | 344 (13.7%) | 69 (2.7%) |
| 40 to 44 Minutes | 242 (9.6%) | 122 (4.7%) |
| 45 to 59 Minutes | 475 (18.8%) | 565 (21.9%) |
| 60 to 89 Minutes | 284 (11.3%) | 370 (14.3%) |
| 90 or more Minutes | 81 (3.2%) | 288 (11.2%) |
Time of Departure to Work by Sex in Rosaryville
The most frequent times of departure to work in Rosaryville are 12:00 AM to 4:59 AM (333, 13.2%) for males and 5:30 AM to 5:59 AM (401, 15.5%) for females.
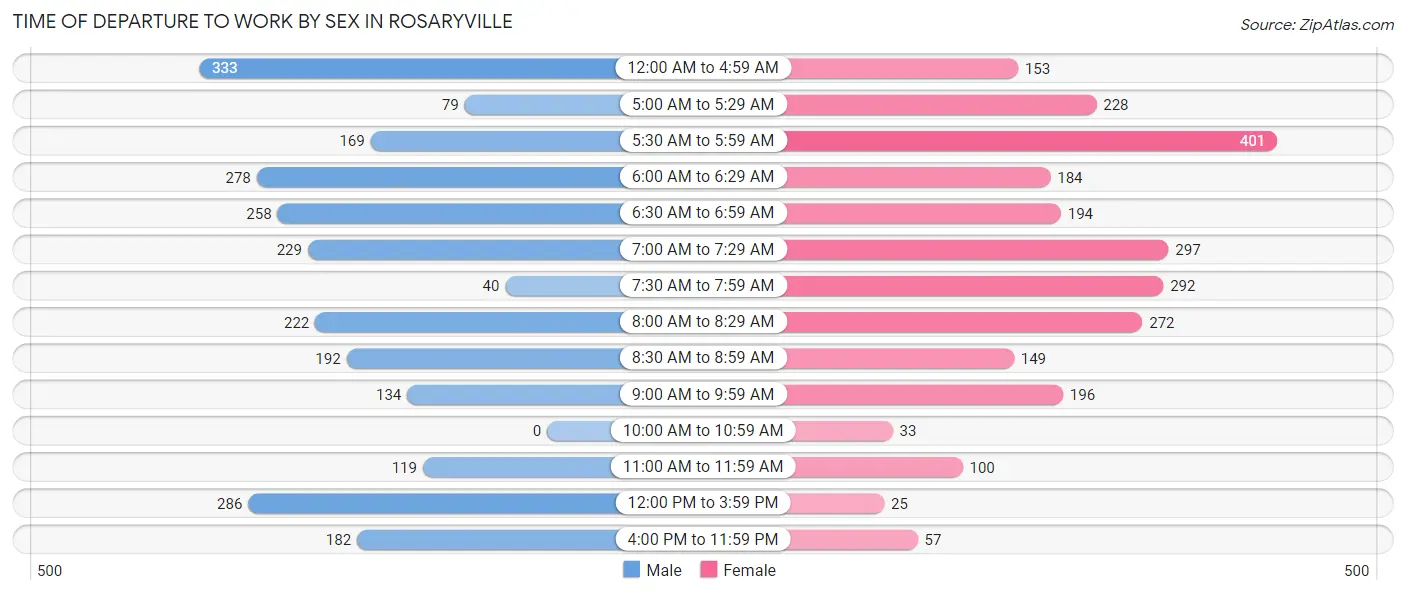
| Time of Departure | Male | Female |
| 12:00 AM to 4:59 AM | 333 (13.2%) | 153 (5.9%) |
| 5:00 AM to 5:29 AM | 79 (3.1%) | 228 (8.8%) |
| 5:30 AM to 5:59 AM | 169 (6.7%) | 401 (15.5%) |
| 6:00 AM to 6:29 AM | 278 (11.0%) | 184 (7.1%) |
| 6:30 AM to 6:59 AM | 258 (10.2%) | 194 (7.5%) |
| 7:00 AM to 7:29 AM | 229 (9.1%) | 297 (11.5%) |
| 7:30 AM to 7:59 AM | 40 (1.6%) | 292 (11.3%) |
| 8:00 AM to 8:29 AM | 222 (8.8%) | 272 (10.5%) |
| 8:30 AM to 8:59 AM | 192 (7.6%) | 149 (5.8%) |
| 9:00 AM to 9:59 AM | 134 (5.3%) | 196 (7.6%) |
| 10:00 AM to 10:59 AM | 0 (0.0%) | 33 (1.3%) |
| 11:00 AM to 11:59 AM | 119 (4.7%) | 100 (3.9%) |
| 12:00 PM to 3:59 PM | 286 (11.3%) | 25 (1.0%) |
| 4:00 PM to 11:59 PM | 182 (7.2%) | 57 (2.2%) |
| Total | 2,521 (100.0%) | 2,581 (100.0%) |
Housing Occupancy in Rosaryville
Occupancy by Ownership in Rosaryville
Of the total 3,767 dwellings in Rosaryville, owner-occupied units account for 3,438 (91.3%), while renter-occupied units make up 329 (8.7%).
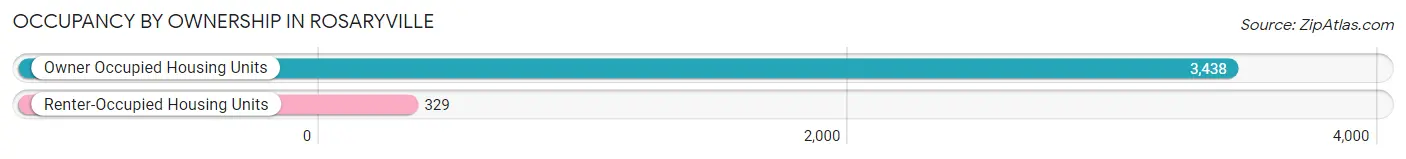
| Occupancy | # Housing Units | % Housing Units |
| Owner Occupied Housing Units | 3,438 | 91.3% |
| Renter-Occupied Housing Units | 329 | 8.7% |
| Total Occupied Housing Units | 3,767 | 100.0% |
Occupancy by Household Size in Rosaryville
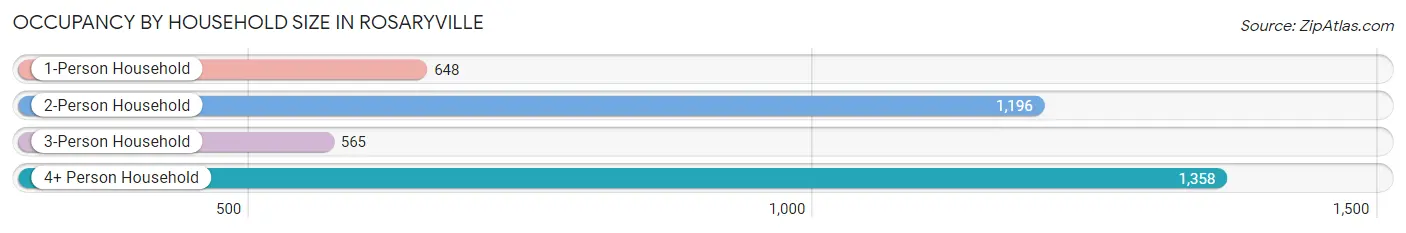
| Household Size | # Housing Units | % Housing Units |
| 1-Person Household | 648 | 17.2% |
| 2-Person Household | 1,196 | 31.8% |
| 3-Person Household | 565 | 15.0% |
| 4+ Person Household | 1,358 | 36.0% |
| Total Housing Units | 3,767 | 100.0% |
Occupancy by Ownership by Household Size in Rosaryville
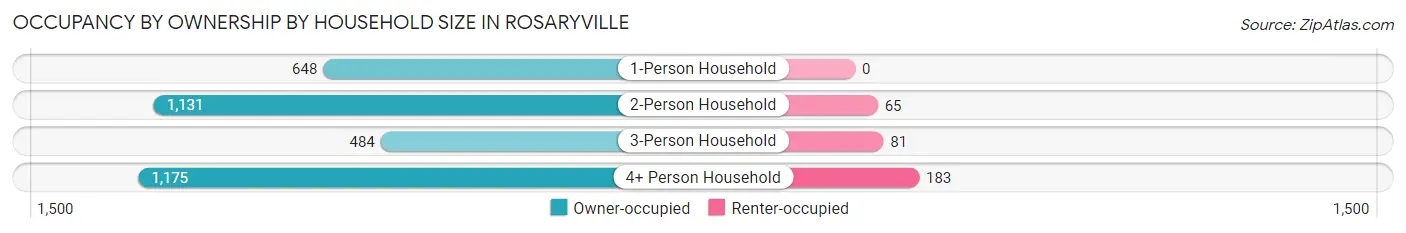
| Household Size | Owner-occupied | Renter-occupied |
| 1-Person Household | 648 (100.0%) | 0 (0.0%) |
| 2-Person Household | 1,131 (94.6%) | 65 (5.4%) |
| 3-Person Household | 484 (85.7%) | 81 (14.3%) |
| 4+ Person Household | 1,175 (86.5%) | 183 (13.5%) |
| Total Housing Units | 3,438 (91.3%) | 329 (8.7%) |
Occupancy by Educational Attainment in Rosaryville
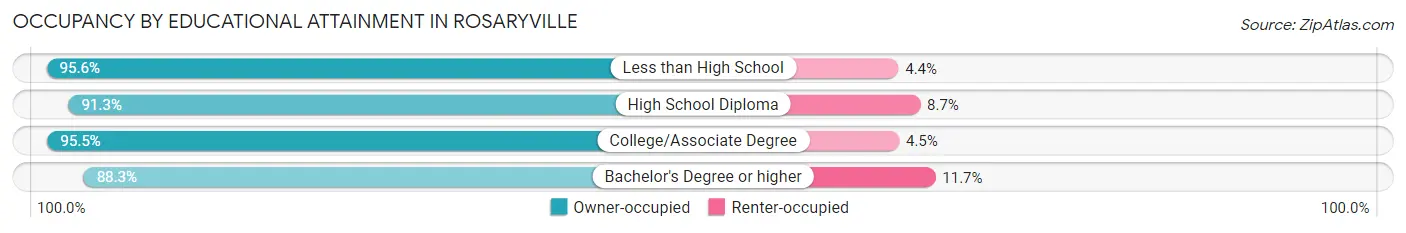
| Household Size | Owner-occupied | Renter-occupied |
| Less than High School | 131 (95.6%) | 6 (4.4%) |
| High School Diploma | 608 (91.3%) | 58 (8.7%) |
| College/Associate Degree | 1,096 (95.5%) | 52 (4.5%) |
| Bachelor's Degree or higher | 1,603 (88.3%) | 213 (11.7%) |
Occupancy by Age of Householder in Rosaryville
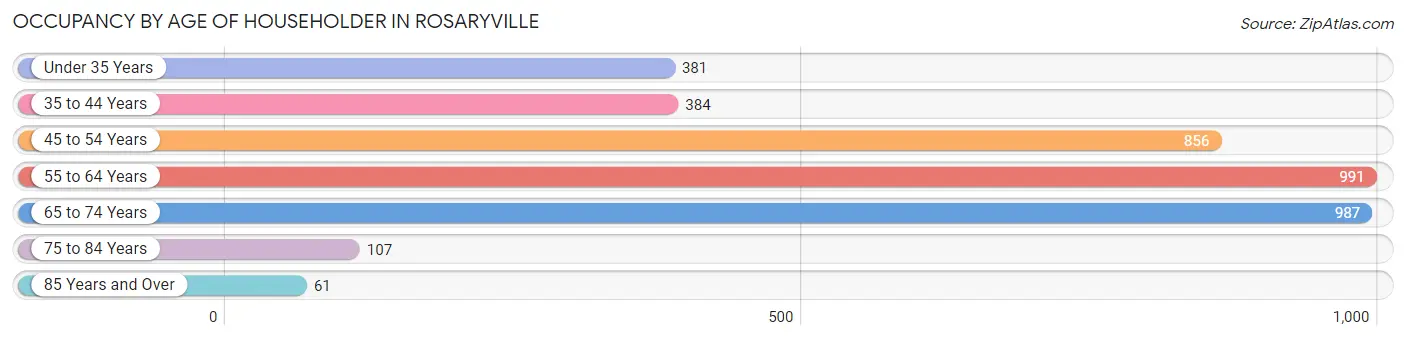
| Age Bracket | # Households | % Households |
| Under 35 Years | 381 | 10.1% |
| 35 to 44 Years | 384 | 10.2% |
| 45 to 54 Years | 856 | 22.7% |
| 55 to 64 Years | 991 | 26.3% |
| 65 to 74 Years | 987 | 26.2% |
| 75 to 84 Years | 107 | 2.8% |
| 85 Years and Over | 61 | 1.6% |
| Total | 3,767 | 100.0% |
Housing Finances in Rosaryville
Median Income by Occupancy in Rosaryville
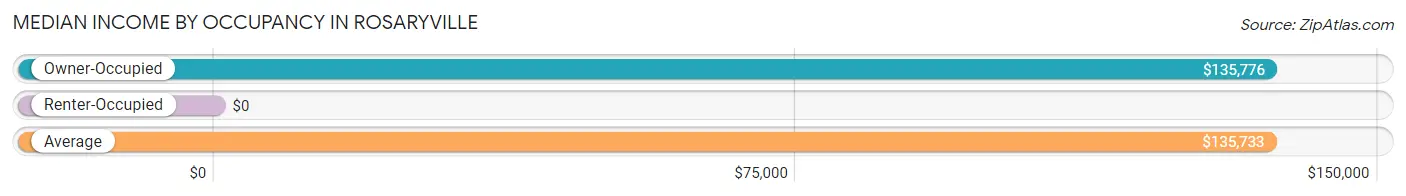
| Occupancy Type | # Households | Median Income |
| Owner-Occupied | 3,438 (91.3%) | $135,776 |
| Renter-Occupied | 329 (8.7%) | $0 |
| Average | 3,767 (100.0%) | $135,733 |
Occupancy by Householder Income Bracket in Rosaryville
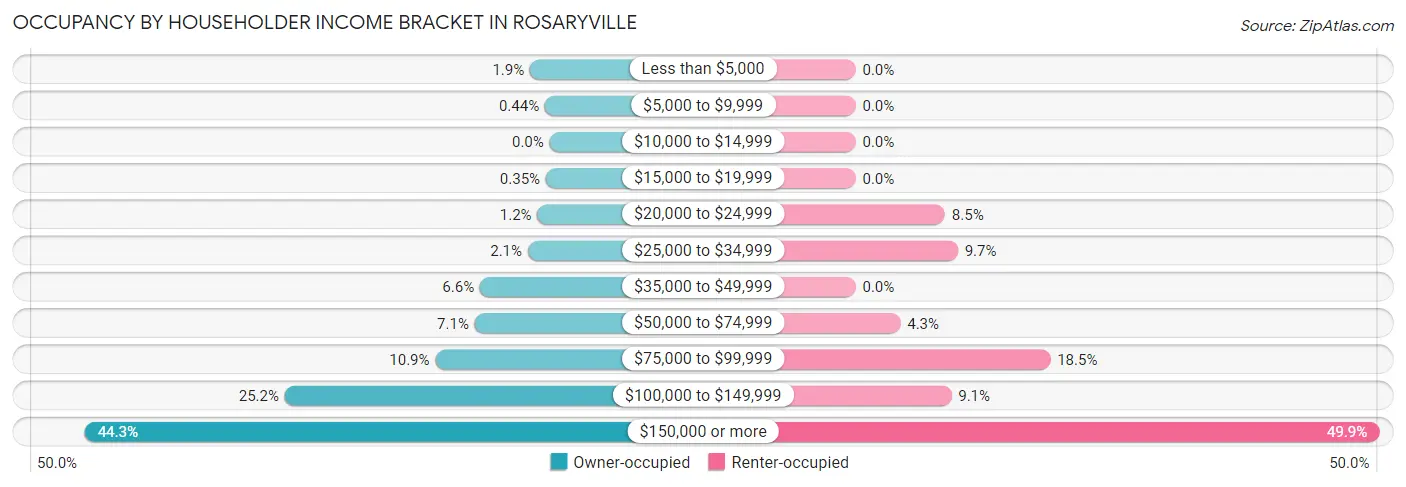
| Income Bracket | Owner-occupied | Renter-occupied |
| Less than $5,000 | 64 (1.9%) | 0 (0.0%) |
| $5,000 to $9,999 | 15 (0.4%) | 0 (0.0%) |
| $10,000 to $14,999 | 0 (0.0%) | 0 (0.0%) |
| $15,000 to $19,999 | 12 (0.4%) | 0 (0.0%) |
| $20,000 to $24,999 | 40 (1.2%) | 28 (8.5%) |
| $25,000 to $34,999 | 71 (2.1%) | 32 (9.7%) |
| $35,000 to $49,999 | 228 (6.6%) | 0 (0.0%) |
| $50,000 to $74,999 | 245 (7.1%) | 14 (4.3%) |
| $75,000 to $99,999 | 374 (10.9%) | 61 (18.5%) |
| $100,000 to $149,999 | 867 (25.2%) | 30 (9.1%) |
| $150,000 or more | 1,522 (44.3%) | 164 (49.8%) |
| Total | 3,438 (100.0%) | 329 (100.0%) |
Monthly Housing Cost Tiers in Rosaryville
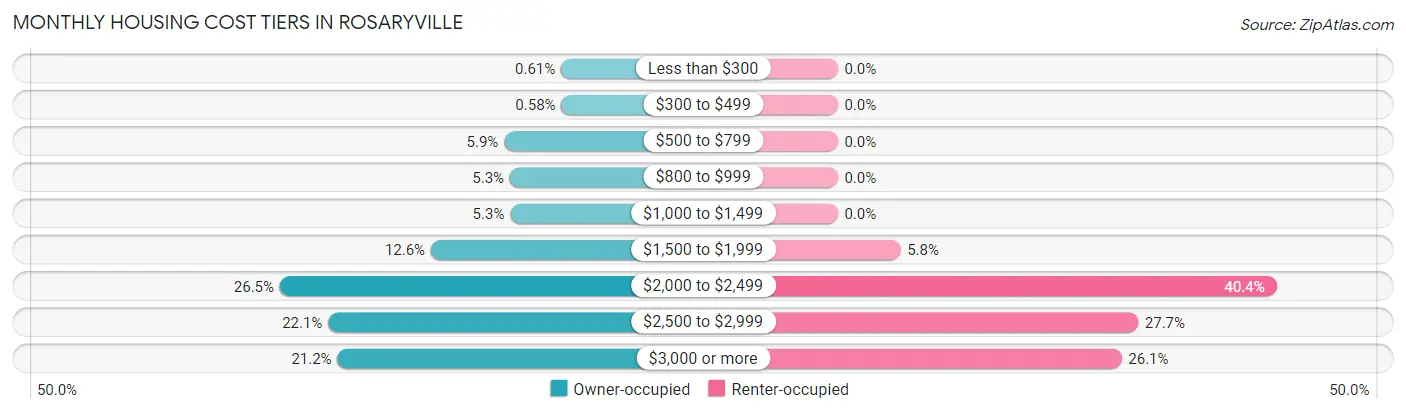
| Monthly Cost | Owner-occupied | Renter-occupied |
| Less than $300 | 21 (0.6%) | 0 (0.0%) |
| $300 to $499 | 20 (0.6%) | 0 (0.0%) |
| $500 to $799 | 201 (5.9%) | 0 (0.0%) |
| $800 to $999 | 183 (5.3%) | 0 (0.0%) |
| $1,000 to $1,499 | 182 (5.3%) | 0 (0.0%) |
| $1,500 to $1,999 | 433 (12.6%) | 19 (5.8%) |
| $2,000 to $2,499 | 911 (26.5%) | 133 (40.4%) |
| $2,500 to $2,999 | 758 (22.1%) | 91 (27.7%) |
| $3,000 or more | 729 (21.2%) | 86 (26.1%) |
| Total | 3,438 (100.0%) | 329 (100.0%) |
Physical Housing Characteristics in Rosaryville
Housing Structures in Rosaryville
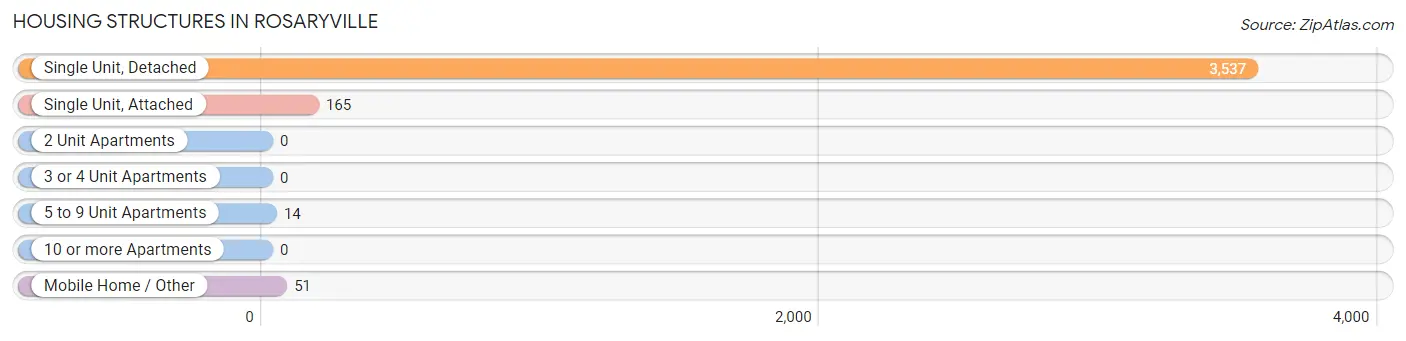
| Structure Type | # Housing Units | % Housing Units |
| Single Unit, Detached | 3,537 | 93.9% |
| Single Unit, Attached | 165 | 4.4% |
| 2 Unit Apartments | 0 | 0.0% |
| 3 or 4 Unit Apartments | 0 | 0.0% |
| 5 to 9 Unit Apartments | 14 | 0.4% |
| 10 or more Apartments | 0 | 0.0% |
| Mobile Home / Other | 51 | 1.3% |
| Total | 3,767 | 100.0% |
Housing Structures by Occupancy in Rosaryville
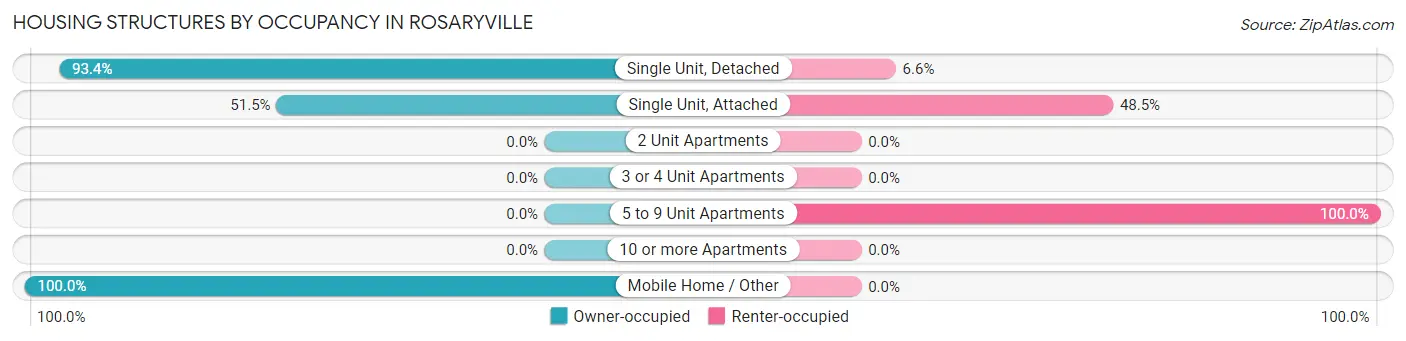
| Structure Type | Owner-occupied | Renter-occupied |
| Single Unit, Detached | 3,302 (93.4%) | 235 (6.6%) |
| Single Unit, Attached | 85 (51.5%) | 80 (48.5%) |
| 2 Unit Apartments | 0 (0.0%) | 0 (0.0%) |
| 3 or 4 Unit Apartments | 0 (0.0%) | 0 (0.0%) |
| 5 to 9 Unit Apartments | 0 (0.0%) | 14 (100.0%) |
| 10 or more Apartments | 0 (0.0%) | 0 (0.0%) |
| Mobile Home / Other | 51 (100.0%) | 0 (0.0%) |
| Total | 3,438 (91.3%) | 329 (8.7%) |
Housing Structures by Number of Rooms in Rosaryville
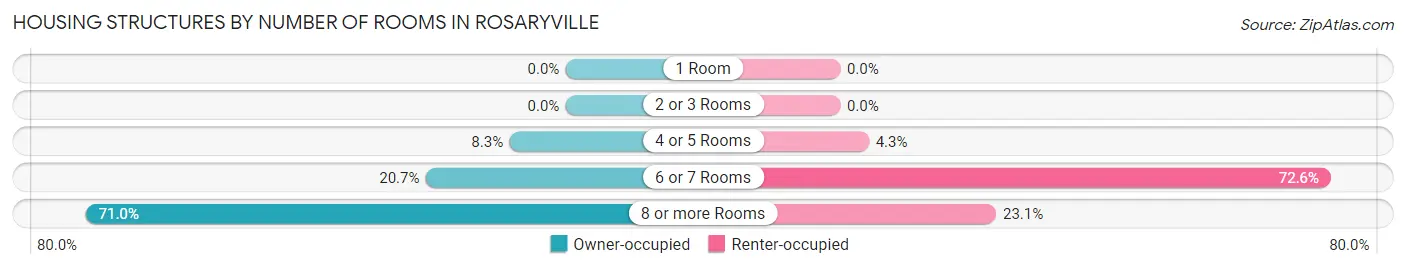
| Number of Rooms | Owner-occupied | Renter-occupied |
| 1 Room | 0 (0.0%) | 0 (0.0%) |
| 2 or 3 Rooms | 0 (0.0%) | 0 (0.0%) |
| 4 or 5 Rooms | 286 (8.3%) | 14 (4.3%) |
| 6 or 7 Rooms | 712 (20.7%) | 239 (72.6%) |
| 8 or more Rooms | 2,440 (71.0%) | 76 (23.1%) |
| Total | 3,438 (100.0%) | 329 (100.0%) |
Housing Structure by Heating Type in Rosaryville
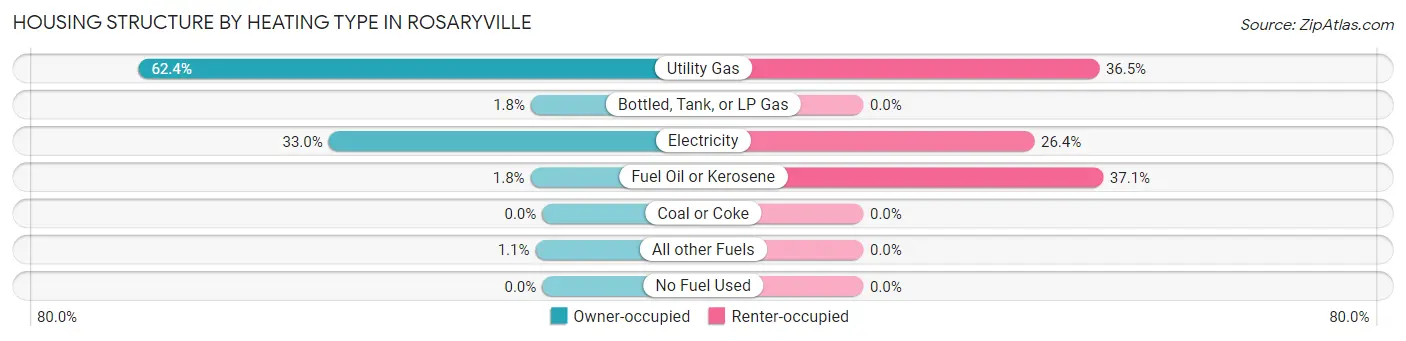
| Heating Type | Owner-occupied | Renter-occupied |
| Utility Gas | 2,145 (62.4%) | 120 (36.5%) |
| Bottled, Tank, or LP Gas | 60 (1.8%) | 0 (0.0%) |
| Electricity | 1,135 (33.0%) | 87 (26.4%) |
| Fuel Oil or Kerosene | 62 (1.8%) | 122 (37.1%) |
| Coal or Coke | 0 (0.0%) | 0 (0.0%) |
| All other Fuels | 36 (1.1%) | 0 (0.0%) |
| No Fuel Used | 0 (0.0%) | 0 (0.0%) |
| Total | 3,438 (100.0%) | 329 (100.0%) |
Household Vehicle Usage in Rosaryville
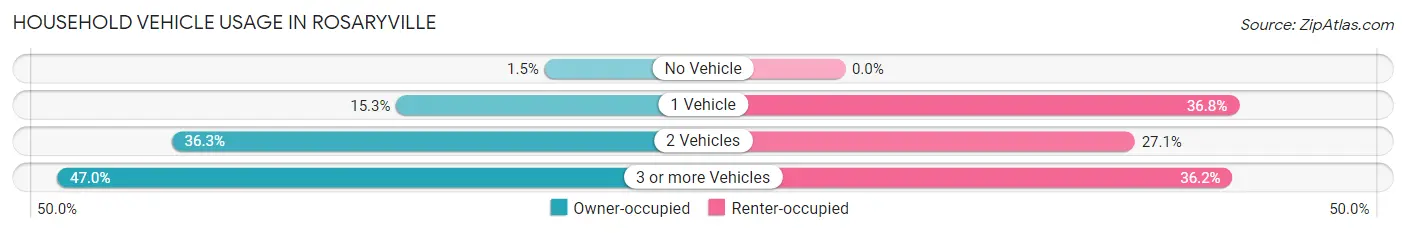
| Vehicles per Household | Owner-occupied | Renter-occupied |
| No Vehicle | 50 (1.5%) | 0 (0.0%) |
| 1 Vehicle | 526 (15.3%) | 121 (36.8%) |
| 2 Vehicles | 1,247 (36.3%) | 89 (27.1%) |
| 3 or more Vehicles | 1,615 (47.0%) | 119 (36.2%) |
| Total | 3,438 (100.0%) | 329 (100.0%) |
Real Estate & Mortgages in Rosaryville
Real Estate and Mortgage Overview in Rosaryville
| Characteristic | Without Mortgage | With Mortgage |
| Housing Units | 497 | 2,941 |
| Median Property Value | $454,900 | $429,700 |
| Median Household Income | $89,485 | $1,396 |
| Monthly Housing Costs | $837 | $729 |
| Real Estate Taxes | $4,673 | $27 |
Property Value by Mortgage Status in Rosaryville
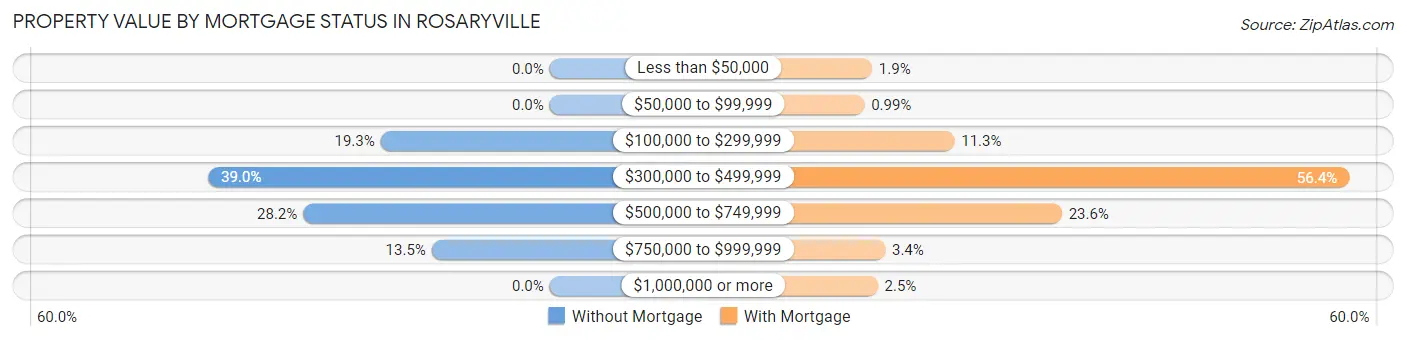
| Property Value | Without Mortgage | With Mortgage |
| Less than $50,000 | 0 (0.0%) | 55 (1.9%) |
| $50,000 to $99,999 | 0 (0.0%) | 29 (1.0%) |
| $100,000 to $299,999 | 96 (19.3%) | 332 (11.3%) |
| $300,000 to $499,999 | 194 (39.0%) | 1,659 (56.4%) |
| $500,000 to $749,999 | 140 (28.2%) | 693 (23.6%) |
| $750,000 to $999,999 | 67 (13.5%) | 99 (3.4%) |
| $1,000,000 or more | 0 (0.0%) | 74 (2.5%) |
| Total | 497 (100.0%) | 2,941 (100.0%) |
Household Income by Mortgage Status in Rosaryville
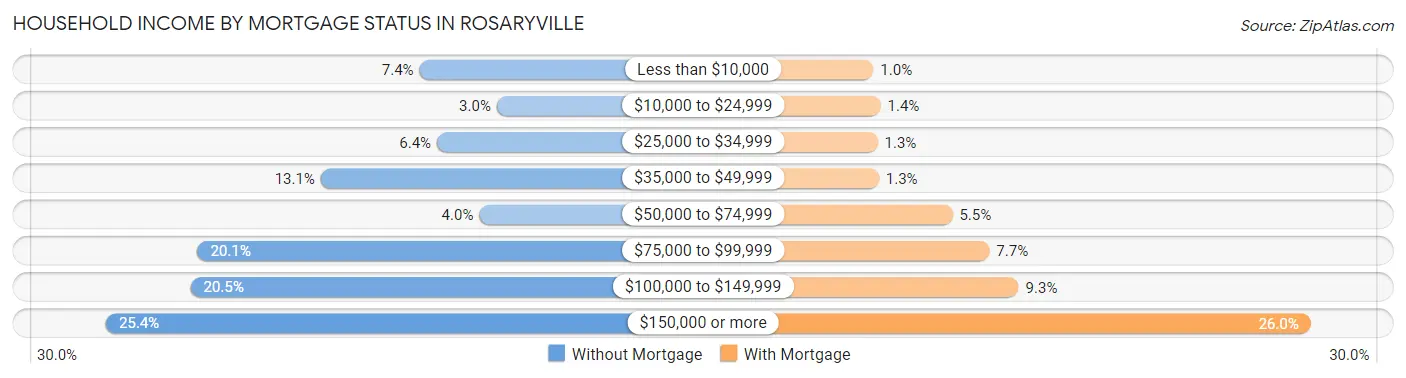
| Household Income | Without Mortgage | With Mortgage |
| Less than $10,000 | 37 (7.4%) | 30 (1.0%) |
| $10,000 to $24,999 | 15 (3.0%) | 42 (1.4%) |
| $25,000 to $34,999 | 32 (6.4%) | 37 (1.3%) |
| $35,000 to $49,999 | 65 (13.1%) | 39 (1.3%) |
| $50,000 to $74,999 | 20 (4.0%) | 163 (5.5%) |
| $75,000 to $99,999 | 100 (20.1%) | 225 (7.6%) |
| $100,000 to $149,999 | 102 (20.5%) | 274 (9.3%) |
| $150,000 or more | 126 (25.4%) | 765 (26.0%) |
| Total | 497 (100.0%) | 2,941 (100.0%) |
Property Value to Household Income Ratio in Rosaryville
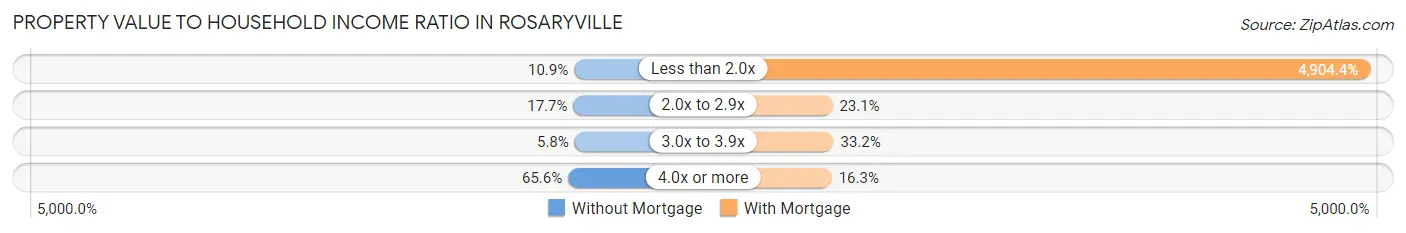
| Value-to-Income Ratio | Without Mortgage | With Mortgage |
| Less than 2.0x | 54 (10.9%) | 144,238 (4,904.4%) |
| 2.0x to 2.9x | 88 (17.7%) | 678 (23.1%) |
| 3.0x to 3.9x | 29 (5.8%) | 977 (33.2%) |
| 4.0x or more | 326 (65.6%) | 480 (16.3%) |
| Total | 497 (100.0%) | 2,941 (100.0%) |
Real Estate Taxes by Mortgage Status in Rosaryville
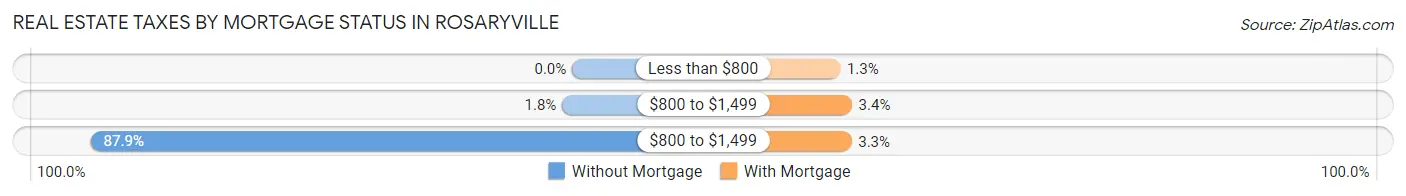
| Property Taxes | Without Mortgage | With Mortgage |
| Less than $800 | 0 (0.0%) | 37 (1.3%) |
| $800 to $1,499 | 9 (1.8%) | 100 (3.4%) |
| $800 to $1,499 | 437 (87.9%) | 98 (3.3%) |
| Total | 497 (100.0%) | 2,941 (100.0%) |
Health & Disability in Rosaryville
Health Insurance Coverage by Age in Rosaryville
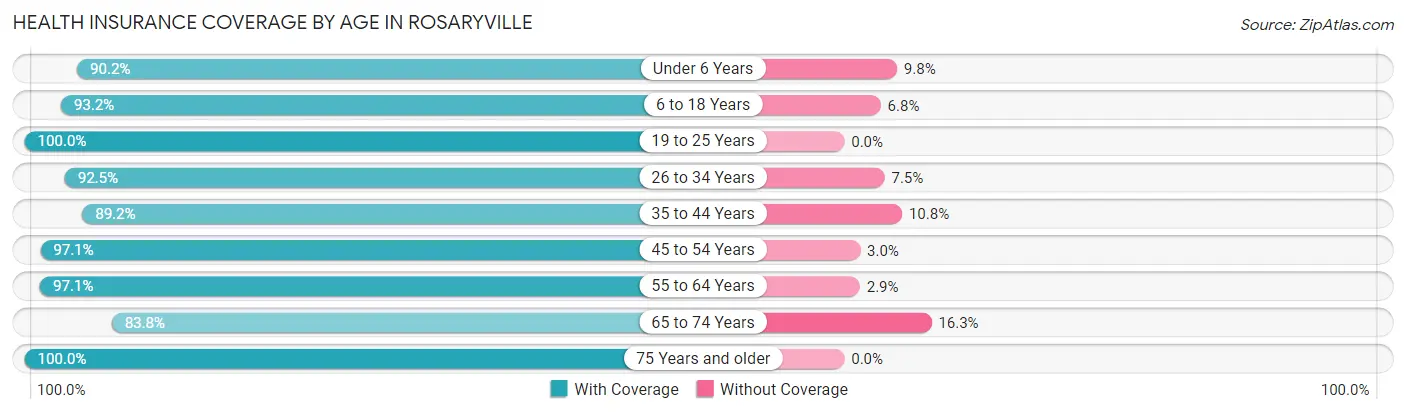
| Age Bracket | With Coverage | Without Coverage |
| Under 6 Years | 837 (90.2%) | 91 (9.8%) |
| 6 to 18 Years | 1,472 (93.2%) | 107 (6.8%) |
| 19 to 25 Years | 1,002 (100.0%) | 0 (0.0%) |
| 26 to 34 Years | 912 (92.5%) | 74 (7.5%) |
| 35 to 44 Years | 1,045 (89.2%) | 126 (10.8%) |
| 45 to 54 Years | 1,843 (97.1%) | 56 (2.9%) |
| 55 to 64 Years | 1,817 (97.1%) | 54 (2.9%) |
| 65 to 74 Years | 1,685 (83.8%) | 327 (16.3%) |
| 75 Years and older | 547 (100.0%) | 0 (0.0%) |
| Total | 11,160 (93.0%) | 835 (7.0%) |
Health Insurance Coverage by Citizenship Status in Rosaryville
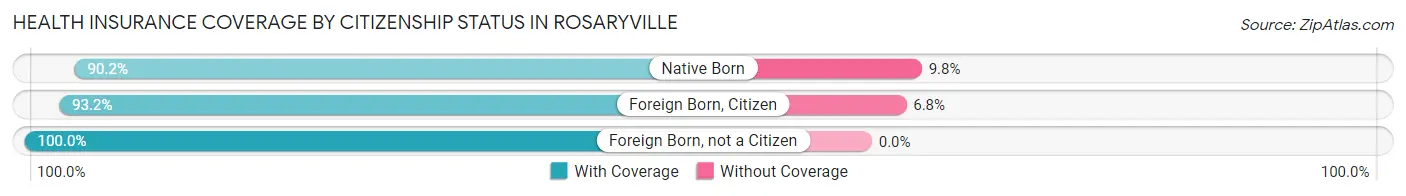
| Citizenship Status | With Coverage | Without Coverage |
| Native Born | 837 (90.2%) | 91 (9.8%) |
| Foreign Born, Citizen | 1,472 (93.2%) | 107 (6.8%) |
| Foreign Born, not a Citizen | 1,002 (100.0%) | 0 (0.0%) |
Health Insurance Coverage by Household Income in Rosaryville
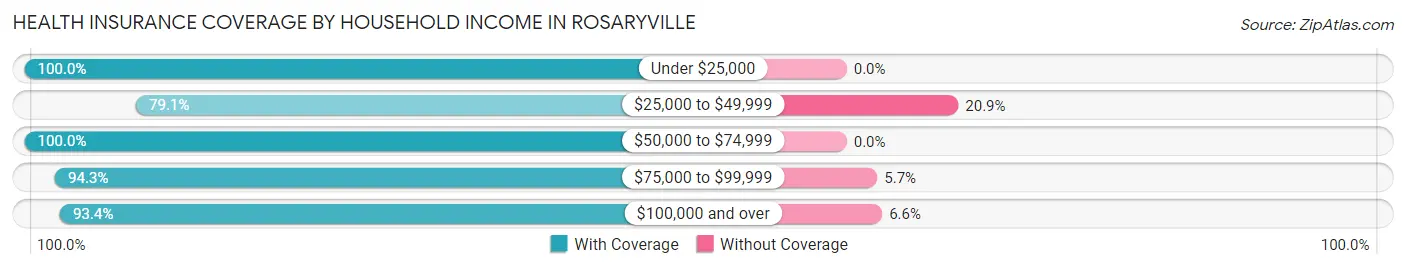
| Household Income | With Coverage | Without Coverage |
| Under $25,000 | 279 (100.0%) | 0 (0.0%) |
| $25,000 to $49,999 | 670 (79.1%) | 177 (20.9%) |
| $50,000 to $74,999 | 770 (100.0%) | 0 (0.0%) |
| $75,000 to $99,999 | 1,138 (94.3%) | 69 (5.7%) |
| $100,000 and over | 8,278 (93.4%) | 589 (6.6%) |
Public vs Private Health Insurance Coverage by Age in Rosaryville
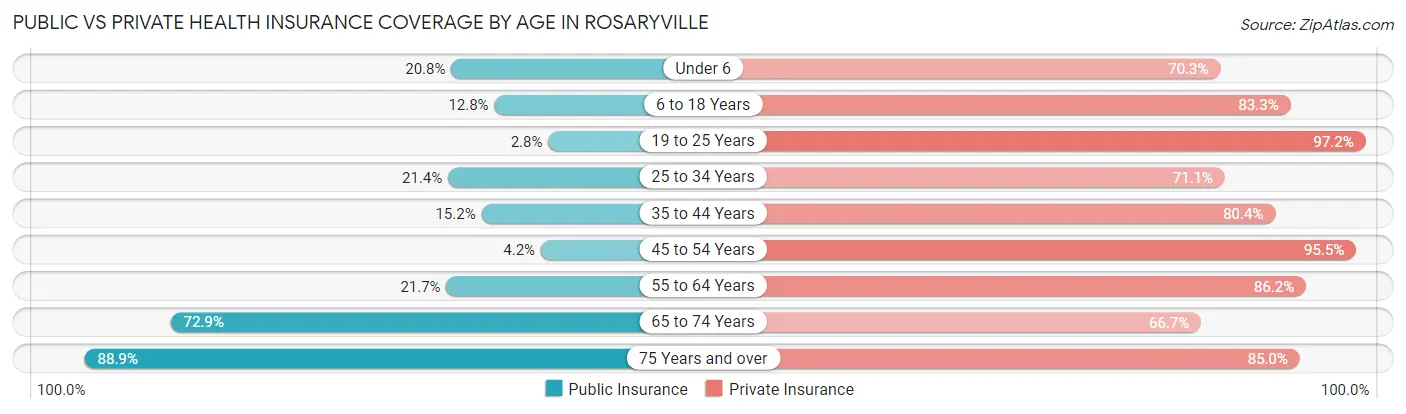
| Age Bracket | Public Insurance | Private Insurance |
| Under 6 | 193 (20.8%) | 652 (70.3%) |
| 6 to 18 Years | 202 (12.8%) | 1,315 (83.3%) |
| 19 to 25 Years | 28 (2.8%) | 974 (97.2%) |
| 25 to 34 Years | 211 (21.4%) | 701 (71.1%) |
| 35 to 44 Years | 178 (15.2%) | 942 (80.4%) |
| 45 to 54 Years | 79 (4.2%) | 1,813 (95.5%) |
| 55 to 64 Years | 406 (21.7%) | 1,612 (86.2%) |
| 65 to 74 Years | 1,467 (72.9%) | 1,342 (66.7%) |
| 75 Years and over | 486 (88.8%) | 465 (85.0%) |
| Total | 3,250 (27.1%) | 9,816 (81.8%) |
Disability Status by Sex by Age in Rosaryville
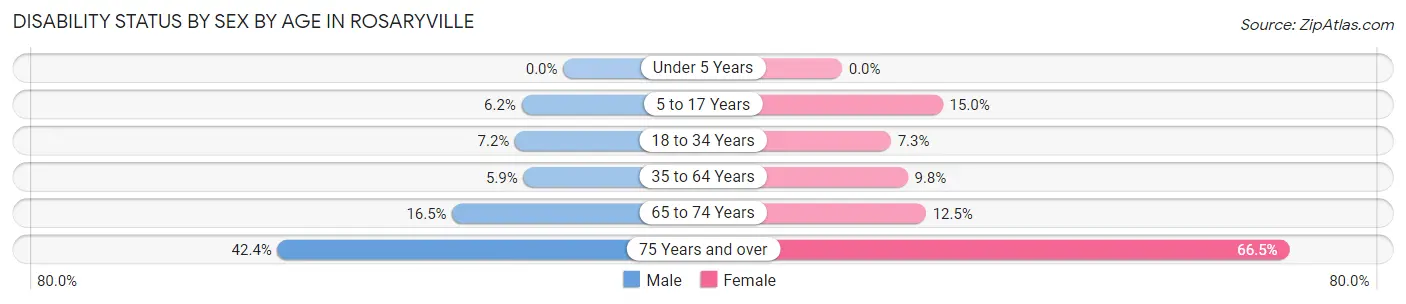
| Age Bracket | Male | Female |
| Under 5 Years | 0 (0.0%) | 0 (0.0%) |
| 5 to 17 Years | 44 (6.2%) | 112 (15.0%) |
| 18 to 34 Years | 92 (7.1%) | 67 (7.3%) |
| 35 to 64 Years | 128 (5.9%) | 271 (9.8%) |
| 65 to 74 Years | 141 (16.5%) | 144 (12.5%) |
| 75 Years and over | 98 (42.4%) | 210 (66.5%) |
Disability Class by Sex by Age in Rosaryville
Disability Class: Hearing Difficulty
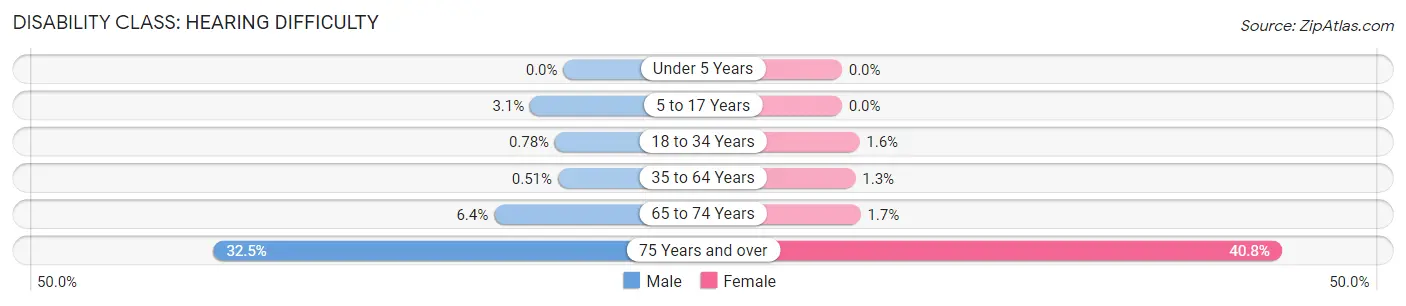
| Age Bracket | Male | Female |
| Under 5 Years | 0 (0.0%) | 0 (0.0%) |
| 5 to 17 Years | 22 (3.1%) | 0 (0.0%) |
| 18 to 34 Years | 10 (0.8%) | 15 (1.6%) |
| 35 to 64 Years | 11 (0.5%) | 35 (1.3%) |
| 65 to 74 Years | 55 (6.4%) | 20 (1.7%) |
| 75 Years and over | 75 (32.5%) | 129 (40.8%) |
Disability Class: Vision Difficulty
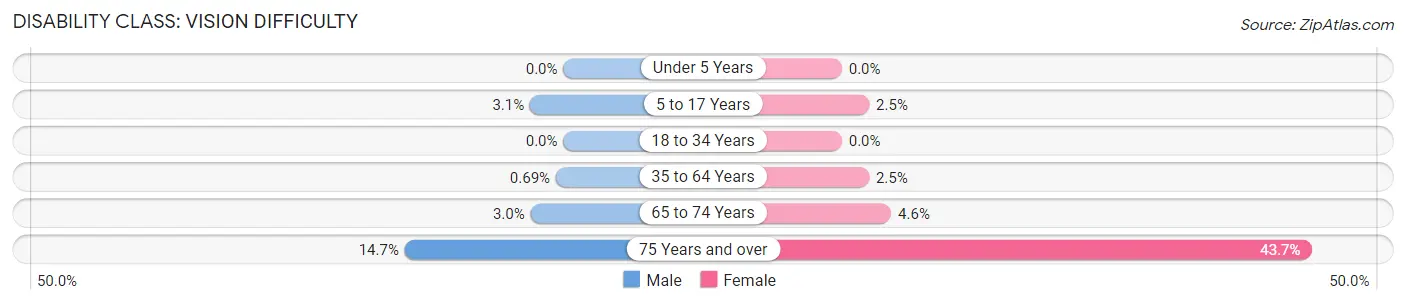
| Age Bracket | Male | Female |
| Under 5 Years | 0 (0.0%) | 0 (0.0%) |
| 5 to 17 Years | 22 (3.1%) | 19 (2.5%) |
| 18 to 34 Years | 0 (0.0%) | 0 (0.0%) |
| 35 to 64 Years | 15 (0.7%) | 70 (2.5%) |
| 65 to 74 Years | 26 (3.0%) | 53 (4.6%) |
| 75 Years and over | 34 (14.7%) | 138 (43.7%) |
Disability Class: Cognitive Difficulty
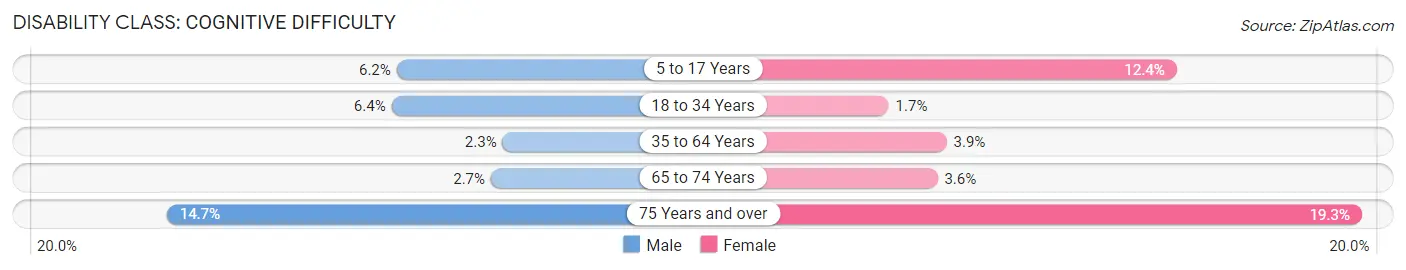
| Age Bracket | Male | Female |
| 5 to 17 Years | 44 (6.2%) | 93 (12.4%) |
| 18 to 34 Years | 82 (6.4%) | 16 (1.7%) |
| 35 to 64 Years | 49 (2.3%) | 108 (3.9%) |
| 65 to 74 Years | 23 (2.7%) | 41 (3.5%) |
| 75 Years and over | 34 (14.7%) | 61 (19.3%) |
Disability Class: Ambulatory Difficulty
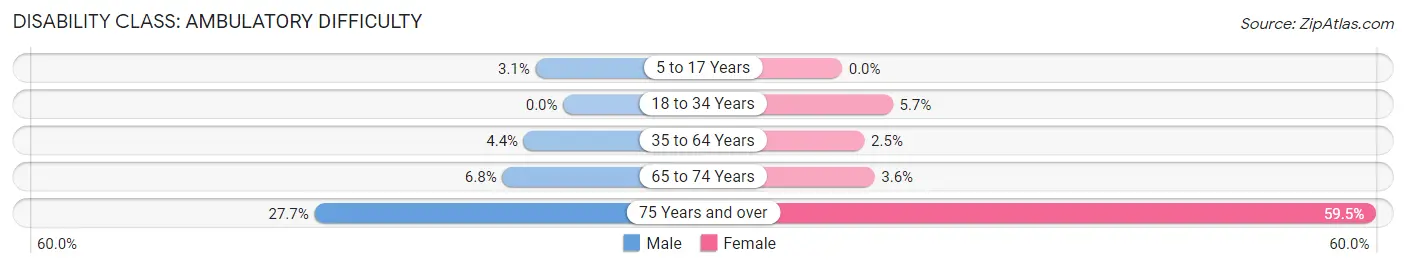
| Age Bracket | Male | Female |
| 5 to 17 Years | 22 (3.1%) | 0 (0.0%) |
| 18 to 34 Years | 0 (0.0%) | 52 (5.7%) |
| 35 to 64 Years | 95 (4.4%) | 69 (2.5%) |
| 65 to 74 Years | 58 (6.8%) | 42 (3.6%) |
| 75 Years and over | 64 (27.7%) | 188 (59.5%) |
Disability Class: Self-Care Difficulty
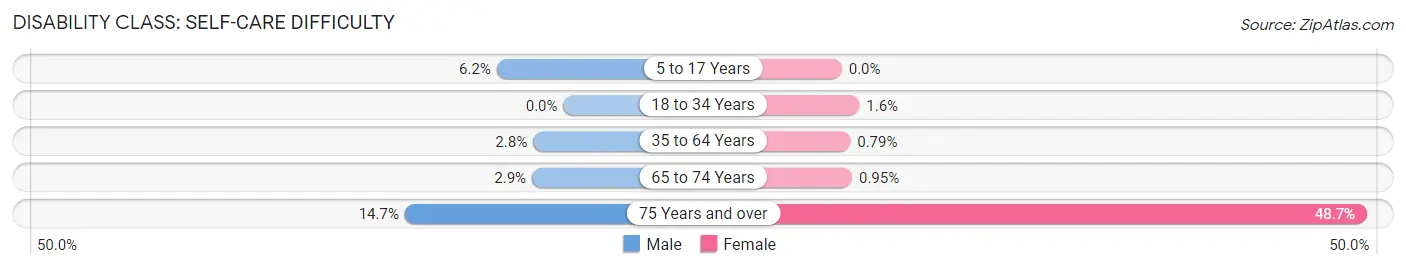
| Age Bracket | Male | Female |
| 5 to 17 Years | 44 (6.2%) | 0 (0.0%) |
| 18 to 34 Years | 0 (0.0%) | 15 (1.6%) |
| 35 to 64 Years | 61 (2.8%) | 22 (0.8%) |
| 65 to 74 Years | 25 (2.9%) | 11 (0.9%) |
| 75 Years and over | 34 (14.7%) | 154 (48.7%) |
Technology Access in Rosaryville
Computing Device Access in Rosaryville
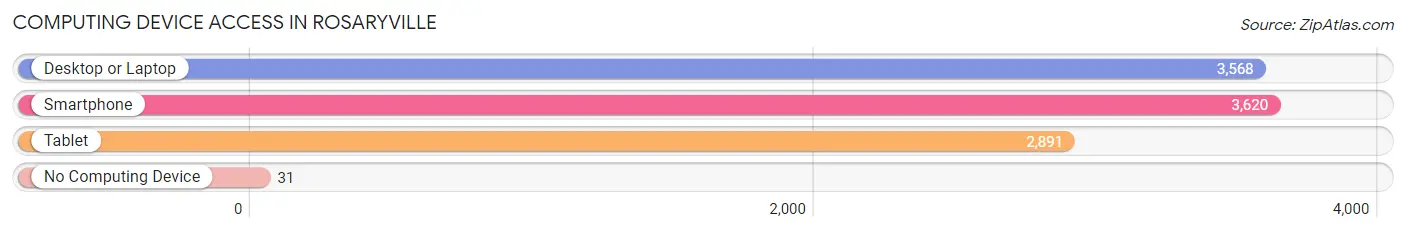
| Device Type | # Households | % Households |
| Desktop or Laptop | 3,568 | 94.7% |
| Smartphone | 3,620 | 96.1% |
| Tablet | 2,891 | 76.7% |
| No Computing Device | 31 | 0.8% |
| Total | 3,767 | 100.0% |
Internet Access in Rosaryville
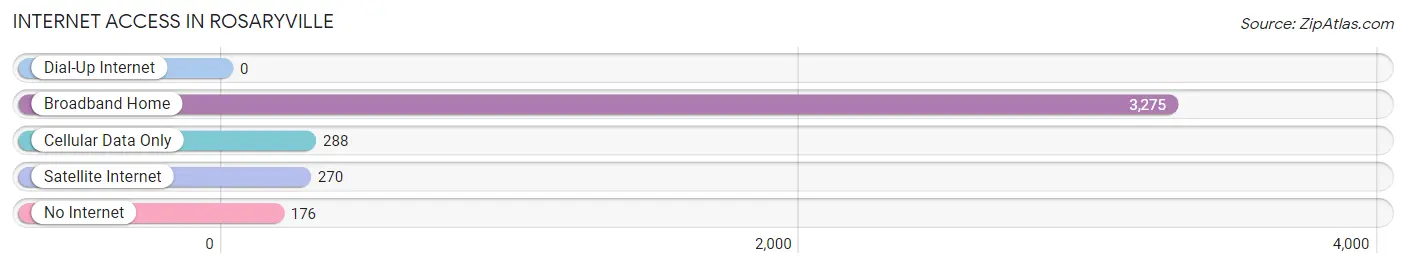
| Internet Type | # Households | % Households |
| Dial-Up Internet | 0 | 0.0% |
| Broadband Home | 3,275 | 86.9% |
| Cellular Data Only | 288 | 7.6% |
| Satellite Internet | 270 | 7.2% |
| No Internet | 176 | 4.7% |
| Total | 3,767 | 100.0% |
Rosaryville Summary
Rosaryville, Maryland is a small unincorporated community located in Prince George’s County, Maryland. It is situated in the southeastern corner of the county, just south of the Patuxent River and east of the town of Upper Marlboro. The community is home to a population of approximately 1,000 people, and is known for its rural atmosphere and close proximity to Washington, D.C.
History
The area that is now Rosaryville was first settled in the late 1600s by English colonists. The area was originally part of Charles County, and was known as “Rosaryville” after the local Catholic church, which was named after the rosary. The area was annexed by Prince George’s County in 1791.
In the early 1800s, the area was home to a large number of tobacco plantations, which were owned by wealthy landowners. The area was also home to a number of small farms, which were owned by free African Americans.
In the late 1800s, the area began to experience a period of growth and development. The area was home to a number of businesses, including a general store, a post office, and a blacksmith shop. The area also had a number of churches, including the Rosaryville Methodist Episcopal Church, which was founded in 1883.
In the early 1900s, the area began to experience a period of decline. The tobacco industry began to decline, and many of the area’s businesses closed. The area also experienced a period of population decline, as many of the area’s residents moved away in search of better economic opportunities.
Geography
Rosaryville is located in the southeastern corner of Prince George’s County, Maryland. It is situated just south of the Patuxent River and east of the town of Upper Marlboro. The area is characterized by rolling hills and wooded areas, and is home to a number of small streams and creeks.
The area is located approximately 25 miles from Washington, D.C., and is accessible via Interstate 95 and Maryland Route 4. The area is also served by a number of bus routes, which connect the area to Washington, D.C. and other nearby communities.
Economy
The economy of Rosaryville is largely based on agriculture and tourism. The area is home to a number of small farms, which produce a variety of crops, including corn, soybeans, and hay. The area is also home to a number of wineries, which produce a variety of wines.
The area is also home to a number of small businesses, including restaurants, shops, and other services. The area is also home to a number of bed and breakfasts, which cater to tourists who are visiting the area.
Demographics
As of the 2010 census, the population of Rosaryville was 1,000 people. The racial makeup of the area was 79.2% White, 15.2% African American, 0.2% Native American, 0.2% Asian, 0.2% Pacific Islander, and 4.2% from other races. The median household income in the area was $50,000, and the median age was 40 years.
Common Questions
What is the Total Population of Rosaryville?
Total Population of Rosaryville is 12,026.
What is the Total Male Population of Rosaryville?
Total Male Population of Rosaryville is 5,572.
What is the Total Female Population of Rosaryville?
Total Female Population of Rosaryville is 6,454.
What is the Ratio of Males per 100 Females in Rosaryville?
There are 86.33 Males per 100 Females in Rosaryville.
What is the Ratio of Females per 100 Males in Rosaryville?
There are 115.83 Females per 100 Males in Rosaryville.
What is the Median Population Age in Rosaryville?
Median Population Age in Rosaryville is 47.8 Years.
What is the Average Family Size in Rosaryville
Average Family Size in Rosaryville is 3.6 People.
What is the Average Household Size in Rosaryville
Average Household Size in Rosaryville is 3.2 People.
What is Per Capita Income in Rosaryville?
Per Capita income in Rosaryville is $53,205.
What is the Median Family Income in Rosaryville?
Median Family Income in Rosaryville is $144,779.
What is the Median Household income in Rosaryville?
Median Household Income in Rosaryville is $135,733.
What is Income or Wage Gap in Rosaryville?
Income or Wage Gap in Rosaryville is 17.3%.
Women in Rosaryville earn 82.7 cents for every dollar earned by a man.
What is Family Income Deficit in Rosaryville?
Family Income Deficit in Rosaryville is $8,961.
Families that are below poverty line in Rosaryville earn $8,961 less on average than the poverty threshold level.
What is Inequality or Gini Index in Rosaryville?
Inequality or Gini Index in Rosaryville is 0.37.
How Large is the Labor Force in Rosaryville?
There are 6,552 People in the Labor Forcein in Rosaryville.
What is the Percentage of People in the Labor Force in Rosaryville?
65.8% of People are in the Labor Force in Rosaryville.
What is the Unemployment Rate in Rosaryville?
Unemployment Rate in Rosaryville is 7.3%.