Cities with the Most Immigrants from Caribbean in Arizona
RELATED REPORTS & OPTIONS
Caribbean
Arizona
Compare Cities
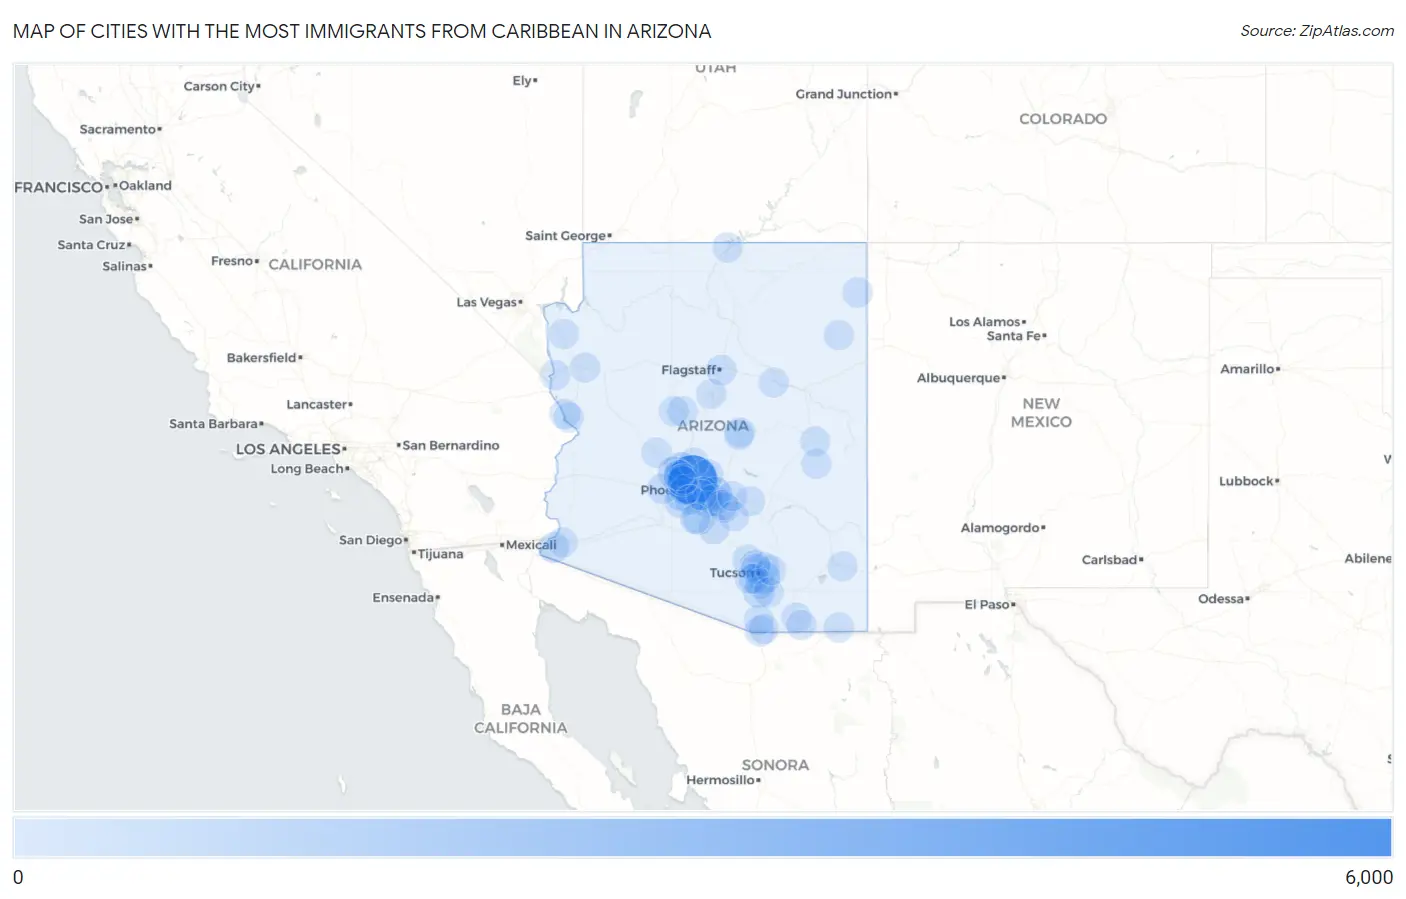
Map of Cities with the Most Immigrants from Caribbean in Arizona
0
6,000
Cities with the Most Immigrants from Caribbean in Arizona
| City | Caribbean | vs State | vs National | |
| 1. | Phoenix | 5,938 | 17,909(33.16%)#1 | 4,544,093(0.13%)#107 |
| 2. | Glendale | 2,127 | 17,909(11.88%)#2 | 4,544,093(0.05%)#245 |
| 3. | Mesa | 1,100 | 17,909(6.14%)#3 | 4,544,093(0.02%)#397 |
| 4. | Tempe | 957 | 17,909(5.34%)#4 | 4,544,093(0.02%)#432 |
| 5. | Peoria | 874 | 17,909(4.88%)#5 | 4,544,093(0.02%)#462 |
| 6. | Tucson | 714 | 17,909(3.99%)#6 | 4,544,093(0.02%)#535 |
| 7. | Chandler | 482 | 17,909(2.69%)#7 | 4,544,093(0.01%)#687 |
| 8. | Surprise | 478 | 17,909(2.67%)#8 | 4,544,093(0.01%)#691 |
| 9. | Maricopa | 432 | 17,909(2.41%)#9 | 4,544,093(0.01%)#750 |
| 10. | Scottsdale | 378 | 17,909(2.11%)#10 | 4,544,093(0.01%)#830 |
| 11. | Gilbert | 364 | 17,909(2.03%)#11 | 4,544,093(0.01%)#853 |
| 12. | Avondale | 359 | 17,909(2.00%)#12 | 4,544,093(0.01%)#868 |
| 13. | Catalina Foothills | 342 | 17,909(1.91%)#13 | 4,544,093(0.01%)#904 |
| 14. | Sahuarita | 319 | 17,909(1.78%)#14 | 4,544,093(0.01%)#956 |
| 15. | Casa Grande | 225 | 17,909(1.26%)#15 | 4,544,093(0.00%)#1,230 |
| 16. | Goodyear | 189 | 17,909(1.06%)#16 | 4,544,093(0.00%)#1,389 |
| 17. | Yuma | 166 | 17,909(0.93%)#17 | 4,544,093(0.00%)#1,521 |
| 18. | Buckeye | 160 | 17,909(0.89%)#18 | 4,544,093(0.00%)#1,558 |
| 19. | Marana | 129 | 17,909(0.72%)#19 | 4,544,093(0.00%)#1,779 |
| 20. | Casas Adobes | 122 | 17,909(0.68%)#20 | 4,544,093(0.00%)#1,841 |
| 21. | El Mirage | 97 | 17,909(0.54%)#21 | 4,544,093(0.00%)#2,121 |
| 22. | San Tan Valley | 96 | 17,909(0.54%)#22 | 4,544,093(0.00%)#2,139 |
| 23. | Guadalupe | 92 | 17,909(0.51%)#23 | 4,544,093(0.00%)#2,208 |
| 24. | Flagstaff | 87 | 17,909(0.49%)#24 | 4,544,093(0.00%)#2,269 |
| 25. | Bullhead City | 75 | 17,909(0.42%)#25 | 4,544,093(0.00%)#2,462 |
| 26. | Queen Creek | 66 | 17,909(0.37%)#26 | 4,544,093(0.00%)#2,618 |
| 27. | Valencia West | 64 | 17,909(0.36%)#27 | 4,544,093(0.00%)#2,656 |
| 28. | Nogales | 59 | 17,909(0.33%)#28 | 4,544,093(0.00%)#2,771 |
| 29. | Tolleson | 55 | 17,909(0.31%)#29 | 4,544,093(0.00%)#2,872 |
| 30. | Desert Hills | 52 | 17,909(0.29%)#30 | 4,544,093(0.00%)#2,957 |
| 31. | Tsaile | 52 | 17,909(0.29%)#31 | 4,544,093(0.00%)#2,959 |
| 32. | Prescott Valley | 51 | 17,909(0.28%)#32 | 4,544,093(0.00%)#2,965 |
| 33. | Lake Havasu City | 48 | 17,909(0.27%)#33 | 4,544,093(0.00%)#3,041 |
| 34. | Douglas | 48 | 17,909(0.27%)#34 | 4,544,093(0.00%)#3,045 |
| 35. | Sierra Vista | 42 | 17,909(0.23%)#35 | 4,544,093(0.00%)#3,229 |
| 36. | Flowing Wells | 41 | 17,909(0.23%)#36 | 4,544,093(0.00%)#3,274 |
| 37. | Sierra Vista Southeast | 41 | 17,909(0.23%)#37 | 4,544,093(0.00%)#3,276 |
| 38. | Prescott | 38 | 17,909(0.21%)#38 | 4,544,093(0.00%)#3,352 |
| 39. | Anthem | 31 | 17,909(0.17%)#39 | 4,544,093(0.00%)#3,647 |
| 40. | Fortuna Foothills | 28 | 17,909(0.16%)#40 | 4,544,093(0.00%)#3,772 |
| 41. | Youngtown | 28 | 17,909(0.16%)#41 | 4,544,093(0.00%)#3,799 |
| 42. | White Hills | 25 | 17,909(0.14%)#42 | 4,544,093(0.00%)#3,978 |
| 43. | Kingman | 21 | 17,909(0.12%)#43 | 4,544,093(0.00%)#4,148 |
| 44. | Sun City | 20 | 17,909(0.11%)#44 | 4,544,093(0.00%)#4,216 |
| 45. | Page | 19 | 17,909(0.11%)#45 | 4,544,093(0.00%)#4,304 |
| 46. | Summit | 19 | 17,909(0.11%)#46 | 4,544,093(0.00%)#4,312 |
| 47. | Sun City West | 18 | 17,909(0.10%)#47 | 4,544,093(0.00%)#4,362 |
| 48. | Payson | 17 | 17,909(0.09%)#48 | 4,544,093(0.00%)#4,439 |
| 49. | Wickenburg | 17 | 17,909(0.09%)#49 | 4,544,093(0.00%)#4,459 |
| 50. | Rio Rico | 15 | 17,909(0.08%)#50 | 4,544,093(0.00%)#4,581 |
| 51. | Superior | 15 | 17,909(0.08%)#51 | 4,544,093(0.00%)#4,634 |
| 52. | Florence | 12 | 17,909(0.07%)#52 | 4,544,093(0.00%)#4,843 |
| 53. | Sedona | 11 | 17,909(0.06%)#53 | 4,544,093(0.00%)#4,957 |
| 54. | Tucson Mountains | 10 | 17,909(0.06%)#54 | 4,544,093(0.00%)#5,069 |
| 55. | Drexel Heights | 9 | 17,909(0.05%)#55 | 4,544,093(0.00%)#5,178 |
| 56. | Beyerville | 9 | 17,909(0.05%)#56 | 4,544,093(0.00%)#5,305 |
| 57. | Corona De Tucson | 8 | 17,909(0.04%)#57 | 4,544,093(0.00%)#5,337 |
| 58. | Tanque Verde | 7 | 17,909(0.04%)#58 | 4,544,093(0.00%)#5,439 |
| 59. | Pinetop Lakeside | 7 | 17,909(0.04%)#59 | 4,544,093(0.00%)#5,486 |
| 60. | Gold Canyon | 6 | 17,909(0.03%)#60 | 4,544,093(0.00%)#5,598 |
| 61. | Mesa Del Caballo | 6 | 17,909(0.03%)#61 | 4,544,093(0.00%)#5,684 |
| 62. | Komatke | 5 | 17,909(0.03%)#62 | 4,544,093(0.00%)#5,825 |
| 63. | Winslow | 4 | 17,909(0.02%)#63 | 4,544,093(0.00%)#5,883 |
| 64. | Ak Chin Village | 4 | 17,909(0.02%)#64 | 4,544,093(0.00%)#5,951 |
| 65. | Whiteriver | 3 | 17,909(0.02%)#65 | 4,544,093(0.00%)#6,024 |
| 66. | Ganado | 2 | 17,909(0.01%)#66 | 4,544,093(0.00%)#6,253 |
| 67. | Bowie | 2 | 17,909(0.01%)#67 | 4,544,093(0.00%)#6,281 |
Common Questions
What are the Top 10 Cities with the Most Immigrants from Caribbean in Arizona?
Top 10 Cities with the Most Immigrants from Caribbean in Arizona are:
What city has the Most Immigrants from Caribbean in Arizona?
Phoenix has the Most Immigrants from Caribbean in Arizona with 5,938.
What is the Total Immigrants from Caribbean in the State of Arizona?
Total Immigrants from Caribbean in Arizona is 17,909.
What is the Total Immigrants from Caribbean in the United States?
Total Immigrants from Caribbean in the United States is 4,544,093.