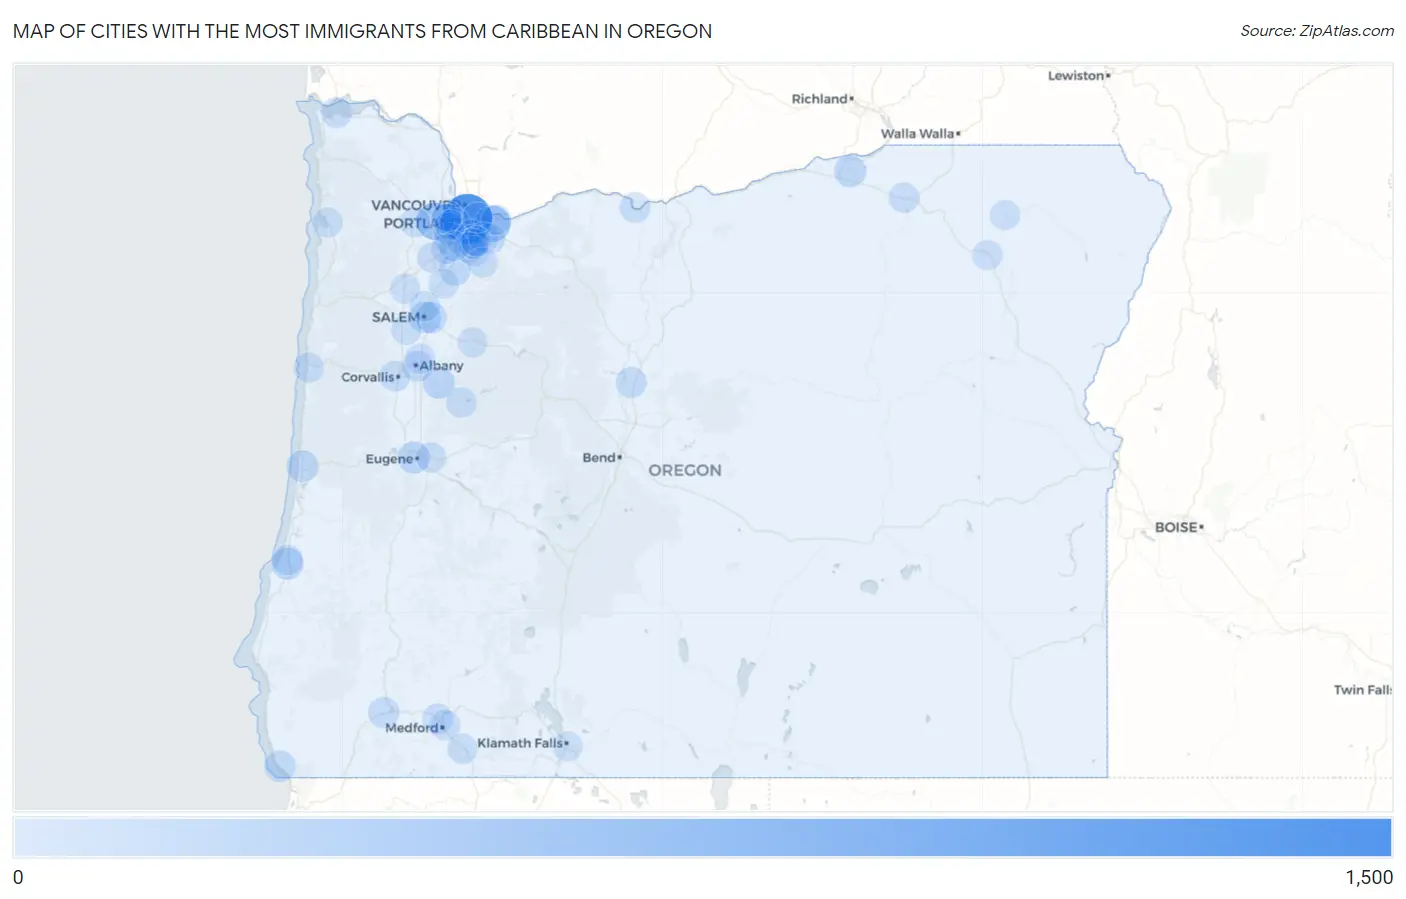
Cities with the Most Immigrants from Caribbean in Oregon
RELATED REPORTS & OPTIONS
Caribbean
Oregon
Compare Cities
Map of Cities with the Most Immigrants from Caribbean in Oregon
0
1,500
Cities with the Most Immigrants from Caribbean in Oregon
| City | Caribbean | vs State | vs National | |
| 1. | Portland | 1,302 | 5,058(25.74%)#1 | 4,544,093(0.03%)#343 |
| 2. | Hillsboro | 470 | 5,058(9.29%)#2 | 4,544,093(0.01%)#697 |
| 3. | Gresham | 392 | 5,058(7.75%)#3 | 4,544,093(0.01%)#809 |
| 4. | Lebanon | 137 | 5,058(2.71%)#4 | 4,544,093(0.00%)#1,703 |
| 5. | Beaverton | 133 | 5,058(2.63%)#5 | 4,544,093(0.00%)#1,739 |
| 6. | Eugene | 126 | 5,058(2.49%)#6 | 4,544,093(0.00%)#1,800 |
| 7. | Hermiston | 119 | 5,058(2.35%)#7 | 4,544,093(0.00%)#1,871 |
| 8. | Tigard | 118 | 5,058(2.33%)#8 | 4,544,093(0.00%)#1,873 |
| 9. | Coos Bay | 110 | 5,058(2.17%)#9 | 4,544,093(0.00%)#1,972 |
| 10. | Salem | 108 | 5,058(2.14%)#10 | 4,544,093(0.00%)#1,987 |
| 11. | Florence | 99 | 5,058(1.96%)#11 | 4,544,093(0.00%)#2,099 |
| 12. | Brookings | 91 | 5,058(1.80%)#12 | 4,544,093(0.00%)#2,222 |
| 13. | Lake Oswego | 88 | 5,058(1.74%)#13 | 4,544,093(0.00%)#2,255 |
| 14. | West Haven Sylvan | 85 | 5,058(1.68%)#14 | 4,544,093(0.00%)#2,304 |
| 15. | Four Corners | 80 | 5,058(1.58%)#15 | 4,544,093(0.00%)#2,372 |
| 16. | Aurora | 76 | 5,058(1.50%)#16 | 4,544,093(0.00%)#2,455 |
| 17. | Redwood | 65 | 5,058(1.29%)#17 | 4,544,093(0.00%)#2,643 |
| 18. | Oatfield | 61 | 5,058(1.21%)#18 | 4,544,093(0.00%)#2,727 |
| 19. | Culver | 59 | 5,058(1.17%)#19 | 4,544,093(0.00%)#2,785 |
| 20. | Albany | 54 | 5,058(1.07%)#20 | 4,544,093(0.00%)#2,886 |
| 21. | Astoria | 49 | 5,058(0.97%)#21 | 4,544,093(0.00%)#3,022 |
| 22. | Bethany | 47 | 5,058(0.93%)#22 | 4,544,093(0.00%)#3,071 |
| 23. | The Dalles | 44 | 5,058(0.87%)#23 | 4,544,093(0.00%)#3,169 |
| 24. | Corvallis | 37 | 5,058(0.73%)#24 | 4,544,093(0.00%)#3,390 |
| 25. | Milwaukie | 32 | 5,058(0.63%)#25 | 4,544,093(0.00%)#3,600 |
| 26. | Central Point | 30 | 5,058(0.59%)#26 | 4,544,093(0.00%)#3,686 |
| 27. | Jennings Lodge | 29 | 5,058(0.57%)#27 | 4,544,093(0.00%)#3,738 |
| 28. | Bayshore | 28 | 5,058(0.55%)#28 | 4,544,093(0.00%)#3,816 |
| 29. | Damascus | 27 | 5,058(0.53%)#29 | 4,544,093(0.00%)#3,835 |
| 30. | Medford | 26 | 5,058(0.51%)#30 | 4,544,093(0.00%)#3,858 |
| 31. | North Bend | 26 | 5,058(0.51%)#31 | 4,544,093(0.00%)#3,881 |
| 32. | Marlene | 26 | 5,058(0.51%)#32 | 4,544,093(0.00%)#3,897 |
| 33. | Sweet Home | 25 | 5,058(0.49%)#33 | 4,544,093(0.00%)#3,943 |
| 34. | Newberg | 24 | 5,058(0.47%)#34 | 4,544,093(0.00%)#3,989 |
| 35. | West Linn | 23 | 5,058(0.45%)#35 | 4,544,093(0.00%)#4,043 |
| 36. | Oregon City | 16 | 5,058(0.32%)#36 | 4,544,093(0.00%)#4,495 |
| 37. | Cedar Hills | 16 | 5,058(0.32%)#37 | 4,544,093(0.00%)#4,518 |
| 38. | Happy Valley | 15 | 5,058(0.30%)#38 | 4,544,093(0.00%)#4,578 |
| 39. | Tualatin | 14 | 5,058(0.28%)#39 | 4,544,093(0.00%)#4,664 |
| 40. | Ashland | 14 | 5,058(0.28%)#40 | 4,544,093(0.00%)#4,667 |
| 41. | Sherwood | 14 | 5,058(0.28%)#41 | 4,544,093(0.00%)#4,669 |
| 42. | Pendleton | 14 | 5,058(0.28%)#42 | 4,544,093(0.00%)#4,671 |
| 43. | Troutdale | 14 | 5,058(0.28%)#43 | 4,544,093(0.00%)#4,673 |
| 44. | Gladstone | 14 | 5,058(0.28%)#44 | 4,544,093(0.00%)#4,676 |
| 45. | Millersburg | 13 | 5,058(0.26%)#45 | 4,544,093(0.00%)#4,795 |
| 46. | Newport | 11 | 5,058(0.22%)#46 | 4,544,093(0.00%)#4,956 |
| 47. | Keizer | 10 | 5,058(0.20%)#47 | 4,544,093(0.00%)#5,047 |
| 48. | Springfield | 9 | 5,058(0.18%)#48 | 4,544,093(0.00%)#5,171 |
| 49. | La Grande | 9 | 5,058(0.18%)#49 | 4,544,093(0.00%)#5,201 |
| 50. | Beavercreek | 9 | 5,058(0.18%)#50 | 4,544,093(0.00%)#5,242 |
| 51. | Woodburn | 8 | 5,058(0.16%)#51 | 4,544,093(0.00%)#5,311 |
| 52. | Forest Grove | 8 | 5,058(0.16%)#52 | 4,544,093(0.00%)#5,312 |
| 53. | Bay City | 8 | 5,058(0.16%)#53 | 4,544,093(0.00%)#5,383 |
| 54. | Maywood Park | 8 | 5,058(0.16%)#54 | 4,544,093(0.00%)#5,402 |
| 55. | Independence | 6 | 5,058(0.12%)#55 | 4,544,093(0.00%)#5,601 |
| 56. | Johnson City | 5 | 5,058(0.10%)#56 | 4,544,093(0.00%)#5,847 |
| 57. | Klamath Falls | 4 | 5,058(0.08%)#57 | 4,544,093(0.00%)#5,865 |
| 58. | Amity | 4 | 5,058(0.08%)#58 | 4,544,093(0.00%)#5,926 |
| 59. | Oak Hills | 3 | 5,058(0.06%)#59 | 4,544,093(0.00%)#6,003 |
| 60. | Elgin | 2 | 5,058(0.04%)#60 | 4,544,093(0.00%)#6,210 |
| 61. | Lyons | 1 | 5,058(0.02%)#61 | 4,544,093(0.00%)#6,401 |
Common Questions
What are the Top 10 Cities with the Most Immigrants from Caribbean in Oregon?
Top 10 Cities with the Most Immigrants from Caribbean in Oregon are:
What city has the Most Immigrants from Caribbean in Oregon?
Portland has the Most Immigrants from Caribbean in Oregon with 1,302.
What is the Total Immigrants from Caribbean in the State of Oregon?
Total Immigrants from Caribbean in Oregon is 5,058.
What is the Total Immigrants from Caribbean in the United States?
Total Immigrants from Caribbean in the United States is 4,544,093.