Cities with the Most Immigrants from Caribbean in Iowa
RELATED REPORTS & OPTIONS
Caribbean
Iowa
Compare Cities
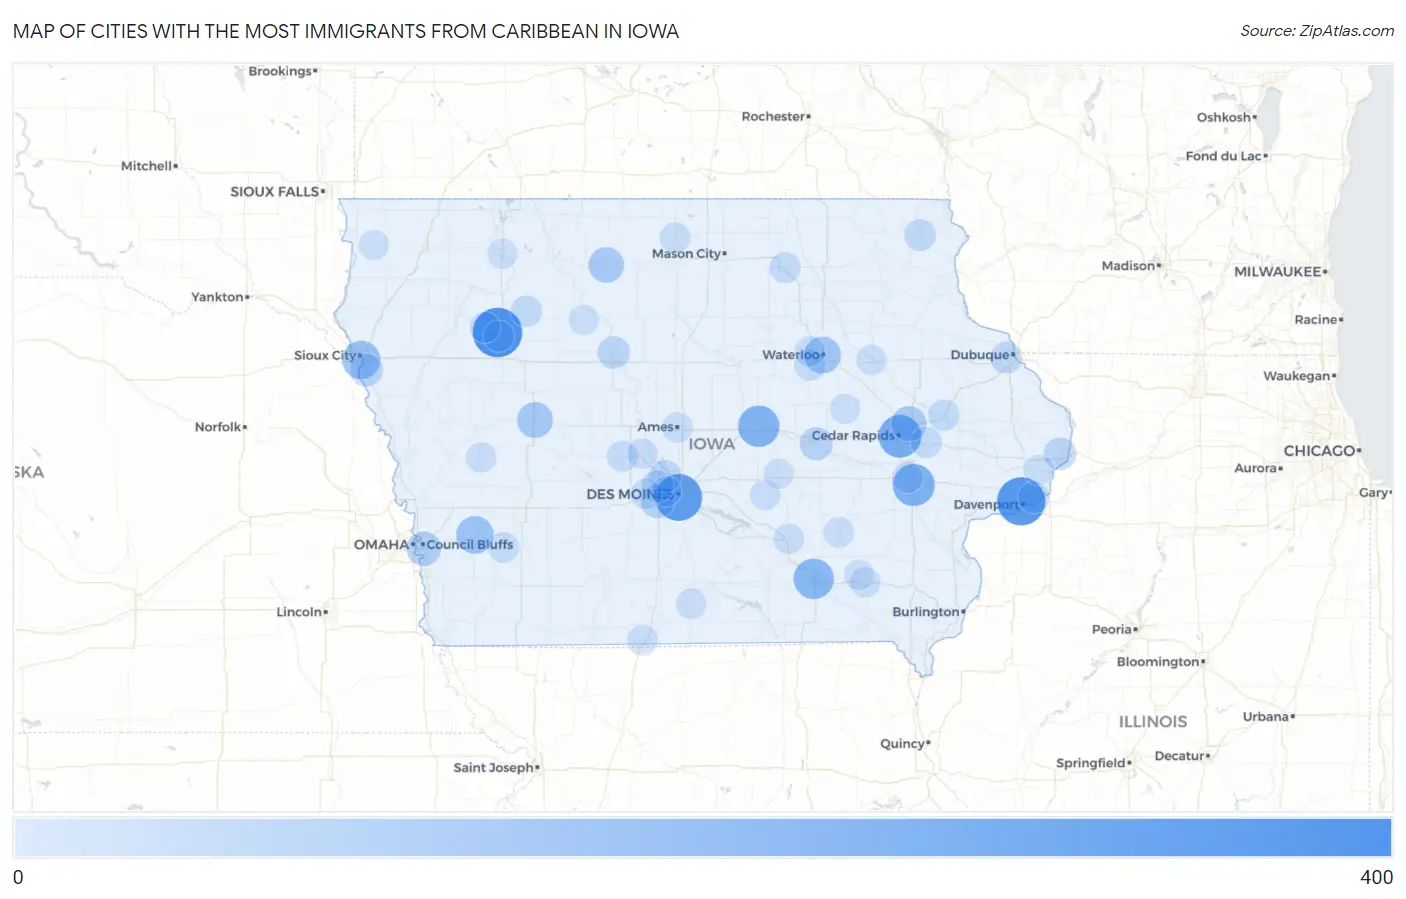
Map of Cities with the Most Immigrants from Caribbean in Iowa
0
400
Cities with the Most Immigrants from Caribbean in Iowa
| City | Caribbean | vs State | vs National | |
| 1. | Storm Lake | 331 | 3,270(10.12%)#1 | 4,544,093(0.01%)#928 |
| 2. | Davenport | 306 | 3,270(9.36%)#2 | 4,544,093(0.01%)#989 |
| 3. | Des Moines | 284 | 3,270(8.69%)#3 | 4,544,093(0.01%)#1,033 |
| 4. | Cedar Rapids | 213 | 3,270(6.51%)#4 | 4,544,093(0.00%)#1,271 |
| 5. | Iowa City | 200 | 3,270(6.12%)#5 | 4,544,093(0.00%)#1,335 |
| 6. | Marshalltown | 189 | 3,270(5.78%)#6 | 4,544,093(0.00%)#1,391 |
| 7. | Ottumwa | 170 | 3,270(5.20%)#7 | 4,544,093(0.00%)#1,495 |
| 8. | Sioux City | 134 | 3,270(4.10%)#8 | 4,544,093(0.00%)#1,734 |
| 9. | Oakland | 124 | 3,270(3.79%)#9 | 4,544,093(0.00%)#1,828 |
| 10. | Waterloo | 111 | 3,270(3.39%)#10 | 4,544,093(0.00%)#1,950 |
| 11. | Carroll | 94 | 3,270(2.87%)#11 | 4,544,093(0.00%)#2,178 |
| 12. | Algona | 89 | 3,270(2.72%)#12 | 4,544,093(0.00%)#2,250 |
| 13. | Marion | 83 | 3,270(2.54%)#13 | 4,544,093(0.00%)#2,329 |
| 14. | Council Bluffs | 69 | 3,270(2.11%)#14 | 4,544,093(0.00%)#2,558 |
| 15. | West Des Moines | 56 | 3,270(1.71%)#15 | 4,544,093(0.00%)#2,835 |
| 16. | Kent Estates | 52 | 3,270(1.59%)#16 | 4,544,093(0.00%)#2,958 |
| 17. | Chelsea | 48 | 3,270(1.47%)#17 | 4,544,093(0.00%)#3,067 |
| 18. | Sergeant Bluff | 45 | 3,270(1.38%)#18 | 4,544,093(0.00%)#3,150 |
| 19. | Clinton | 40 | 3,270(1.22%)#19 | 4,544,093(0.00%)#3,301 |
| 20. | Fort Dodge | 39 | 3,270(1.19%)#20 | 4,544,093(0.00%)#3,324 |
| 21. | Johnston | 38 | 3,270(1.16%)#21 | 4,544,093(0.00%)#3,358 |
| 22. | Urbandale | 33 | 3,270(1.01%)#22 | 4,544,093(0.00%)#3,546 |
| 23. | Dubuque | 28 | 3,270(0.86%)#23 | 4,544,093(0.00%)#3,765 |
| 24. | Waukon | 26 | 3,270(0.80%)#24 | 4,544,093(0.00%)#3,903 |
| 25. | Albert City | 24 | 3,270(0.73%)#25 | 4,544,093(0.00%)#4,034 |
| 26. | Bettendorf | 23 | 3,270(0.70%)#26 | 4,544,093(0.00%)#4,040 |
| 27. | Anamosa | 20 | 3,270(0.61%)#27 | 4,544,093(0.00%)#4,250 |
| 28. | Hudson | 20 | 3,270(0.61%)#28 | 4,544,093(0.00%)#4,261 |
| 29. | Charles City | 17 | 3,270(0.52%)#29 | 4,544,093(0.00%)#4,461 |
| 30. | Coralville | 16 | 3,270(0.49%)#30 | 4,544,093(0.00%)#4,499 |
| 31. | Mount Vernon | 15 | 3,270(0.46%)#31 | 4,544,093(0.00%)#4,614 |
| 32. | Perry | 14 | 3,270(0.43%)#32 | 4,544,093(0.00%)#4,687 |
| 33. | Griswold | 13 | 3,270(0.40%)#33 | 4,544,093(0.00%)#4,822 |
| 34. | Lakeside | 13 | 3,270(0.40%)#34 | 4,544,093(0.00%)#4,831 |
| 35. | Waukee | 11 | 3,270(0.34%)#35 | 4,544,093(0.00%)#4,936 |
| 36. | Forest City | 10 | 3,270(0.31%)#36 | 4,544,093(0.00%)#5,098 |
| 37. | Alta | 9 | 3,270(0.28%)#37 | 4,544,093(0.00%)#5,262 |
| 38. | Lamoni | 8 | 3,270(0.24%)#38 | 4,544,093(0.00%)#5,381 |
| 39. | Sigourney | 8 | 3,270(0.24%)#39 | 4,544,093(0.00%)#5,392 |
| 40. | Woodward | 7 | 3,270(0.21%)#40 | 4,544,093(0.00%)#5,557 |
| 41. | Ames | 6 | 3,270(0.18%)#41 | 4,544,093(0.00%)#5,577 |
| 42. | Fairfield | 6 | 3,270(0.18%)#42 | 4,544,093(0.00%)#5,606 |
| 43. | Humeston | 5 | 3,270(0.15%)#43 | 4,544,093(0.00%)#5,842 |
| 44. | Cedar Falls | 4 | 3,270(0.12%)#44 | 4,544,093(0.00%)#5,859 |
| 45. | Oskaloosa | 4 | 3,270(0.12%)#45 | 4,544,093(0.00%)#5,873 |
| 46. | Sully | 3 | 3,270(0.09%)#46 | 4,544,093(0.00%)#6,096 |
| 47. | Defiance | 3 | 3,270(0.09%)#47 | 4,544,093(0.00%)#6,149 |
| 48. | Spencer | 2 | 3,270(0.06%)#48 | 4,544,093(0.00%)#6,157 |
| 49. | Gilmore City | 2 | 3,270(0.06%)#49 | 4,544,093(0.00%)#6,261 |
| 50. | Mccausland | 2 | 3,270(0.06%)#50 | 4,544,093(0.00%)#6,292 |
| 51. | Grinnell | 1 | 3,270(0.03%)#51 | 4,544,093(0.00%)#6,330 |
| 52. | Independence | 1 | 3,270(0.03%)#52 | 4,544,093(0.00%)#6,343 |
| 53. | Windsor Heights | 1 | 3,270(0.03%)#53 | 4,544,093(0.00%)#6,348 |
| 54. | Rock Valley | 1 | 3,270(0.03%)#54 | 4,544,093(0.00%)#6,359 |
| 55. | Garrison | 1 | 3,270(0.03%)#55 | 4,544,093(0.00%)#6,451 |
| 56. | Maharishi Vedic City | 1 | 3,270(0.03%)#56 | 4,544,093(0.00%)#6,455 |
Common Questions
What are the Top 10 Cities with the Most Immigrants from Caribbean in Iowa?
Top 10 Cities with the Most Immigrants from Caribbean in Iowa are:
#1
331
#2
306
#3
284
#4
213
#5
200
#6
189
#7
170
#8
134
#9
124
#10
111
What city has the Most Immigrants from Caribbean in Iowa?
Storm Lake has the Most Immigrants from Caribbean in Iowa with 331.
What is the Total Immigrants from Caribbean in the State of Iowa?
Total Immigrants from Caribbean in Iowa is 3,270.
What is the Total Immigrants from Caribbean in the United States?
Total Immigrants from Caribbean in the United States is 4,544,093.