Cities with the Most Immigrants from Caribbean in Virginia
RELATED REPORTS & OPTIONS
Caribbean
Virginia
Compare Cities
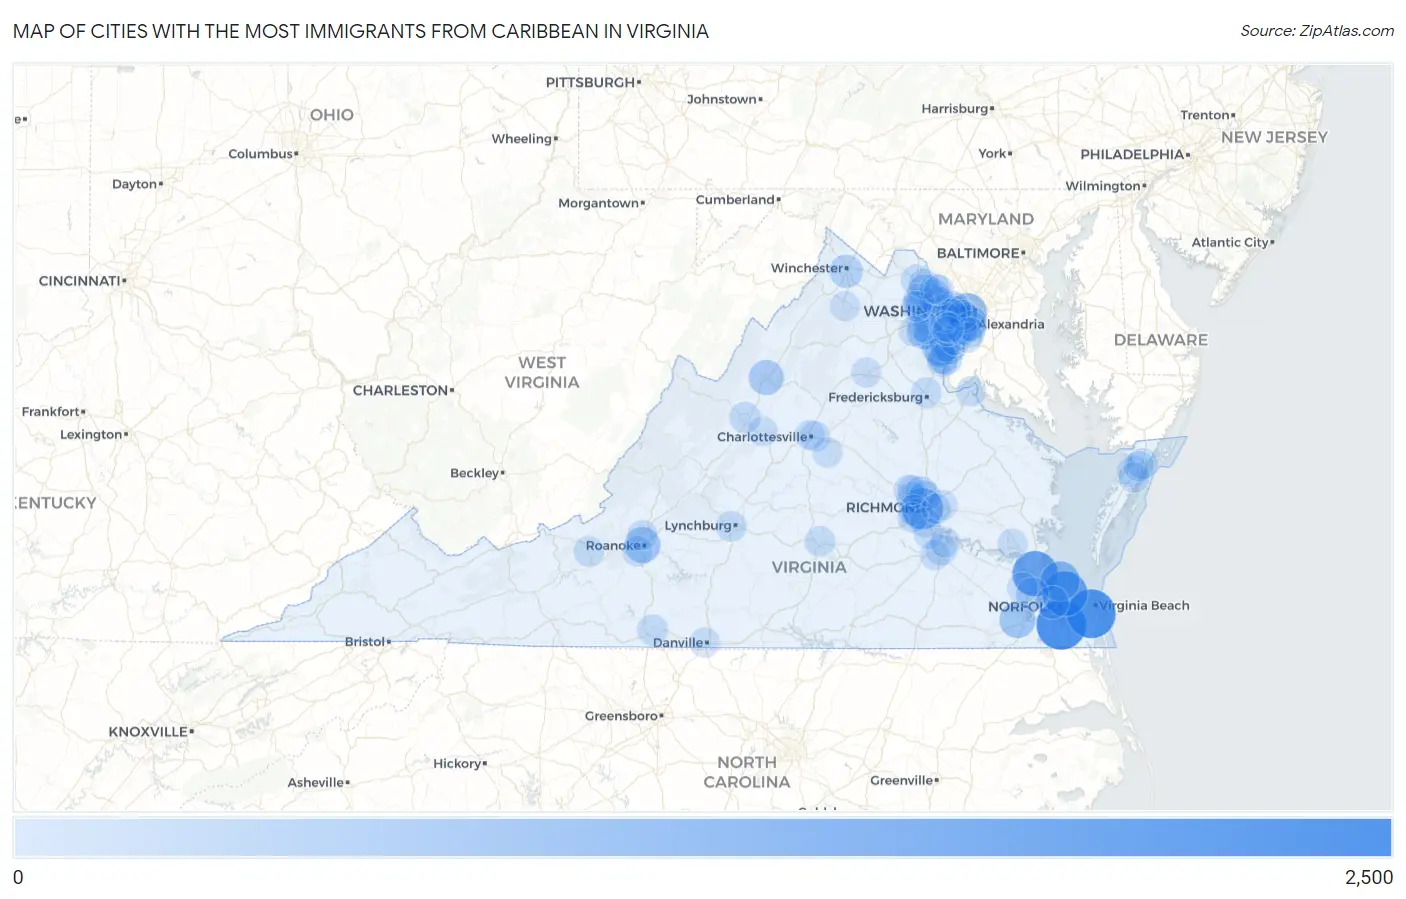
Map of Cities with the Most Immigrants from Caribbean in Virginia
0
2,500
Cities with the Most Immigrants from Caribbean in Virginia
| City | Caribbean | vs State | vs National | |
| 1. | Chesapeake | 2,241 | 36,182(6.19%)#1 | 4,544,093(0.05%)#228 |
| 2. | Virginia Beach | 2,157 | 36,182(5.96%)#2 | 4,544,093(0.05%)#237 |
| 3. | Newport News | 1,753 | 36,182(4.84%)#3 | 4,544,093(0.04%)#285 |
| 4. | Norfolk | 1,739 | 36,182(4.81%)#4 | 4,544,093(0.04%)#286 |
| 5. | Richmond | 1,283 | 36,182(3.55%)#5 | 4,544,093(0.03%)#348 |
| 6. | Hampton | 1,117 | 36,182(3.09%)#6 | 4,544,093(0.02%)#394 |
| 7. | Arlington | 1,003 | 36,182(2.77%)#7 | 4,544,093(0.02%)#420 |
| 8. | Suffolk | 717 | 36,182(1.98%)#8 | 4,544,093(0.02%)#531 |
| 9. | Dale City | 710 | 36,182(1.96%)#9 | 4,544,093(0.02%)#538 |
| 10. | Roanoke | 707 | 36,182(1.95%)#10 | 4,544,093(0.02%)#541 |
| 11. | Alexandria | 665 | 36,182(1.84%)#11 | 4,544,093(0.01%)#568 |
| 12. | Harrisonburg | 608 | 36,182(1.68%)#12 | 4,544,093(0.01%)#598 |
| 13. | Manassas | 447 | 36,182(1.24%)#13 | 4,544,093(0.01%)#729 |
| 14. | Ashburn | 430 | 36,182(1.19%)#14 | 4,544,093(0.01%)#755 |
| 15. | Winchester | 403 | 36,182(1.11%)#15 | 4,544,093(0.01%)#796 |
| 16. | Portsmouth | 382 | 36,182(1.06%)#16 | 4,544,093(0.01%)#825 |
| 17. | Carrollton | 316 | 36,182(0.87%)#17 | 4,544,093(0.01%)#963 |
| 18. | Woodlawn Cdp Fairfax County | 289 | 36,182(0.80%)#18 | 4,544,093(0.01%)#1,018 |
| 19. | Tysons | 276 | 36,182(0.76%)#19 | 4,544,093(0.01%)#1,052 |
| 20. | Tuckahoe | 274 | 36,182(0.76%)#20 | 4,544,093(0.01%)#1,061 |
| 21. | Cherry Hill | 258 | 36,182(0.71%)#21 | 4,544,093(0.01%)#1,112 |
| 22. | Laurel | 252 | 36,182(0.70%)#22 | 4,544,093(0.01%)#1,144 |
| 23. | Sterling | 242 | 36,182(0.67%)#23 | 4,544,093(0.01%)#1,167 |
| 24. | Centreville | 238 | 36,182(0.66%)#24 | 4,544,093(0.01%)#1,178 |
| 25. | Lake Ridge | 235 | 36,182(0.65%)#25 | 4,544,093(0.01%)#1,185 |
| 26. | Reston | 234 | 36,182(0.65%)#26 | 4,544,093(0.01%)#1,190 |
| 27. | Oakton | 226 | 36,182(0.62%)#27 | 4,544,093(0.00%)#1,226 |
| 28. | South Riding | 209 | 36,182(0.58%)#28 | 4,544,093(0.00%)#1,287 |
| 29. | Lakeside | 203 | 36,182(0.56%)#29 | 4,544,093(0.00%)#1,320 |
| 30. | Staunton | 199 | 36,182(0.55%)#30 | 4,544,093(0.00%)#1,341 |
| 31. | Triangle | 183 | 36,182(0.51%)#31 | 4,544,093(0.00%)#1,420 |
| 32. | Sudley | 164 | 36,182(0.45%)#32 | 4,544,093(0.00%)#1,534 |
| 33. | Martinsville | 164 | 36,182(0.45%)#33 | 4,544,093(0.00%)#1,536 |
| 34. | Leesylvania | 163 | 36,182(0.45%)#34 | 4,544,093(0.00%)#1,541 |
| 35. | Herndon | 162 | 36,182(0.45%)#35 | 4,544,093(0.00%)#1,551 |
| 36. | Rose Hill Cdp Fairfax County | 157 | 36,182(0.43%)#36 | 4,544,093(0.00%)#1,577 |
| 37. | Arcola | 155 | 36,182(0.43%)#37 | 4,544,093(0.00%)#1,593 |
| 38. | Woodbridge | 150 | 36,182(0.41%)#38 | 4,544,093(0.00%)#1,618 |
| 39. | Parksley | 148 | 36,182(0.41%)#39 | 4,544,093(0.00%)#1,634 |
| 40. | Mappsville | 144 | 36,182(0.40%)#40 | 4,544,093(0.00%)#1,659 |
| 41. | Fort Lee | 143 | 36,182(0.40%)#41 | 4,544,093(0.00%)#1,665 |
| 42. | Annandale | 139 | 36,182(0.38%)#42 | 4,544,093(0.00%)#1,684 |
| 43. | Leesburg | 136 | 36,182(0.38%)#43 | 4,544,093(0.00%)#1,714 |
| 44. | West Springfield | 133 | 36,182(0.37%)#44 | 4,544,093(0.00%)#1,743 |
| 45. | Buckhall | 131 | 36,182(0.36%)#45 | 4,544,093(0.00%)#1,763 |
| 46. | Smithfield | 128 | 36,182(0.35%)#46 | 4,544,093(0.00%)#1,790 |
| 47. | Short Pump | 118 | 36,182(0.33%)#47 | 4,544,093(0.00%)#1,877 |
| 48. | Montclair | 118 | 36,182(0.33%)#48 | 4,544,093(0.00%)#1,878 |
| 49. | Franconia | 116 | 36,182(0.32%)#49 | 4,544,093(0.00%)#1,898 |
| 50. | Manassas Park | 116 | 36,182(0.32%)#50 | 4,544,093(0.00%)#1,899 |
| 51. | Potomac Mills | 115 | 36,182(0.32%)#51 | 4,544,093(0.00%)#1,909 |
| 52. | Dumfries | 115 | 36,182(0.32%)#52 | 4,544,093(0.00%)#1,910 |
| 53. | Cave Spring | 112 | 36,182(0.31%)#53 | 4,544,093(0.00%)#1,939 |
| 54. | Manchester | 112 | 36,182(0.31%)#54 | 4,544,093(0.00%)#1,943 |
| 55. | Brambleton | 111 | 36,182(0.31%)#55 | 4,544,093(0.00%)#1,956 |
| 56. | Lynchburg | 109 | 36,182(0.30%)#56 | 4,544,093(0.00%)#1,979 |
| 57. | Lorton | 106 | 36,182(0.29%)#57 | 4,544,093(0.00%)#2,011 |
| 58. | One Loudoun | 105 | 36,182(0.29%)#58 | 4,544,093(0.00%)#2,019 |
| 59. | Pimmit Hills | 103 | 36,182(0.28%)#59 | 4,544,093(0.00%)#2,050 |
| 60. | Pantops | 101 | 36,182(0.28%)#60 | 4,544,093(0.00%)#2,077 |
| 61. | Falmouth | 100 | 36,182(0.28%)#61 | 4,544,093(0.00%)#2,087 |
| 62. | Kingstowne | 99 | 36,182(0.27%)#62 | 4,544,093(0.00%)#2,096 |
| 63. | Bailey S Crossroads | 97 | 36,182(0.27%)#63 | 4,544,093(0.00%)#2,123 |
| 64. | Bon Air | 97 | 36,182(0.27%)#64 | 4,544,093(0.00%)#2,126 |
| 65. | Fairfax | 96 | 36,182(0.27%)#65 | 4,544,093(0.00%)#2,143 |
| 66. | Idylwood | 96 | 36,182(0.27%)#66 | 4,544,093(0.00%)#2,146 |
| 67. | Huntington | 96 | 36,182(0.27%)#67 | 4,544,093(0.00%)#2,149 |
| 68. | Blacksburg | 95 | 36,182(0.26%)#68 | 4,544,093(0.00%)#2,159 |
| 69. | Farmville | 94 | 36,182(0.26%)#69 | 4,544,093(0.00%)#2,179 |
| 70. | Chester | 93 | 36,182(0.26%)#70 | 4,544,093(0.00%)#2,190 |
| 71. | Lansdowne | 93 | 36,182(0.26%)#71 | 4,544,093(0.00%)#2,195 |
| 72. | Mount Vernon | 92 | 36,182(0.25%)#72 | 4,544,093(0.00%)#2,203 |
| 73. | Pastoria | 91 | 36,182(0.25%)#73 | 4,544,093(0.00%)#2,231 |
| 74. | Stone Ridge | 90 | 36,182(0.25%)#74 | 4,544,093(0.00%)#2,235 |
| 75. | Petersburg | 88 | 36,182(0.24%)#75 | 4,544,093(0.00%)#2,256 |
| 76. | Seven Corners | 87 | 36,182(0.24%)#76 | 4,544,093(0.00%)#2,273 |
| 77. | Hollins | 86 | 36,182(0.24%)#77 | 4,544,093(0.00%)#2,281 |
| 78. | Highland Springs | 86 | 36,182(0.24%)#78 | 4,544,093(0.00%)#2,282 |
| 79. | Hybla Valley | 83 | 36,182(0.23%)#79 | 4,544,093(0.00%)#2,332 |
| 80. | Burke Centre | 83 | 36,182(0.23%)#80 | 4,544,093(0.00%)#2,333 |
| 81. | Meadowbrook | 82 | 36,182(0.23%)#81 | 4,544,093(0.00%)#2,342 |
| 82. | Nelsonia | 82 | 36,182(0.23%)#82 | 4,544,093(0.00%)#2,348 |
| 83. | Danville | 80 | 36,182(0.22%)#83 | 4,544,093(0.00%)#2,369 |
| 84. | Williamsburg | 80 | 36,182(0.22%)#84 | 4,544,093(0.00%)#2,373 |
| 85. | Cascades | 77 | 36,182(0.21%)#85 | 4,544,093(0.00%)#2,425 |
| 86. | Lake Monticello | 76 | 36,182(0.21%)#86 | 4,544,093(0.00%)#2,446 |
| 87. | Merrifield | 73 | 36,182(0.20%)#87 | 4,544,093(0.00%)#2,499 |
| 88. | Culpeper | 71 | 36,182(0.20%)#88 | 4,544,093(0.00%)#2,535 |
| 89. | Hopewell | 67 | 36,182(0.19%)#89 | 4,544,093(0.00%)#2,604 |
| 90. | Dahlgren | 67 | 36,182(0.19%)#90 | 4,544,093(0.00%)#2,613 |
| 91. | Linton Hall | 65 | 36,182(0.18%)#91 | 4,544,093(0.00%)#2,633 |
| 92. | Lowes Island | 65 | 36,182(0.18%)#92 | 4,544,093(0.00%)#2,635 |
| 93. | Montrose | 65 | 36,182(0.18%)#93 | 4,544,093(0.00%)#2,641 |
| 94. | South Run | 63 | 36,182(0.17%)#94 | 4,544,093(0.00%)#2,678 |
| 95. | Charlottesville | 62 | 36,182(0.17%)#95 | 4,544,093(0.00%)#2,689 |
| 96. | Front Royal | 61 | 36,182(0.17%)#96 | 4,544,093(0.00%)#2,725 |
| 97. | Rockwood | 61 | 36,182(0.17%)#97 | 4,544,093(0.00%)#2,732 |
| 98. | Burke | 60 | 36,182(0.17%)#98 | 4,544,093(0.00%)#2,744 |
| 99. | Innsbrook | 60 | 36,182(0.17%)#99 | 4,544,093(0.00%)#2,757 |
| 100. | Waynesboro | 57 | 36,182(0.16%)#100 | 4,544,093(0.00%)#2,812 |
Common Questions
What are the Top 10 Cities with the Most Immigrants from Caribbean in Virginia?
Top 10 Cities with the Most Immigrants from Caribbean in Virginia are:
#1
2,241
#2
2,157
#3
1,753
#4
1,739
#5
1,283
#6
1,117
#7
1,003
#8
717
#9
710
#10
707
What city has the Most Immigrants from Caribbean in Virginia?
Chesapeake has the Most Immigrants from Caribbean in Virginia with 2,241.
What is the Total Immigrants from Caribbean in the State of Virginia?
Total Immigrants from Caribbean in Virginia is 36,182.
What is the Total Immigrants from Caribbean in the United States?
Total Immigrants from Caribbean in the United States is 4,544,093.