Methuen Town, MA
Methuen Town Map
Methuen Town Overview
52,812
TOTAL POPULATION
25,396
MALE POPULATION
27,416
FEMALE POPULATION
92.63
MALES / 100 FEMALES
107.95
FEMALES / 100 MALES
40.6
MEDIAN AGE
3.2
AVG FAMILY SIZE
2.8
AVG HOUSEHOLD SIZE
$43,551
PER CAPITA INCOME
$114,241
AVG FAMILY INCOME
$93,681
AVG HOUSEHOLD INCOME
30.9%
WAGE / INCOME GAP [ % ]
69.1¢/ $1
WAGE / INCOME GAP [ $ ]
$9,808
FAMILY INCOME DEFICIT
0.44
INEQUALITY / GINI INDEX
29,574
LABOR FORCE [ PEOPLE ]
67.9%
PERCENT IN LABOR FORCE
6.4%
UNEMPLOYMENT RATE
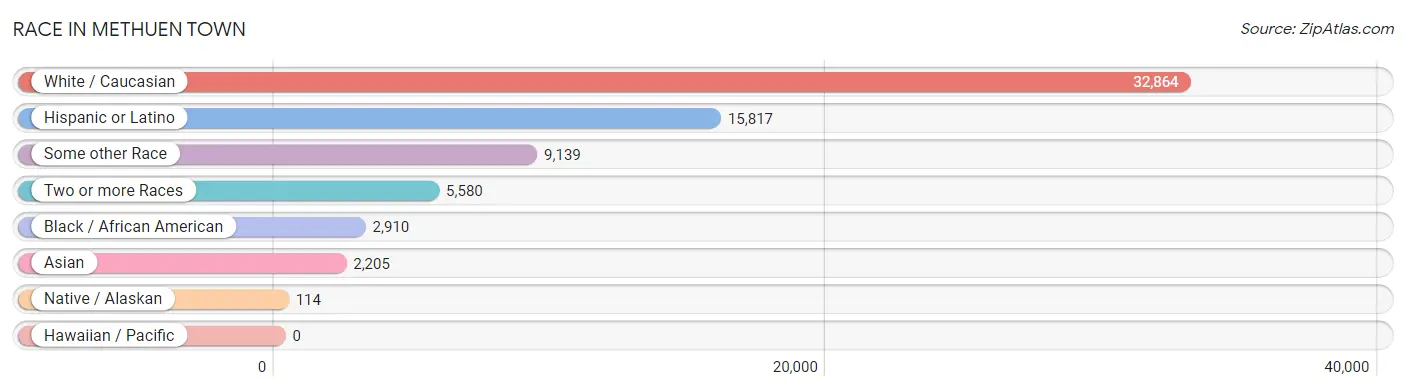
Race in Methuen Town
The most populous races in Methuen Town are White / Caucasian (32,864 | 62.2%), Hispanic or Latino (15,817 | 29.9%), and Some other Race (9,139 | 17.3%).
| Race | # Population | % Population |
| Asian | 2,205 | 4.2% |
| Black / African American | 2,910 | 5.5% |
| Hawaiian / Pacific | 0 | 0.0% |
| Hispanic or Latino | 15,817 | 29.9% |
| Native / Alaskan | 114 | 0.2% |
| White / Caucasian | 32,864 | 62.2% |
| Two or more Races | 5,580 | 10.6% |
| Some other Race | 9,139 | 17.3% |
| Total | 52,812 | 100.0% |
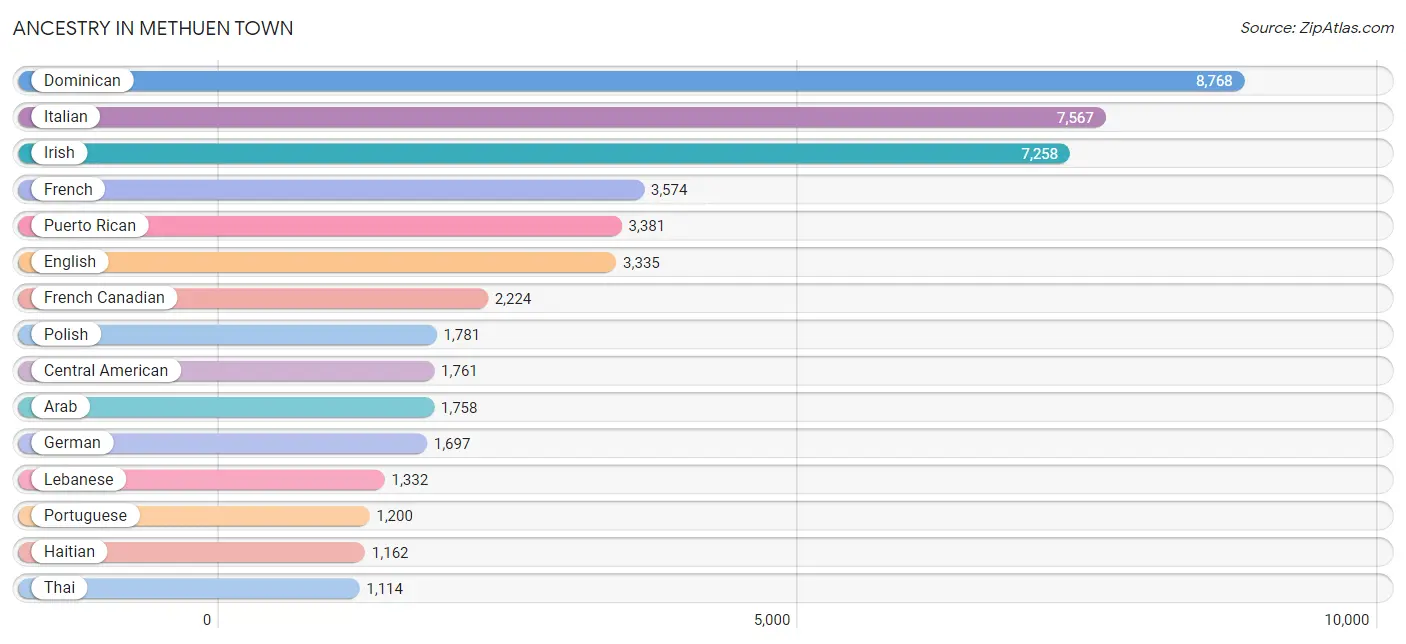
Ancestry in Methuen Town
The most populous ancestries reported in Methuen Town are Dominican (8,768 | 16.6%), Italian (7,567 | 14.3%), Irish (7,258 | 13.7%), French (3,574 | 6.8%), and Puerto Rican (3,381 | 6.4%), together accounting for 57.8% of all Methuen Town residents.
| Ancestry | # Population | % Population |
| African | 427 | 0.8% |
| American | 946 | 1.8% |
| Arab | 1,758 | 3.3% |
| Armenian | 99 | 0.2% |
| Australian | 3 | 0.0% |
| Austrian | 25 | 0.1% |
| Bhutanese | 20 | 0.0% |
| Blackfeet | 9 | 0.0% |
| Brazilian | 147 | 0.3% |
| British | 81 | 0.2% |
| British West Indian | 1 | 0.0% |
| Burmese | 122 | 0.2% |
| Cajun | 8 | 0.0% |
| Canadian | 201 | 0.4% |
| Cape Verdean | 76 | 0.1% |
| Central American | 1,761 | 3.3% |
| Central American Indian | 118 | 0.2% |
| Colombian | 41 | 0.1% |
| Costa Rican | 161 | 0.3% |
| Croatian | 11 | 0.0% |
| Cuban | 148 | 0.3% |
| Czech | 34 | 0.1% |
| Danish | 14 | 0.0% |
| Dominican | 8,768 | 16.6% |
| Dutch | 38 | 0.1% |
| Eastern European | 58 | 0.1% |
| Ecuadorian | 893 | 1.7% |
| English | 3,335 | 6.3% |
| European | 558 | 1.1% |
| Filipino | 31 | 0.1% |
| French | 3,574 | 6.8% |
| French American Indian | 12 | 0.0% |
| French Canadian | 2,224 | 4.2% |
| German | 1,697 | 3.2% |
| Greek | 440 | 0.8% |
| Guatemalan | 610 | 1.2% |
| Guyanese | 30 | 0.1% |
| Haitian | 1,162 | 2.2% |
| Honduran | 207 | 0.4% |
| Hungarian | 165 | 0.3% |
| Indian (Asian) | 196 | 0.4% |
| Iranian | 77 | 0.2% |
| Irish | 7,258 | 13.7% |
| Italian | 7,567 | 14.3% |
| Jamaican | 47 | 0.1% |
| Japanese | 87 | 0.2% |
| Kenyan | 45 | 0.1% |
| Korean | 121 | 0.2% |
| Laotian | 27 | 0.1% |
| Latvian | 10 | 0.0% |
| Lebanese | 1,332 | 2.5% |
| Lithuanian | 434 | 0.8% |
| Mexican | 251 | 0.5% |
| Moroccan | 215 | 0.4% |
| Nicaraguan | 136 | 0.3% |
| Nigerian | 55 | 0.1% |
| Northern European | 11 | 0.0% |
| Norwegian | 319 | 0.6% |
| Pakistani | 85 | 0.2% |
| Panamanian | 27 | 0.1% |
| Paraguayan | 19 | 0.0% |
| Polish | 1,781 | 3.4% |
| Portuguese | 1,200 | 2.3% |
| Puerto Rican | 3,381 | 6.4% |
| Russian | 404 | 0.8% |
| Salvadoran | 620 | 1.2% |
| Scandinavian | 118 | 0.2% |
| Scotch-Irish | 170 | 0.3% |
| Scottish | 951 | 1.8% |
| South African | 8 | 0.0% |
| South American | 957 | 1.8% |
| Spaniard | 77 | 0.2% |
| Spanish | 45 | 0.1% |
| Sri Lankan | 561 | 1.1% |
| Subsaharan African | 751 | 1.4% |
| Swedish | 338 | 0.6% |
| Swiss | 18 | 0.0% |
| Syrian | 22 | 0.0% |
| Thai | 1,114 | 2.1% |
| Turkish | 21 | 0.0% |
| Ukrainian | 59 | 0.1% |
| Venezuelan | 4 | 0.0% |
| Welsh | 58 | 0.1% |
| West Indian | 100 | 0.2% | View All 84 Rows |
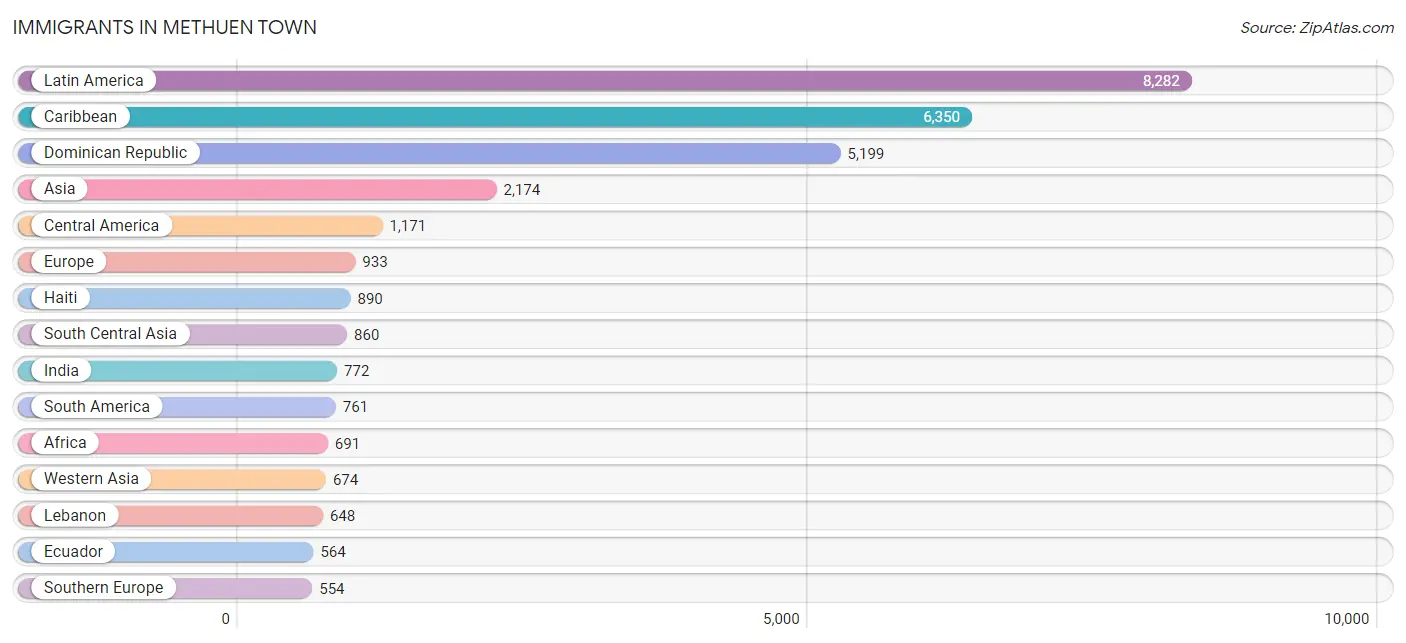
Immigrants in Methuen Town
The most numerous immigrant groups reported in Methuen Town came from Latin America (8,282 | 15.7%), Caribbean (6,350 | 12.0%), Dominican Republic (5,199 | 9.8%), Asia (2,174 | 4.1%), and Central America (1,171 | 2.2%), together accounting for 43.9% of all Methuen Town residents.
| Immigration Origin | # Population | % Population |
| Africa | 691 | 1.3% |
| Asia | 2,174 | 4.1% |
| Azores | 109 | 0.2% |
| Barbados | 44 | 0.1% |
| Brazil | 148 | 0.3% |
| Cabo Verde | 24 | 0.1% |
| Cameroon | 76 | 0.1% |
| Canada | 134 | 0.3% |
| Caribbean | 6,350 | 12.0% |
| Central America | 1,171 | 2.2% |
| China | 120 | 0.2% |
| Costa Rica | 62 | 0.1% |
| Cuba | 84 | 0.2% |
| Dominica | 118 | 0.2% |
| Dominican Republic | 5,199 | 9.8% |
| Eastern Africa | 192 | 0.4% |
| Eastern Asia | 153 | 0.3% |
| Eastern Europe | 161 | 0.3% |
| Ecuador | 564 | 1.1% |
| El Salvador | 253 | 0.5% |
| England | 39 | 0.1% |
| Europe | 933 | 1.8% |
| Germany | 70 | 0.1% |
| Ghana | 134 | 0.3% |
| Greece | 93 | 0.2% |
| Guatemala | 510 | 1.0% |
| Guyana | 1 | 0.0% |
| Haiti | 890 | 1.7% |
| Honduras | 211 | 0.4% |
| Hungary | 3 | 0.0% |
| India | 772 | 1.5% |
| Indonesia | 27 | 0.1% |
| Iran | 35 | 0.1% |
| Ireland | 81 | 0.2% |
| Italy | 179 | 0.3% |
| Jamaica | 15 | 0.0% |
| Kenya | 71 | 0.1% |
| Korea | 33 | 0.1% |
| Latin America | 8,282 | 15.7% |
| Lebanon | 648 | 1.2% |
| Mexico | 39 | 0.1% |
| Middle Africa | 99 | 0.2% |
| Morocco | 235 | 0.4% |
| Nicaragua | 81 | 0.2% |
| Northern Africa | 235 | 0.4% |
| Northern Europe | 139 | 0.3% |
| Norway | 11 | 0.0% |
| Oceania | 7 | 0.0% |
| Pakistan | 43 | 0.1% |
| Panama | 15 | 0.0% |
| Philippines | 41 | 0.1% |
| Poland | 126 | 0.2% |
| Portugal | 282 | 0.5% |
| Russia | 13 | 0.0% |
| Senegal | 7 | 0.0% |
| South America | 761 | 1.4% |
| South Central Asia | 860 | 1.6% |
| South Eastern Asia | 487 | 0.9% |
| Southern Europe | 554 | 1.1% |
| Sri Lanka | 10 | 0.0% |
| Switzerland | 9 | 0.0% |
| Syria | 26 | 0.1% |
| Taiwan | 25 | 0.1% |
| Thailand | 50 | 0.1% |
| Uganda | 50 | 0.1% |
| Ukraine | 15 | 0.0% |
| Venezuela | 29 | 0.1% |
| Vietnam | 369 | 0.7% |
| Western Africa | 165 | 0.3% |
| Western Asia | 674 | 1.3% |
| Western Europe | 79 | 0.2% | View All 71 Rows |
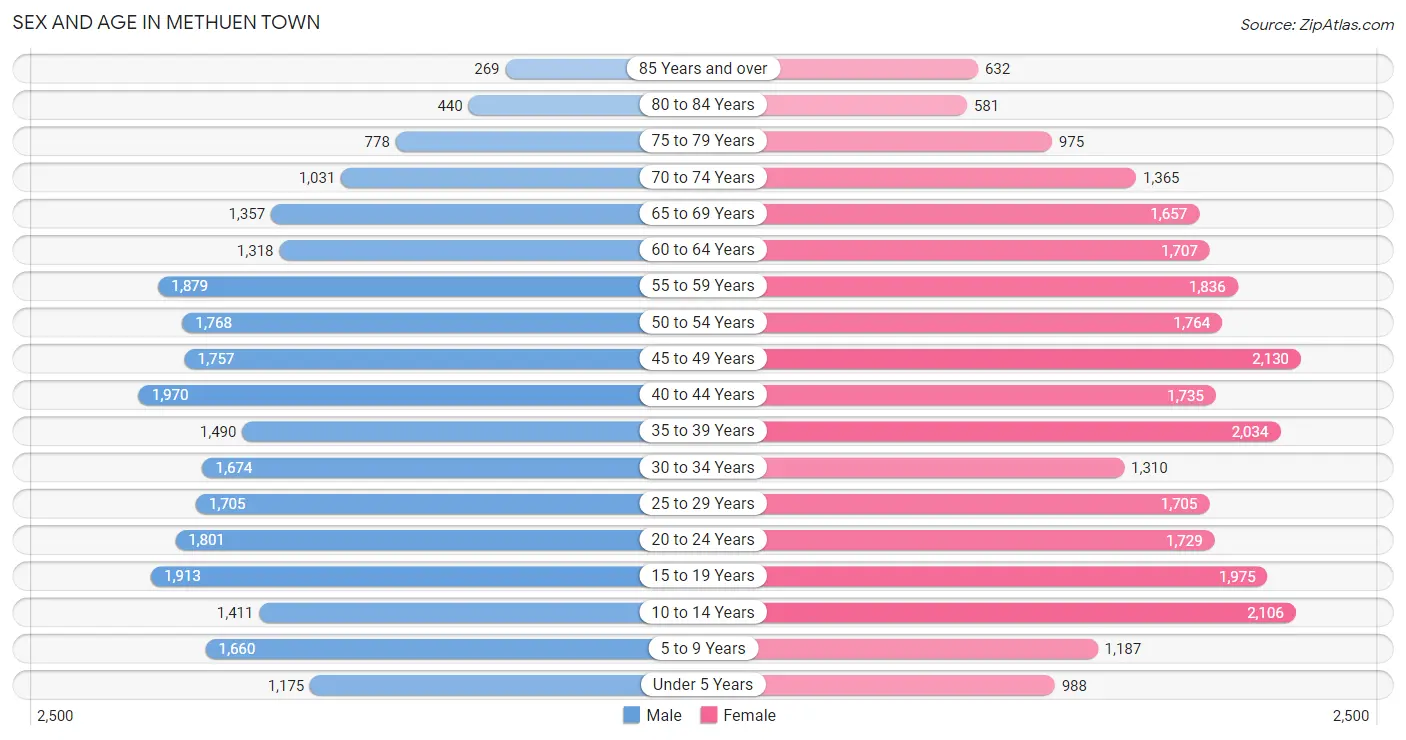
Sex and Age in Methuen Town
Sex and Age in Methuen Town
The most populous age groups in Methuen Town are 40 to 44 Years (1,970 | 7.8%) for men and 45 to 49 Years (2,130 | 7.8%) for women.
| Age Bracket | Male | Female |
| Under 5 Years | 1,175 (4.6%) | 988 (3.6%) |
| 5 to 9 Years | 1,660 (6.5%) | 1,187 (4.3%) |
| 10 to 14 Years | 1,411 (5.6%) | 2,106 (7.7%) |
| 15 to 19 Years | 1,913 (7.5%) | 1,975 (7.2%) |
| 20 to 24 Years | 1,801 (7.1%) | 1,729 (6.3%) |
| 25 to 29 Years | 1,705 (6.7%) | 1,705 (6.2%) |
| 30 to 34 Years | 1,674 (6.6%) | 1,310 (4.8%) |
| 35 to 39 Years | 1,490 (5.9%) | 2,034 (7.4%) |
| 40 to 44 Years | 1,970 (7.8%) | 1,735 (6.3%) |
| 45 to 49 Years | 1,757 (6.9%) | 2,130 (7.8%) |
| 50 to 54 Years | 1,768 (7.0%) | 1,764 (6.4%) |
| 55 to 59 Years | 1,879 (7.4%) | 1,836 (6.7%) |
| 60 to 64 Years | 1,318 (5.2%) | 1,707 (6.2%) |
| 65 to 69 Years | 1,357 (5.3%) | 1,657 (6.0%) |
| 70 to 74 Years | 1,031 (4.1%) | 1,365 (5.0%) |
| 75 to 79 Years | 778 (3.1%) | 975 (3.6%) |
| 80 to 84 Years | 440 (1.7%) | 581 (2.1%) |
| 85 Years and over | 269 (1.1%) | 632 (2.3%) |
| Total | 25,396 (100.0%) | 27,416 (100.0%) |
Families and Households in Methuen Town
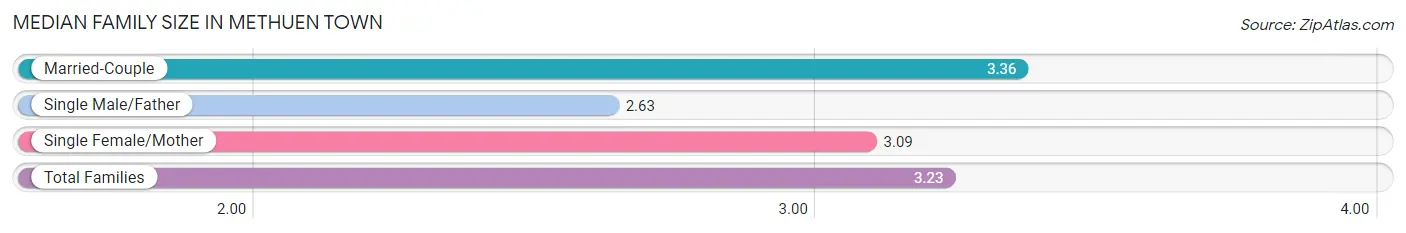
Median Family Size in Methuen Town
The median family size in Methuen Town is 3.23 persons per family, with married-couple families (9,598 | 69.6%) accounting for the largest median family size of 3.36 persons per family. On the other hand, single male/father families (1,330 | 9.7%) represent the smallest median family size with 2.63 persons per family.
| Family Type | # Families | Family Size |
| Married-Couple | 9,598 (69.6%) | 3.36 |
| Single Male/Father | 1,330 (9.7%) | 2.63 |
| Single Female/Mother | 2,861 (20.7%) | 3.09 |
| Total Families | 13,789 (100.0%) | 3.23 |
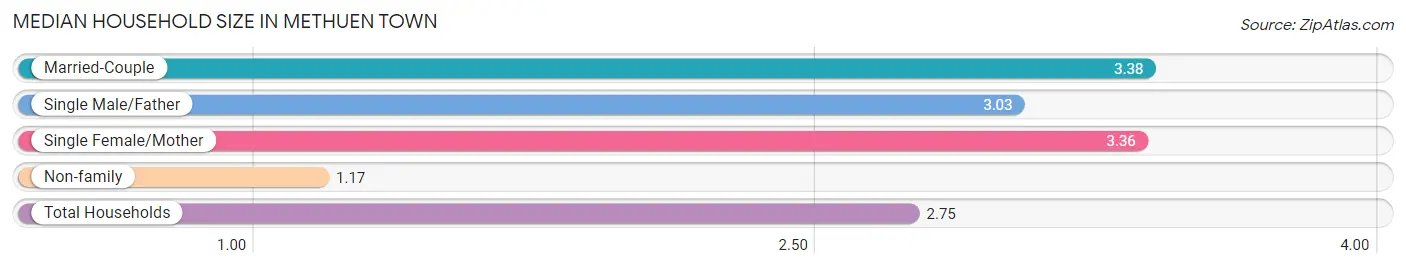
Median Household Size in Methuen Town
The median household size in Methuen Town is 2.75 persons per household, with married-couple households (9,598 | 50.4%) accounting for the largest median household size of 3.38 persons per household. non-family households (5,254 | 27.6%) represent the smallest median household size with 1.17 persons per household.
| Household Type | # Households | Household Size |
| Married-Couple | 9,598 (50.4%) | 3.38 |
| Single Male/Father | 1,330 (7.0%) | 3.03 |
| Single Female/Mother | 2,861 (15.0%) | 3.36 |
| Non-family | 5,254 (27.6%) | 1.17 |
| Total Households | 19,043 (100.0%) | 2.75 |
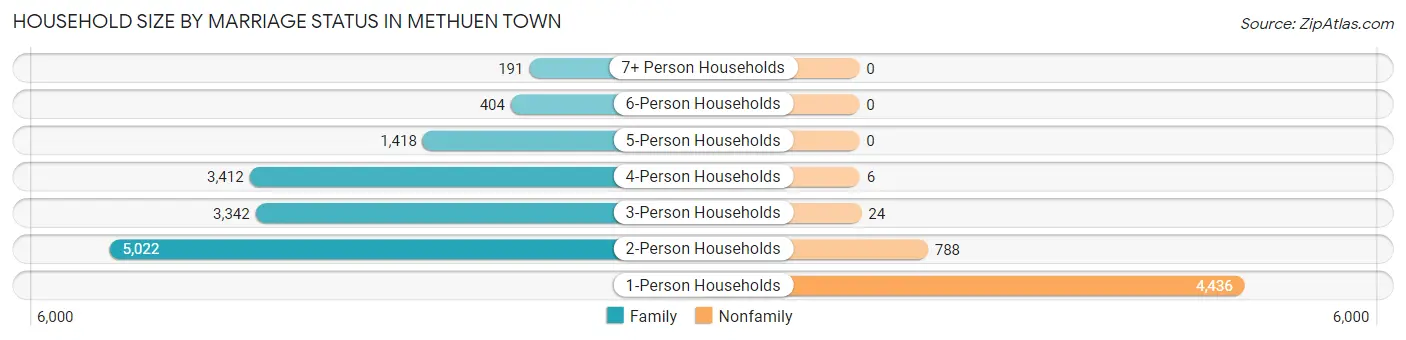
Household Size by Marriage Status in Methuen Town
Out of a total of 19,043 households in Methuen Town, 13,789 (72.4%) are family households, while 5,254 (27.6%) are nonfamily households. The most numerous type of family households are 2-person households, comprising 5,022, and the most common type of nonfamily households are 1-person households, comprising 4,436.
| Household Size | Family Households | Nonfamily Households |
| 1-Person Households | - | 4,436 (23.3%) |
| 2-Person Households | 5,022 (26.4%) | 788 (4.1%) |
| 3-Person Households | 3,342 (17.5%) | 24 (0.1%) |
| 4-Person Households | 3,412 (17.9%) | 6 (0.0%) |
| 5-Person Households | 1,418 (7.4%) | 0 (0.0%) |
| 6-Person Households | 404 (2.1%) | 0 (0.0%) |
| 7+ Person Households | 191 (1.0%) | 0 (0.0%) |
| Total | 13,789 (72.4%) | 5,254 (27.6%) |
Female Fertility in Methuen Town
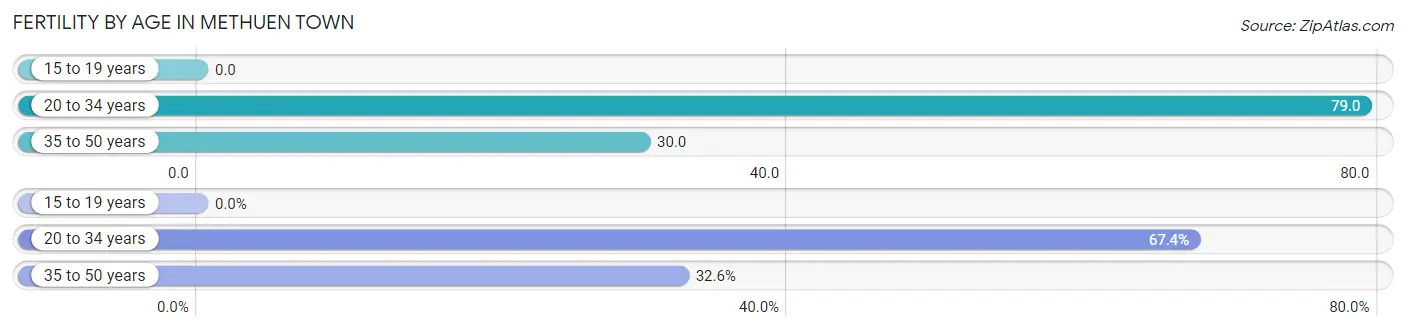
Fertility by Age in Methuen Town
Average fertility rate in Methuen Town is 43.0 births per 1,000 women. Women in the age bracket of 20 to 34 years have the highest fertility rate with 79.0 births per 1,000 women. Women in the age bracket of 20 to 34 years acount for 67.4% of all women with births.
| Age Bracket | Women with Births | Births / 1,000 Women |
| 15 to 19 years | 0 (0.0%) | 0.0 |
| 20 to 34 years | 376 (67.4%) | 79.0 |
| 35 to 50 years | 182 (32.6%) | 30.0 |
| Total | 558 (100.0%) | 43.0 |
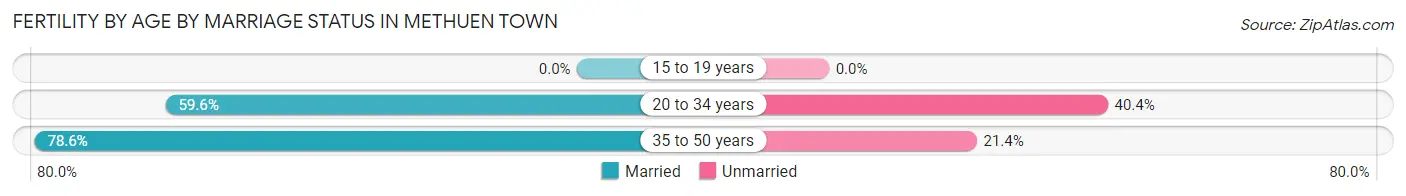
Fertility by Age by Marriage Status in Methuen Town
65.8% of women with births (558) in Methuen Town are married. The highest percentage of unmarried women with births falls into 20 to 34 years age bracket with 40.4% of them unmarried at the time of birth, while the lowest percentage of unmarried women with births belong to 35 to 50 years age bracket with 21.4% of them unmarried.
| Age Bracket | Married | Unmarried |
| 15 to 19 years | 0 (0.0%) | 0 (0.0%) |
| 20 to 34 years | 224 (59.6%) | 152 (40.4%) |
| 35 to 50 years | 143 (78.6%) | 39 (21.4%) |
| Total | 367 (65.8%) | 191 (34.2%) |
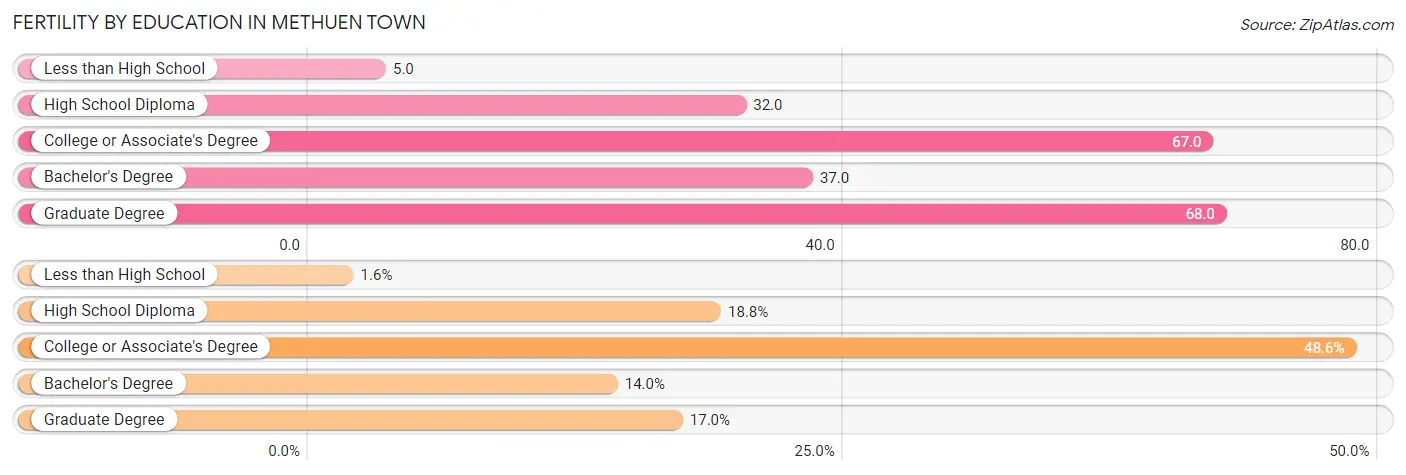
Fertility by Education in Methuen Town
Average fertility rate in Methuen Town is 43.0 births per 1,000 women. Women with the education attainment of graduate degree have the highest fertility rate of 68.0 births per 1,000 women, while women with the education attainment of less than high school have the lowest fertility at 5.0 births per 1,000 women. Women with the education attainment of college or associate's degree represent 48.6% of all women with births.
| Educational Attainment | Women with Births | Births / 1,000 Women |
| Less than High School | 9 (1.6%) | 5.0 |
| High School Diploma | 105 (18.8%) | 32.0 |
| College or Associate's Degree | 271 (48.6%) | 67.0 |
| Bachelor's Degree | 78 (14.0%) | 37.0 |
| Graduate Degree | 95 (17.0%) | 68.0 |
| Total | 558 (100.0%) | 43.0 |
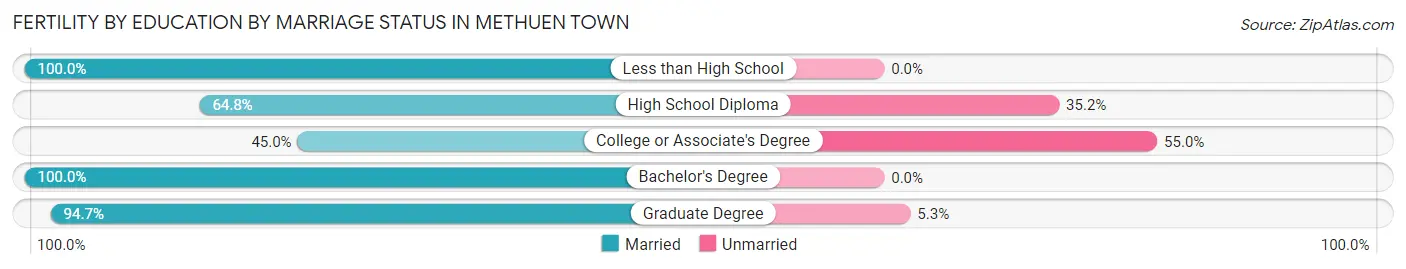
Fertility by Education by Marriage Status in Methuen Town
34.2% of women with births in Methuen Town are unmarried. Women with the educational attainment of less than high school are most likely to be married with 100.0% of them married at childbirth, while women with the educational attainment of college or associate's degree are least likely to be married with 55.0% of them unmarried at childbirth.
| Educational Attainment | Married | Unmarried |
| Less than High School | 9 (100.0%) | 0 (0.0%) |
| High School Diploma | 68 (64.8%) | 37 (35.2%) |
| College or Associate's Degree | 122 (45.0%) | 149 (55.0%) |
| Bachelor's Degree | 78 (100.0%) | 0 (0.0%) |
| Graduate Degree | 90 (94.7%) | 5 (5.3%) |
| Total | 367 (65.8%) | 191 (34.2%) |
Income in Methuen Town
Income Overview in Methuen Town
Per Capita Income in Methuen Town is $43,551, while median incomes of families and households are $114,241 and $93,681 respectively.
| Characteristic | Number | Measure |
| Per Capita Income | 52,812 | $43,551 |
| Median Family Income | 13,789 | $114,241 |
| Mean Family Income | 13,789 | $132,070 |
| Median Household Income | 19,043 | $93,681 |
| Mean Household Income | 19,043 | $117,518 |
| Income Deficit | 13,789 | $9,808 |
| Wage / Income Gap (%) | 52,812 | 30.95% |
| Wage / Income Gap ($) | 52,812 | 69.05¢ per $1 |
| Gini / Inequality Index | 52,812 | 0.44 |
Earnings by Sex in Methuen Town
Average Earnings in Methuen Town are $48,169, $57,536 for men and $39,731 for women, a difference of 30.9%.
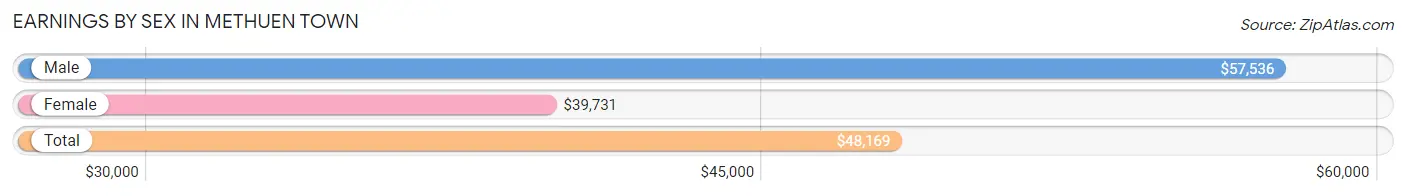
| Sex | Number | Average Earnings |
| Male | 15,442 (51.2%) | $57,536 |
| Female | 14,744 (48.8%) | $39,731 |
| Total | 30,186 (100.0%) | $48,169 |
Earnings by Sex by Income Bracket in Methuen Town
The most common earnings brackets in Methuen Town are $100,000+ for men (3,229 | 20.9%) and $75,000 to $99,999 for women (1,709 | 11.6%).
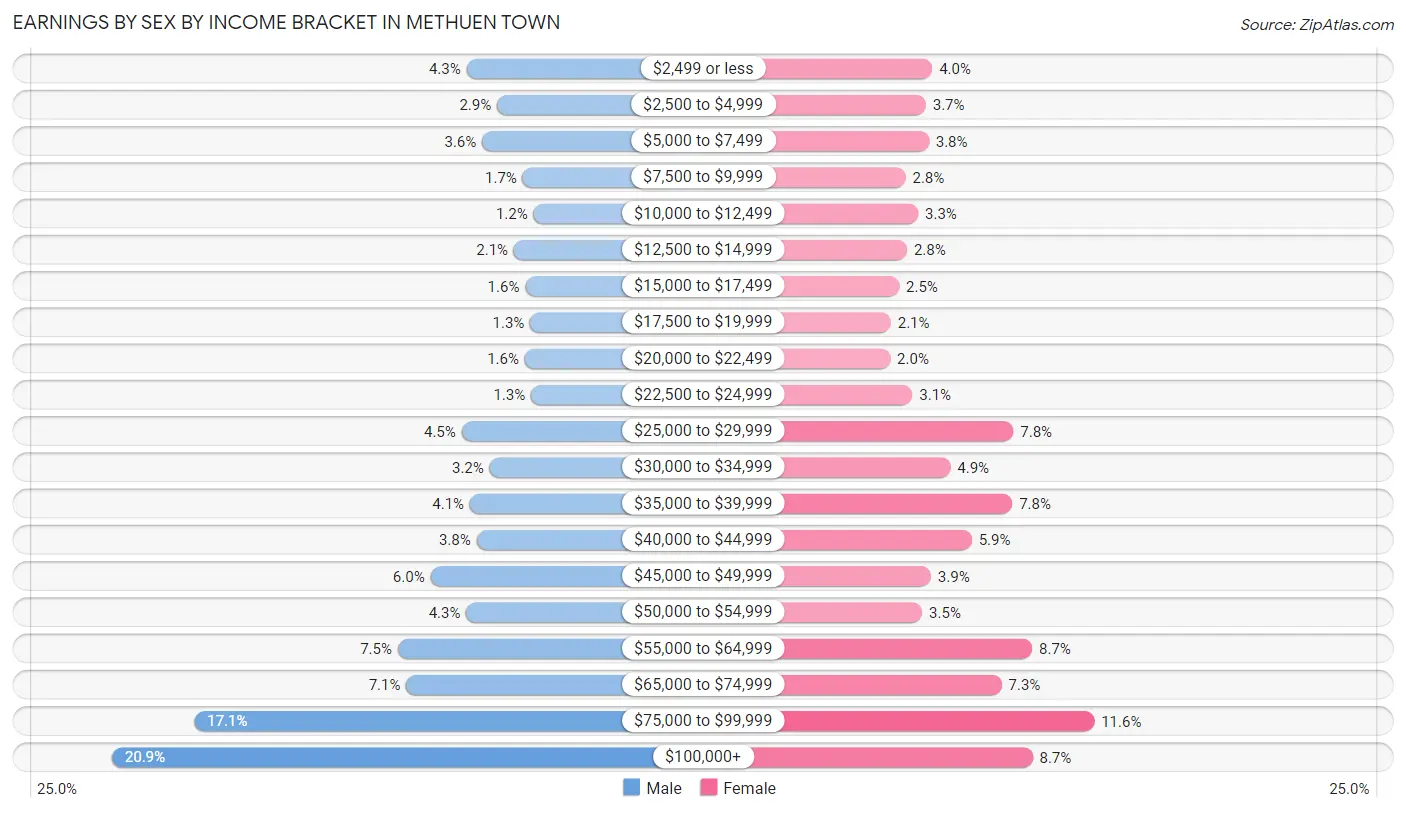
| Income | Male | Female |
| $2,499 or less | 664 (4.3%) | 590 (4.0%) |
| $2,500 to $4,999 | 443 (2.9%) | 546 (3.7%) |
| $5,000 to $7,499 | 552 (3.6%) | 566 (3.8%) |
| $7,500 to $9,999 | 258 (1.7%) | 406 (2.8%) |
| $10,000 to $12,499 | 179 (1.2%) | 493 (3.3%) |
| $12,500 to $14,999 | 321 (2.1%) | 416 (2.8%) |
| $15,000 to $17,499 | 239 (1.5%) | 361 (2.5%) |
| $17,500 to $19,999 | 204 (1.3%) | 303 (2.1%) |
| $20,000 to $22,499 | 242 (1.6%) | 299 (2.0%) |
| $22,500 to $24,999 | 197 (1.3%) | 452 (3.1%) |
| $25,000 to $29,999 | 699 (4.5%) | 1,150 (7.8%) |
| $30,000 to $34,999 | 497 (3.2%) | 715 (4.9%) |
| $35,000 to $39,999 | 639 (4.1%) | 1,143 (7.7%) |
| $40,000 to $44,999 | 591 (3.8%) | 863 (5.9%) |
| $45,000 to $49,999 | 925 (6.0%) | 581 (3.9%) |
| $50,000 to $54,999 | 666 (4.3%) | 520 (3.5%) |
| $55,000 to $64,999 | 1,162 (7.5%) | 1,280 (8.7%) |
| $65,000 to $74,999 | 1,100 (7.1%) | 1,069 (7.2%) |
| $75,000 to $99,999 | 2,635 (17.1%) | 1,709 (11.6%) |
| $100,000+ | 3,229 (20.9%) | 1,282 (8.7%) |
| Total | 15,442 (100.0%) | 14,744 (100.0%) |
Earnings by Sex by Educational Attainment in Methuen Town
Average earnings in Methuen Town are $67,199 for men and $45,837 for women, a difference of 31.8%. Men with an educational attainment of graduate degree enjoy the highest average annual earnings of $120,000, while those with less than high school education earn the least with $50,988. Women with an educational attainment of graduate degree earn the most with the average annual earnings of $74,111, while those with less than high school education have the smallest earnings of $26,414.
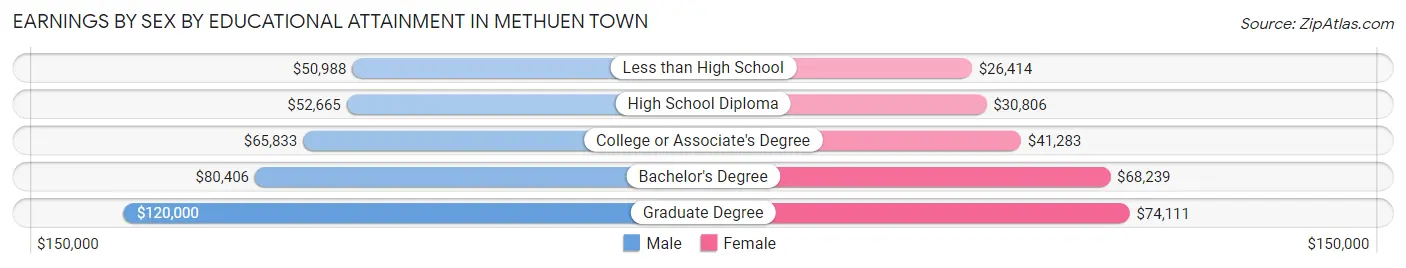
| Educational Attainment | Male Income | Female Income |
| Less than High School | $50,988 | $26,414 |
| High School Diploma | $52,665 | $30,806 |
| College or Associate's Degree | $65,833 | $41,283 |
| Bachelor's Degree | $80,406 | $68,239 |
| Graduate Degree | $120,000 | $74,111 |
| Total | $67,199 | $45,837 |
Family Income in Methuen Town
Family Income Brackets in Methuen Town
According to the Methuen Town family income data, there are 3,240 families falling into the $100,000 to $149,999 income range, which is the most common income bracket and makes up 23.5% of all families. Conversely, the less than $10,000 income bracket is the least frequent group with only 221 families (1.6%) belonging to this category.
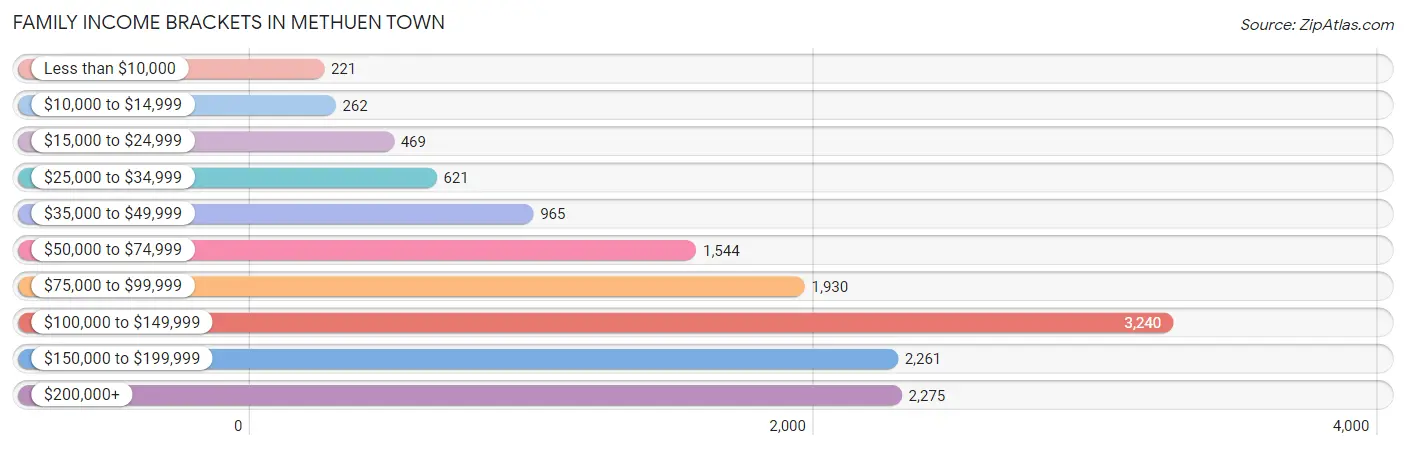
| Income Bracket | # Families | % Families |
| Less than $10,000 | 221 | 1.6% |
| $10,000 to $14,999 | 262 | 1.9% |
| $15,000 to $24,999 | 469 | 3.4% |
| $25,000 to $34,999 | 621 | 4.5% |
| $35,000 to $49,999 | 965 | 7.0% |
| $50,000 to $74,999 | 1,544 | 11.2% |
| $75,000 to $99,999 | 1,930 | 14.0% |
| $100,000 to $149,999 | 3,240 | 23.5% |
| $150,000 to $199,999 | 2,261 | 16.4% |
| $200,000+ | 2,275 | 16.5% |
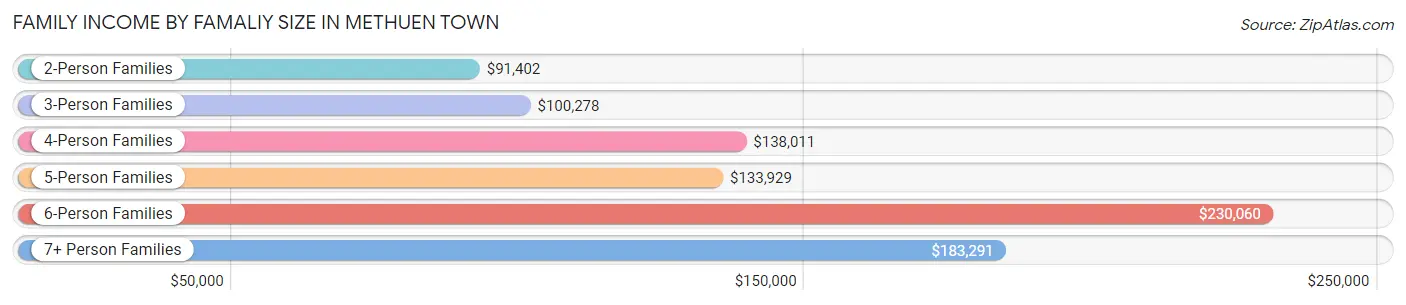
Family Income by Famaliy Size in Methuen Town
6-person families (367 | 2.7%) account for the highest median family income in Methuen Town with $230,060 per family, while 2-person families (5,539 | 40.2%) have the highest median income of $45,701 per family member.
| Income Bracket | # Families | Median Income |
| 2-Person Families | 5,539 (40.2%) | $91,402 |
| 3-Person Families | 3,338 (24.2%) | $100,278 |
| 4-Person Families | 3,082 (22.4%) | $138,011 |
| 5-Person Families | 1,332 (9.7%) | $133,929 |
| 6-Person Families | 367 (2.7%) | $230,060 |
| 7+ Person Families | 131 (0.9%) | $183,291 |
| Total | 13,789 (100.0%) | $114,241 |
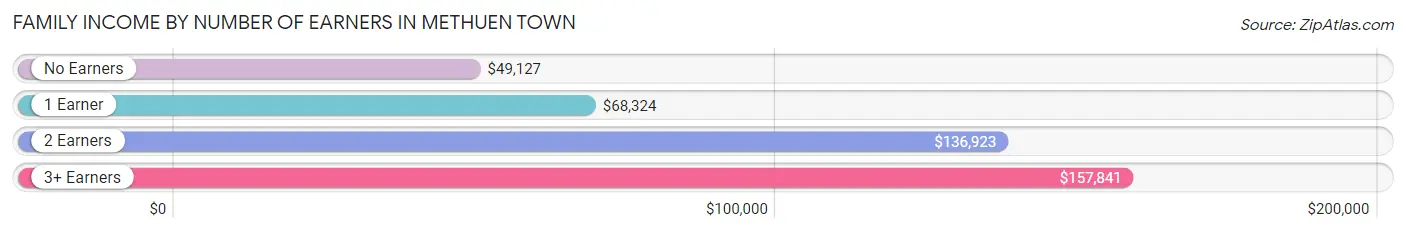
Family Income by Number of Earners in Methuen Town
The median family income in Methuen Town is $114,241, with families comprising 3+ earners (2,891) having the highest median family income of $157,841, while families with no earners (1,706) have the lowest median family income of $49,127, accounting for 21.0% and 12.4% of families, respectively.
| Number of Earners | # Families | Median Income |
| No Earners | 1,706 (12.4%) | $49,127 |
| 1 Earner | 3,664 (26.6%) | $68,324 |
| 2 Earners | 5,528 (40.1%) | $136,923 |
| 3+ Earners | 2,891 (21.0%) | $157,841 |
| Total | 13,789 (100.0%) | $114,241 |
Household Income in Methuen Town
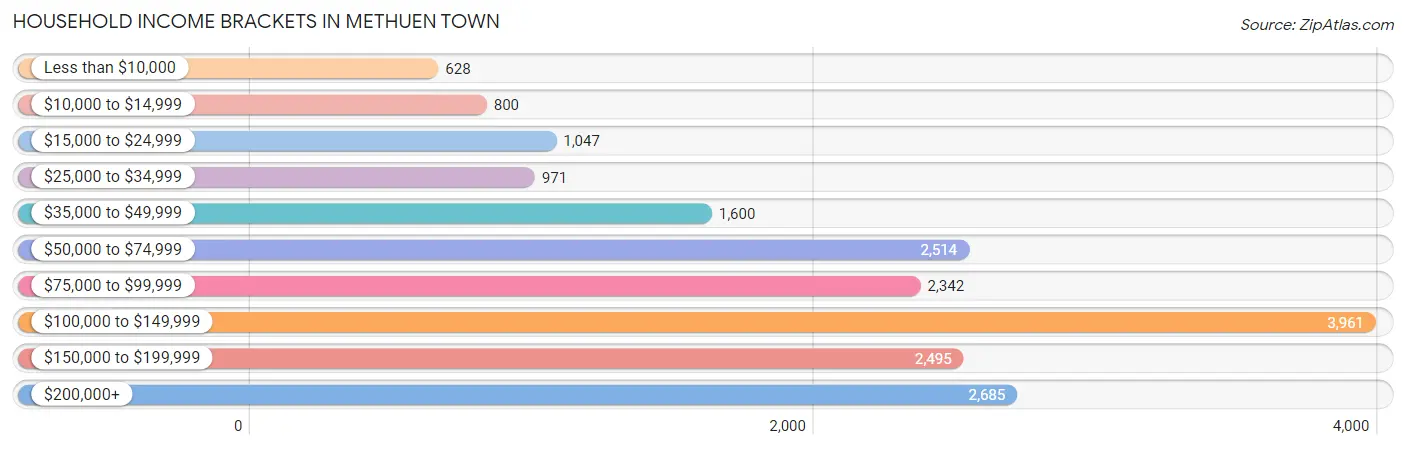
Household Income Brackets in Methuen Town
With 3,961 households falling in the category, the $100,000 to $149,999 income range is the most frequent in Methuen Town, accounting for 20.8% of all households. In contrast, only 628 households (3.3%) fall into the less than $10,000 income bracket, making it the least populous group.
| Income Bracket | # Households | % Households |
| Less than $10,000 | 628 | 3.3% |
| $10,000 to $14,999 | 800 | 4.2% |
| $15,000 to $24,999 | 1,047 | 5.5% |
| $25,000 to $34,999 | 971 | 5.1% |
| $35,000 to $49,999 | 1,600 | 8.4% |
| $50,000 to $74,999 | 2,514 | 13.2% |
| $75,000 to $99,999 | 2,342 | 12.3% |
| $100,000 to $149,999 | 3,961 | 20.8% |
| $150,000 to $199,999 | 2,495 | 13.1% |
| $200,000+ | 2,685 | 14.1% |
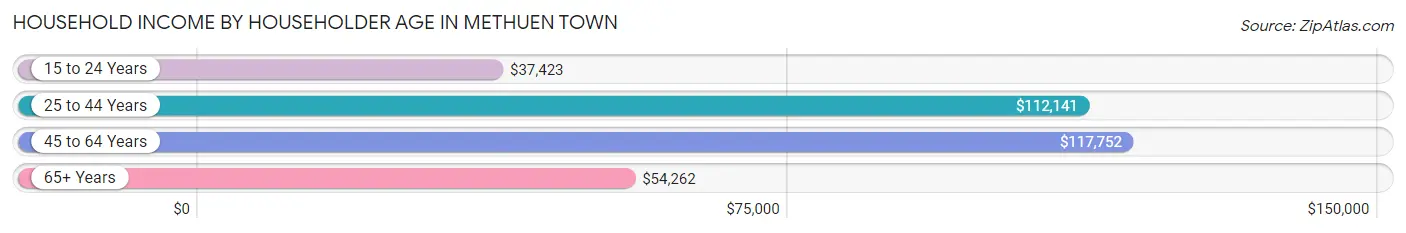
Household Income by Householder Age in Methuen Town
The median household income in Methuen Town is $93,681, with the highest median household income of $117,752 found in the 45 to 64 years age bracket for the primary householder. A total of 7,906 households (41.5%) fall into this category. Meanwhile, the 15 to 24 years age bracket for the primary householder has the lowest median household income of $37,423, with 191 households (1.0%) in this group.
| Income Bracket | # Households | Median Income |
| 15 to 24 Years | 191 (1.0%) | $37,423 |
| 25 to 44 Years | 5,705 (30.0%) | $112,141 |
| 45 to 64 Years | 7,906 (41.5%) | $117,752 |
| 65+ Years | 5,241 (27.5%) | $54,262 |
| Total | 19,043 (100.0%) | $93,681 |
Poverty in Methuen Town
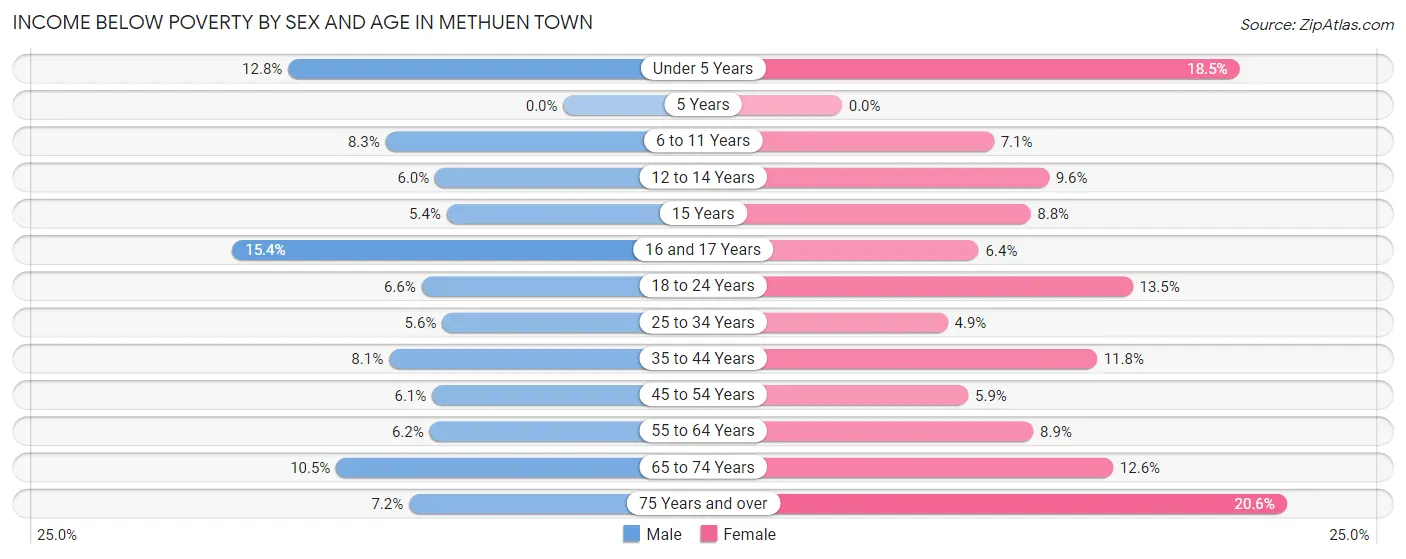
Income Below Poverty by Sex and Age in Methuen Town
With 7.5% poverty level for males and 10.2% for females among the residents of Methuen Town, 16 and 17 year old males and 75 year old and over females are the most vulnerable to poverty, with 118 males (15.4%) and 419 females (20.6%) in their respective age groups living below the poverty level.
| Age Bracket | Male | Female |
| Under 5 Years | 150 (12.8%) | 179 (18.4%) |
| 5 Years | 0 (0.0%) | 0 (0.0%) |
| 6 to 11 Years | 153 (8.3%) | 138 (7.0%) |
| 12 to 14 Years | 54 (5.9%) | 109 (9.6%) |
| 15 Years | 23 (5.4%) | 26 (8.7%) |
| 16 and 17 Years | 118 (15.4%) | 52 (6.4%) |
| 18 to 24 Years | 164 (6.6%) | 348 (13.5%) |
| 25 to 34 Years | 190 (5.6%) | 148 (4.9%) |
| 35 to 44 Years | 280 (8.1%) | 446 (11.8%) |
| 45 to 54 Years | 214 (6.1%) | 228 (5.9%) |
| 55 to 64 Years | 198 (6.2%) | 314 (8.9%) |
| 65 to 74 Years | 248 (10.5%) | 376 (12.6%) |
| 75 Years and over | 102 (7.2%) | 419 (20.6%) |
| Total | 1,894 (7.5%) | 2,783 (10.2%) |
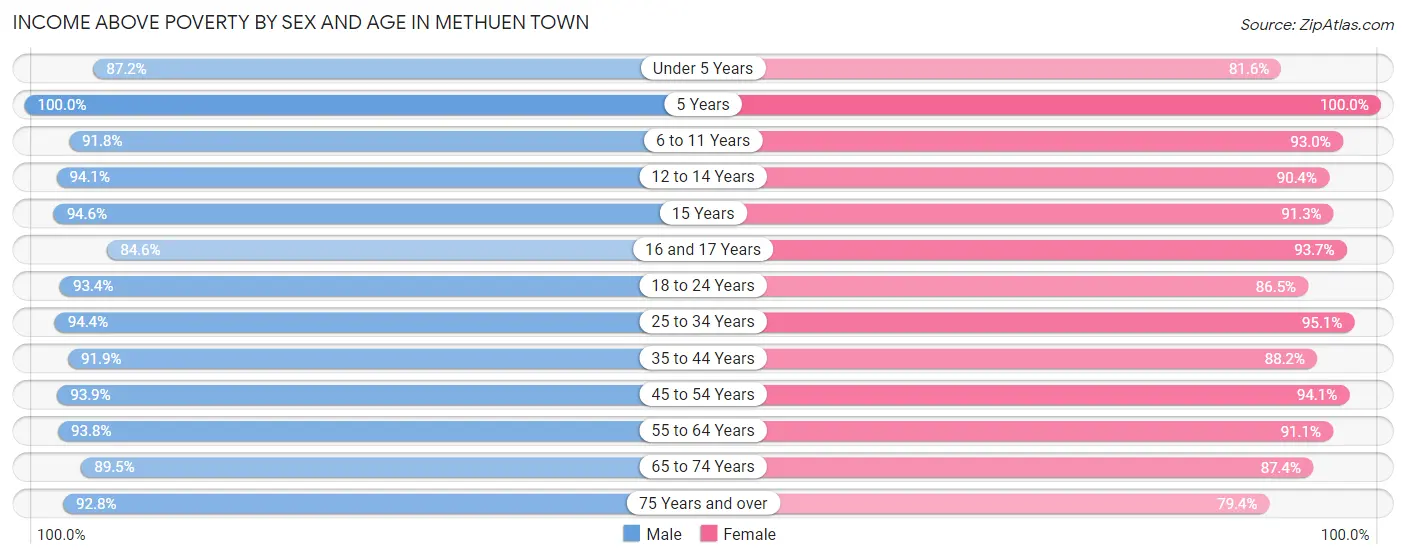
Income Above Poverty by Sex and Age in Methuen Town
According to the poverty statistics in Methuen Town, males aged 5 years and females aged 5 years are the age groups that are most secure financially, with 100.0% of males and 100.0% of females in these age groups living above the poverty line.
| Age Bracket | Male | Female |
| Under 5 Years | 1,025 (87.2%) | 791 (81.6%) |
| 5 Years | 272 (100.0%) | 199 (100.0%) |
| 6 to 11 Years | 1,701 (91.7%) | 1,819 (92.9%) |
| 12 to 14 Years | 853 (94.1%) | 1,026 (90.4%) |
| 15 Years | 402 (94.6%) | 271 (91.2%) |
| 16 and 17 Years | 650 (84.6%) | 767 (93.6%) |
| 18 to 24 Years | 2,328 (93.4%) | 2,232 (86.5%) |
| 25 to 34 Years | 3,189 (94.4%) | 2,867 (95.1%) |
| 35 to 44 Years | 3,180 (91.9%) | 3,323 (88.2%) |
| 45 to 54 Years | 3,301 (93.9%) | 3,666 (94.1%) |
| 55 to 64 Years | 2,989 (93.8%) | 3,223 (91.1%) |
| 65 to 74 Years | 2,104 (89.5%) | 2,613 (87.4%) |
| 75 Years and over | 1,323 (92.8%) | 1,611 (79.4%) |
| Total | 23,317 (92.5%) | 24,408 (89.8%) |
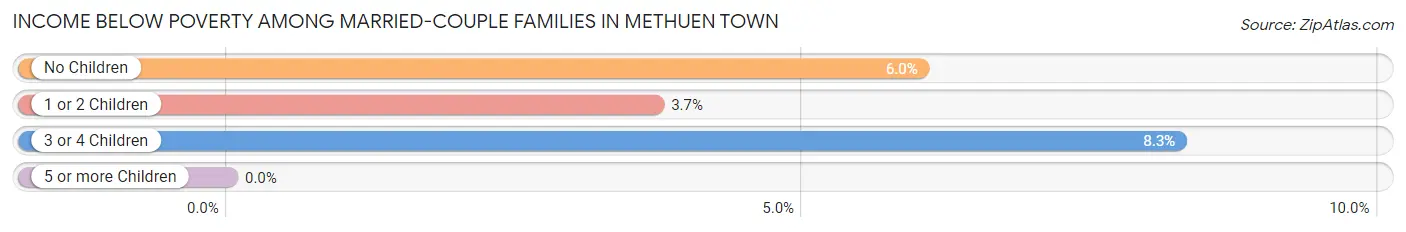
Income Below Poverty Among Married-Couple Families in Methuen Town
The poverty statistics for married-couple families in Methuen Town show that 5.3% or 510 of the total 9,598 families live below the poverty line. Families with 3 or 4 children have the highest poverty rate of 8.3%, comprising of 49 families. On the other hand, families with 5 or more children have the lowest poverty rate of 0.0%, which includes 0 families.
| Children | Above Poverty | Below Poverty |
| No Children | 5,184 (94.0%) | 332 (6.0%) |
| 1 or 2 Children | 3,347 (96.3%) | 129 (3.7%) |
| 3 or 4 Children | 544 (91.7%) | 49 (8.3%) |
| 5 or more Children | 13 (100.0%) | 0 (0.0%) |
| Total | 9,088 (94.7%) | 510 (5.3%) |
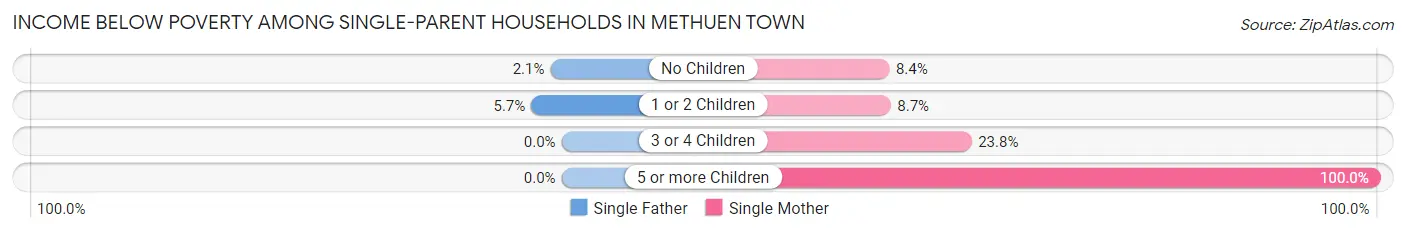
Income Below Poverty Among Single-Parent Households in Methuen Town
According to the poverty data in Methuen Town, 4.1% or 54 single-father households and 10.1% or 289 single-mother households are living below the poverty line. Among single-father households, those with 1 or 2 children have the highest poverty rate, with 42 households (5.7%) experiencing poverty. Likewise, among single-mother households, those with 5 or more children have the highest poverty rate, with 18 households (100.0%) falling below the poverty line.
| Children | Single Father | Single Mother |
| No Children | 12 (2.1%) | 115 (8.4%) |
| 1 or 2 Children | 42 (5.7%) | 113 (8.7%) |
| 3 or 4 Children | 0 (0.0%) | 43 (23.8%) |
| 5 or more Children | 0 (0.0%) | 18 (100.0%) |
| Total | 54 (4.1%) | 289 (10.1%) |
Income Below Poverty Among Married-Couple vs Single-Parent Households in Methuen Town
The poverty data for Methuen Town shows that 510 of the married-couple family households (5.3%) and 343 of the single-parent households (8.2%) are living below the poverty level. Within the married-couple family households, those with 3 or 4 children have the highest poverty rate, with 49 households (8.3%) falling below the poverty line. Among the single-parent households, those with 5 or more children have the highest poverty rate, with 18 household (100.0%) living below poverty.
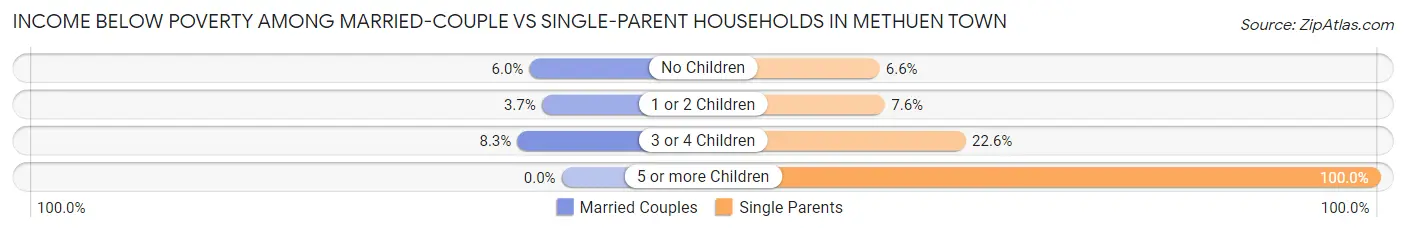
| Children | Married-Couple Families | Single-Parent Households |
| No Children | 332 (6.0%) | 127 (6.6%) |
| 1 or 2 Children | 129 (3.7%) | 155 (7.6%) |
| 3 or 4 Children | 49 (8.3%) | 43 (22.6%) |
| 5 or more Children | 0 (0.0%) | 18 (100.0%) |
| Total | 510 (5.3%) | 343 (8.2%) |
Employment Characteristics in Methuen Town
Employment by Class of Employer in Methuen Town
Among the 27,011 employed individuals in Methuen Town, private company employees (19,020 | 70.4%), not-for-profit organizations (2,868 | 10.6%), and local government employees (1,724 | 6.4%) make up the most common classes of employment.
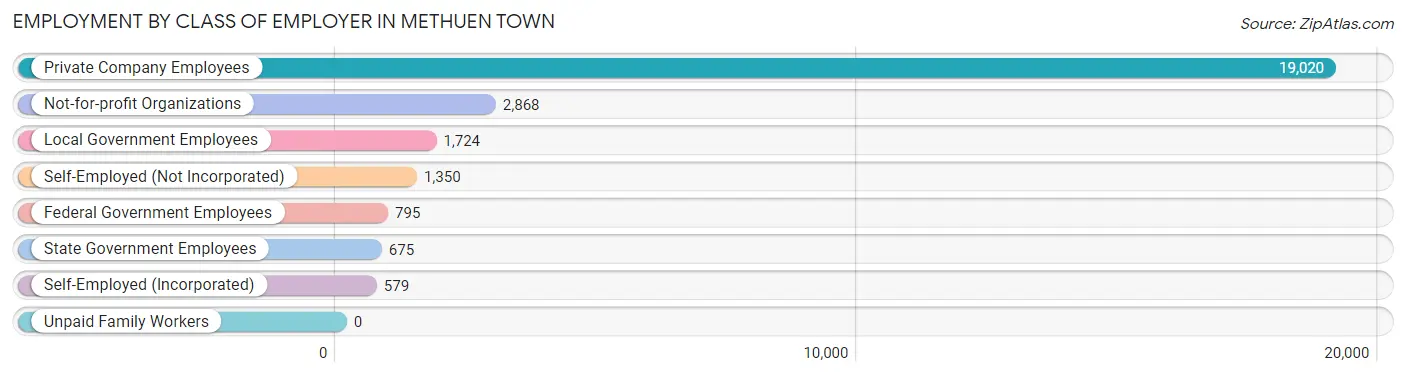
| Employer Class | # Employees | % Employees |
| Private Company Employees | 19,020 | 70.4% |
| Self-Employed (Incorporated) | 579 | 2.1% |
| Self-Employed (Not Incorporated) | 1,350 | 5.0% |
| Not-for-profit Organizations | 2,868 | 10.6% |
| Local Government Employees | 1,724 | 6.4% |
| State Government Employees | 675 | 2.5% |
| Federal Government Employees | 795 | 2.9% |
| Unpaid Family Workers | 0 | 0.0% |
| Total | 27,011 | 100.0% |
Employment Status by Age in Methuen Town
According to the labor force statistics for Methuen Town, out of the total population over 16 years of age (43,555), 67.9% or 29,574 individuals are in the labor force, with 6.4% or 1,893 of them unemployed. The age group with the highest labor force participation rate is 25 to 29 years, with 90.0% or 3,069 individuals in the labor force. Within the labor force, the 16 to 19 years age range has the highest percentage of unemployed individuals, with 14.2% or 272 of them being unemployed.
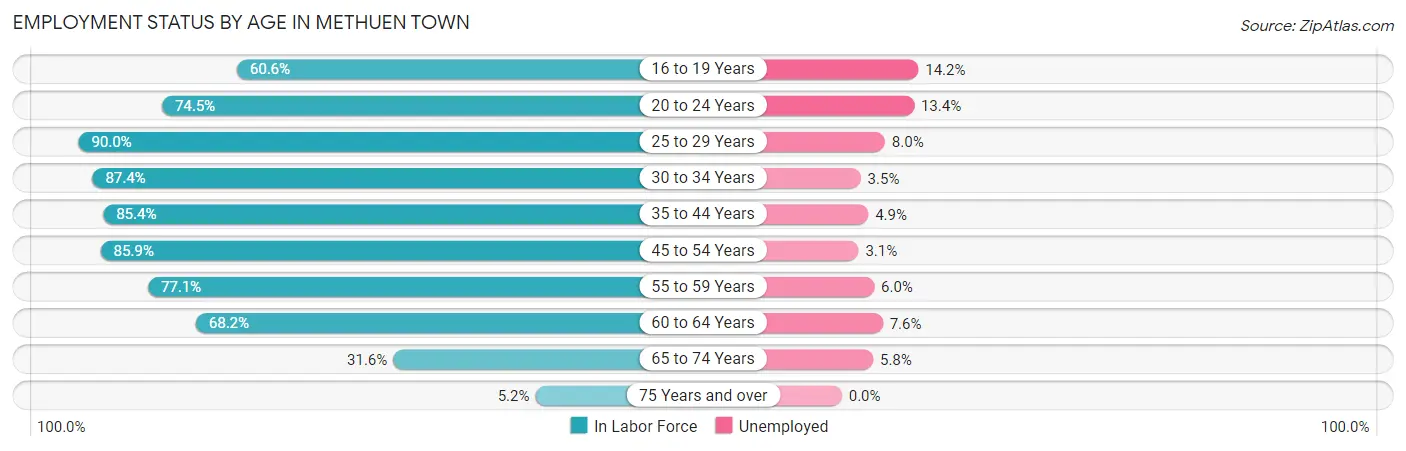
| Age Bracket | In Labor Force | Unemployed |
| 16 to 19 Years | 1,914 (60.6%) | 272 (14.2%) |
| 20 to 24 Years | 2,630 (74.5%) | 352 (13.4%) |
| 25 to 29 Years | 3,069 (90.0%) | 246 (8.0%) |
| 30 to 34 Years | 2,608 (87.4%) | 91 (3.5%) |
| 35 to 44 Years | 6,174 (85.4%) | 303 (4.9%) |
| 45 to 54 Years | 6,373 (85.9%) | 198 (3.1%) |
| 55 to 59 Years | 2,864 (77.1%) | 172 (6.0%) |
| 60 to 64 Years | 2,063 (68.2%) | 157 (7.6%) |
| 65 to 74 Years | 1,710 (31.6%) | 99 (5.8%) |
| 75 Years and over | 191 (5.2%) | 0 (0.0%) |
| Total | 29,574 (67.9%) | 1,893 (6.4%) |
Employment Status by Educational Attainment in Methuen Town
According to labor force statistics for Methuen Town, 83.3% of individuals (23,142) out of the total population between 25 and 64 years of age (27,782) are in the labor force, with 5.0% or 1,157 of them being unemployed. The group with the highest labor force participation rate are those with the educational attainment of bachelor's degree or higher, with 90.6% or 8,079 individuals in the labor force. Within the labor force, individuals with less than high school education have the highest percentage of unemployment, with 7.5% or 110 of them being unemployed.
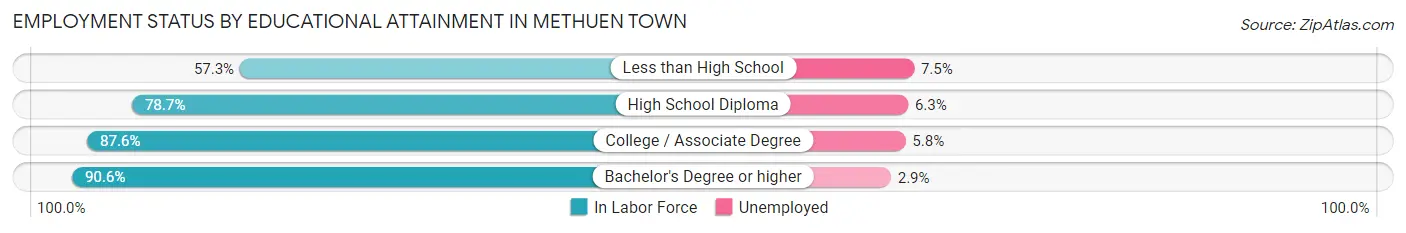
| Educational Attainment | In Labor Force | Unemployed |
| Less than High School | 1,461 (57.3%) | 191 (7.5%) |
| High School Diploma | 6,056 (78.7%) | 485 (6.3%) |
| College / Associate Degree | 7,551 (87.6%) | 500 (5.8%) |
| Bachelor's Degree or higher | 8,079 (90.6%) | 259 (2.9%) |
| Total | 23,142 (83.3%) | 1,389 (5.0%) |
Employment Occupations by Sex in Methuen Town
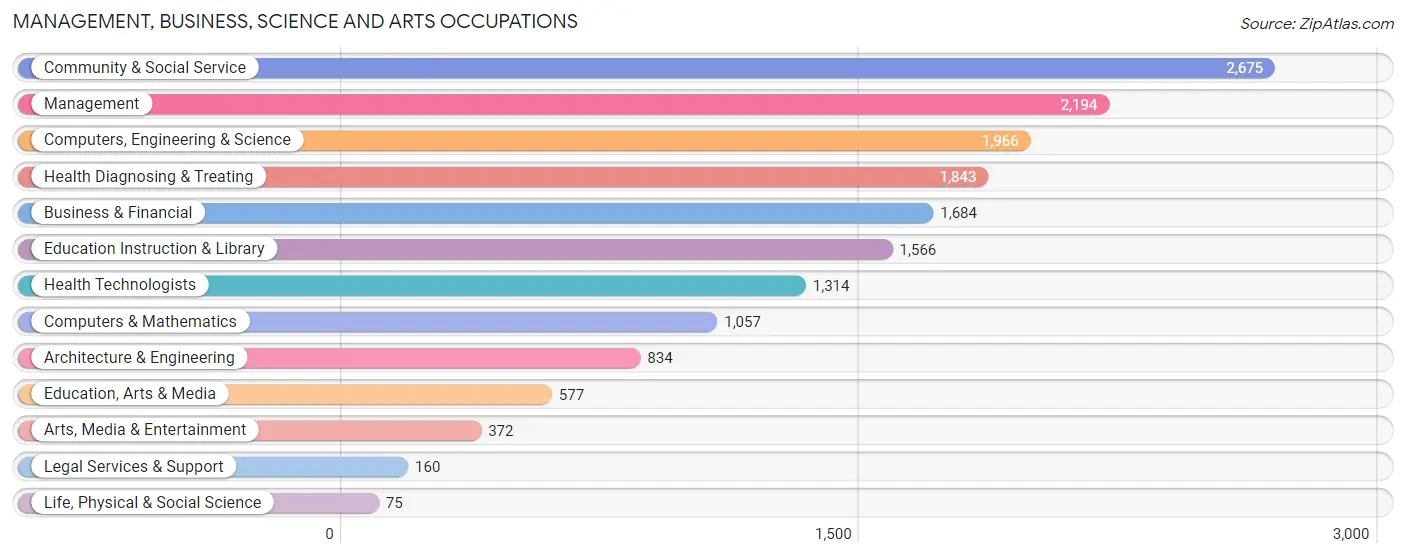
Management, Business, Science and Arts Occupations
The most common Management, Business, Science and Arts occupations in Methuen Town are Community & Social Service (2,675 | 9.7%), Management (2,194 | 7.9%), Computers, Engineering & Science (1,966 | 7.1%), Health Diagnosing & Treating (1,843 | 6.7%), and Business & Financial (1,684 | 6.1%).
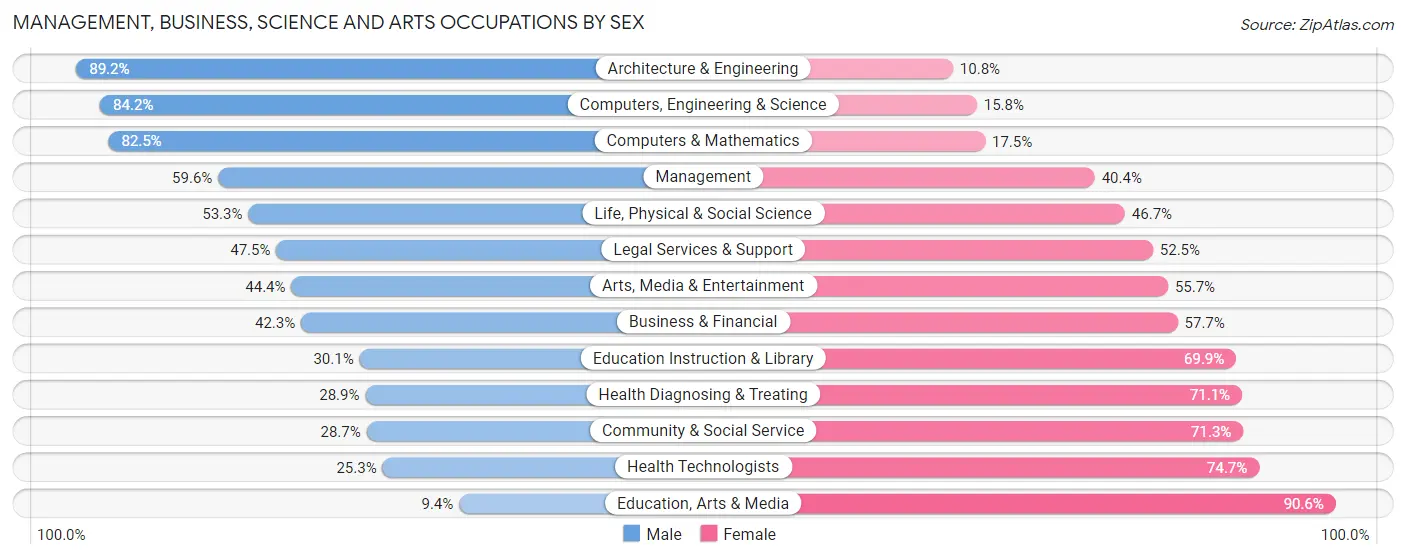
Management, Business, Science and Arts Occupations by Sex
Within the Management, Business, Science and Arts occupations in Methuen Town, the most male-oriented occupations are Architecture & Engineering (89.2%), Computers, Engineering & Science (84.2%), and Computers & Mathematics (82.5%), while the most female-oriented occupations are Education, Arts & Media (90.6%), Health Technologists (74.7%), and Community & Social Service (71.3%).
| Occupation | Male | Female |
| Management | 1,308 (59.6%) | 886 (40.4%) |
| Business & Financial | 713 (42.3%) | 971 (57.7%) |
| Computers, Engineering & Science | 1,656 (84.2%) | 310 (15.8%) |
| Computers & Mathematics | 872 (82.5%) | 185 (17.5%) |
| Architecture & Engineering | 744 (89.2%) | 90 (10.8%) |
| Life, Physical & Social Science | 40 (53.3%) | 35 (46.7%) |
| Community & Social Service | 767 (28.7%) | 1,908 (71.3%) |
| Education, Arts & Media | 54 (9.4%) | 523 (90.6%) |
| Legal Services & Support | 76 (47.5%) | 84 (52.5%) |
| Education Instruction & Library | 472 (30.1%) | 1,094 (69.9%) |
| Arts, Media & Entertainment | 165 (44.4%) | 207 (55.6%) |
| Health Diagnosing & Treating | 533 (28.9%) | 1,310 (71.1%) |
| Health Technologists | 333 (25.3%) | 981 (74.7%) |
| Total (Category) | 4,977 (48.0%) | 5,385 (52.0%) |
| Total (Overall) | 14,066 (50.8%) | 13,645 (49.2%) |
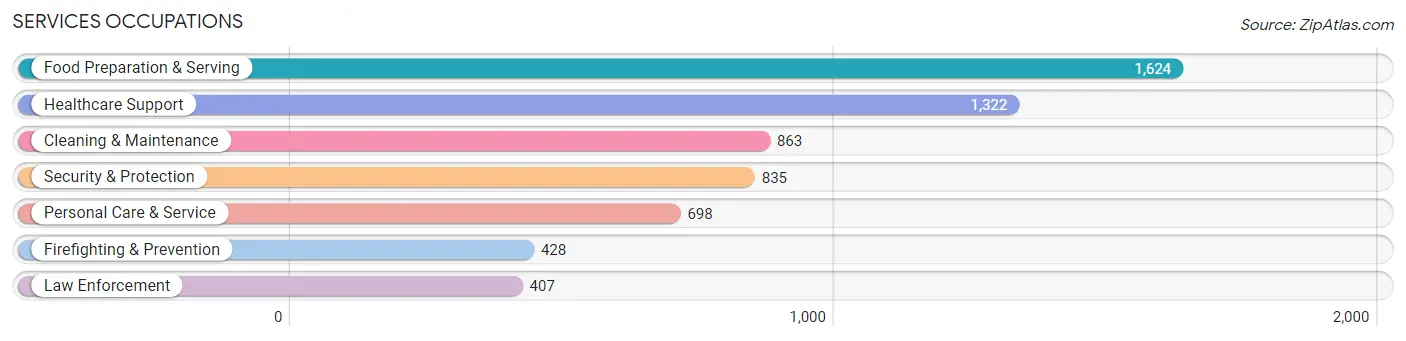
Services Occupations
The most common Services occupations in Methuen Town are Food Preparation & Serving (1,624 | 5.9%), Healthcare Support (1,322 | 4.8%), Cleaning & Maintenance (863 | 3.1%), Security & Protection (835 | 3.0%), and Personal Care & Service (698 | 2.5%).
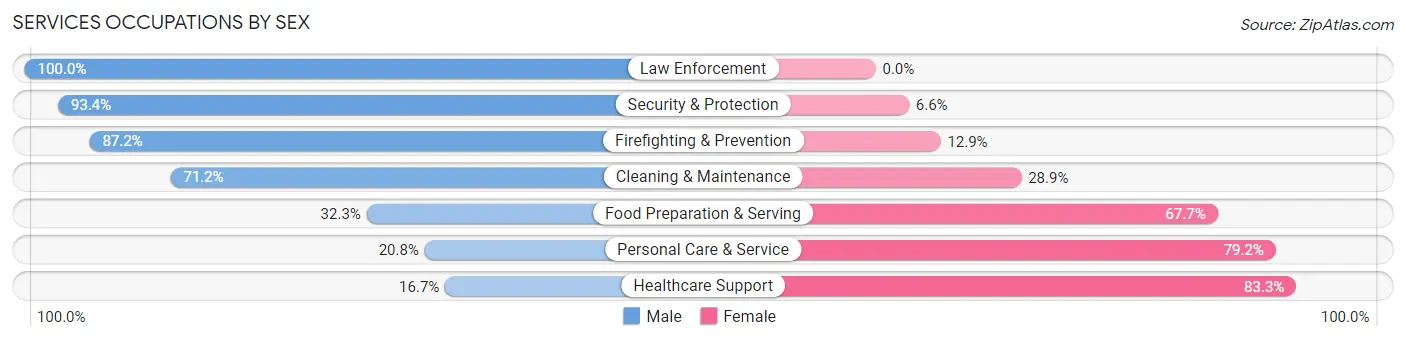
Services Occupations by Sex
Within the Services occupations in Methuen Town, the most male-oriented occupations are Law Enforcement (100.0%), Security & Protection (93.4%), and Firefighting & Prevention (87.2%), while the most female-oriented occupations are Healthcare Support (83.3%), Personal Care & Service (79.2%), and Food Preparation & Serving (67.7%).
| Occupation | Male | Female |
| Healthcare Support | 221 (16.7%) | 1,101 (83.3%) |
| Security & Protection | 780 (93.4%) | 55 (6.6%) |
| Firefighting & Prevention | 373 (87.2%) | 55 (12.9%) |
| Law Enforcement | 407 (100.0%) | 0 (0.0%) |
| Food Preparation & Serving | 524 (32.3%) | 1,100 (67.7%) |
| Cleaning & Maintenance | 614 (71.2%) | 249 (28.8%) |
| Personal Care & Service | 145 (20.8%) | 553 (79.2%) |
| Total (Category) | 2,284 (42.8%) | 3,058 (57.2%) |
| Total (Overall) | 14,066 (50.8%) | 13,645 (49.2%) |
Sales and Office Occupations
The most common Sales and Office occupations in Methuen Town are Office & Administration (3,232 | 11.7%), and Sales & Related (2,657 | 9.6%).

Sales and Office Occupations by Sex
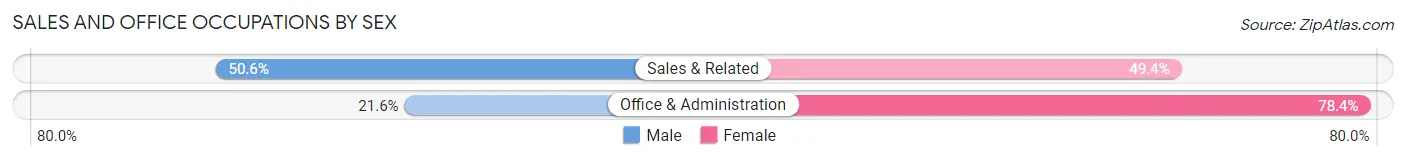
| Occupation | Male | Female |
| Sales & Related | 1,345 (50.6%) | 1,312 (49.4%) |
| Office & Administration | 697 (21.6%) | 2,535 (78.4%) |
| Total (Category) | 2,042 (34.7%) | 3,847 (65.3%) |
| Total (Overall) | 14,066 (50.8%) | 13,645 (49.2%) |
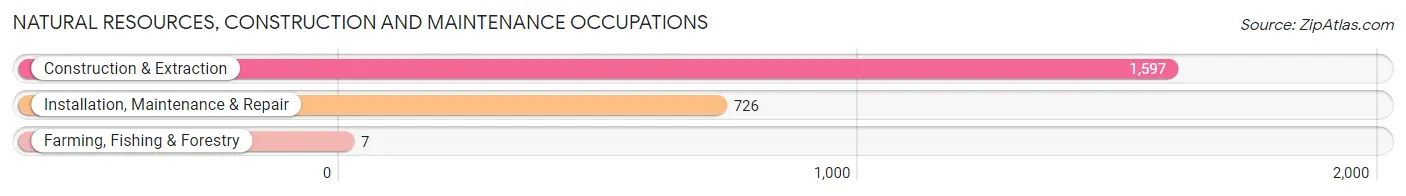
Natural Resources, Construction and Maintenance Occupations
The most common Natural Resources, Construction and Maintenance occupations in Methuen Town are Construction & Extraction (1,597 | 5.8%), Installation, Maintenance & Repair (726 | 2.6%), and Farming, Fishing & Forestry (7 | 0.0%).
Natural Resources, Construction and Maintenance Occupations by Sex
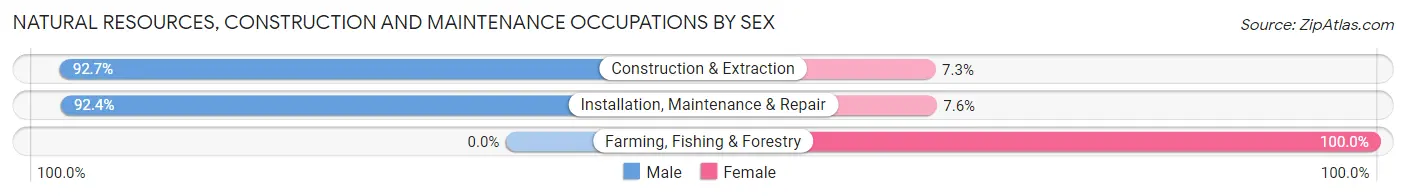
| Occupation | Male | Female |
| Farming, Fishing & Forestry | 0 (0.0%) | 7 (100.0%) |
| Construction & Extraction | 1,480 (92.7%) | 117 (7.3%) |
| Installation, Maintenance & Repair | 671 (92.4%) | 55 (7.6%) |
| Total (Category) | 2,151 (92.3%) | 179 (7.7%) |
| Total (Overall) | 14,066 (50.8%) | 13,645 (49.2%) |
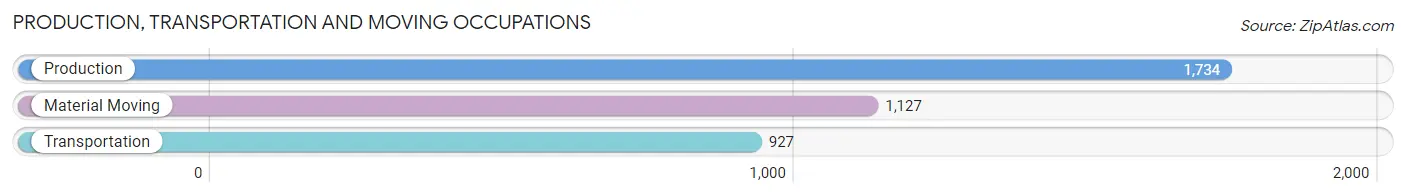
Production, Transportation and Moving Occupations
The most common Production, Transportation and Moving occupations in Methuen Town are Production (1,734 | 6.3%), Material Moving (1,127 | 4.1%), and Transportation (927 | 3.4%).
Production, Transportation and Moving Occupations by Sex
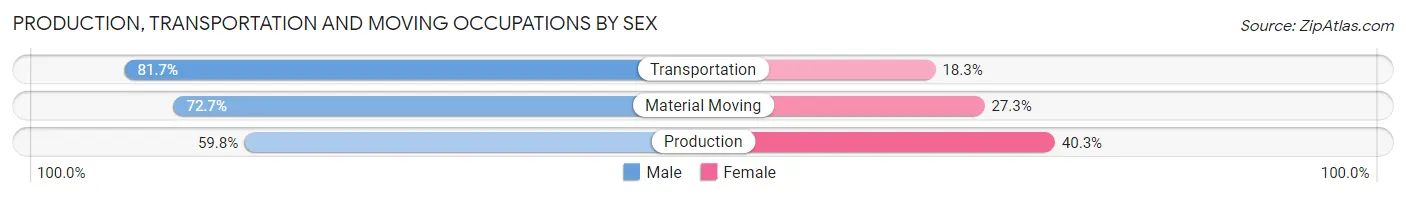
| Occupation | Male | Female |
| Production | 1,036 (59.8%) | 698 (40.3%) |
| Transportation | 757 (81.7%) | 170 (18.3%) |
| Material Moving | 819 (72.7%) | 308 (27.3%) |
| Total (Category) | 2,612 (69.0%) | 1,176 (31.0%) |
| Total (Overall) | 14,066 (50.8%) | 13,645 (49.2%) |
Employment Industries by Sex in Methuen Town
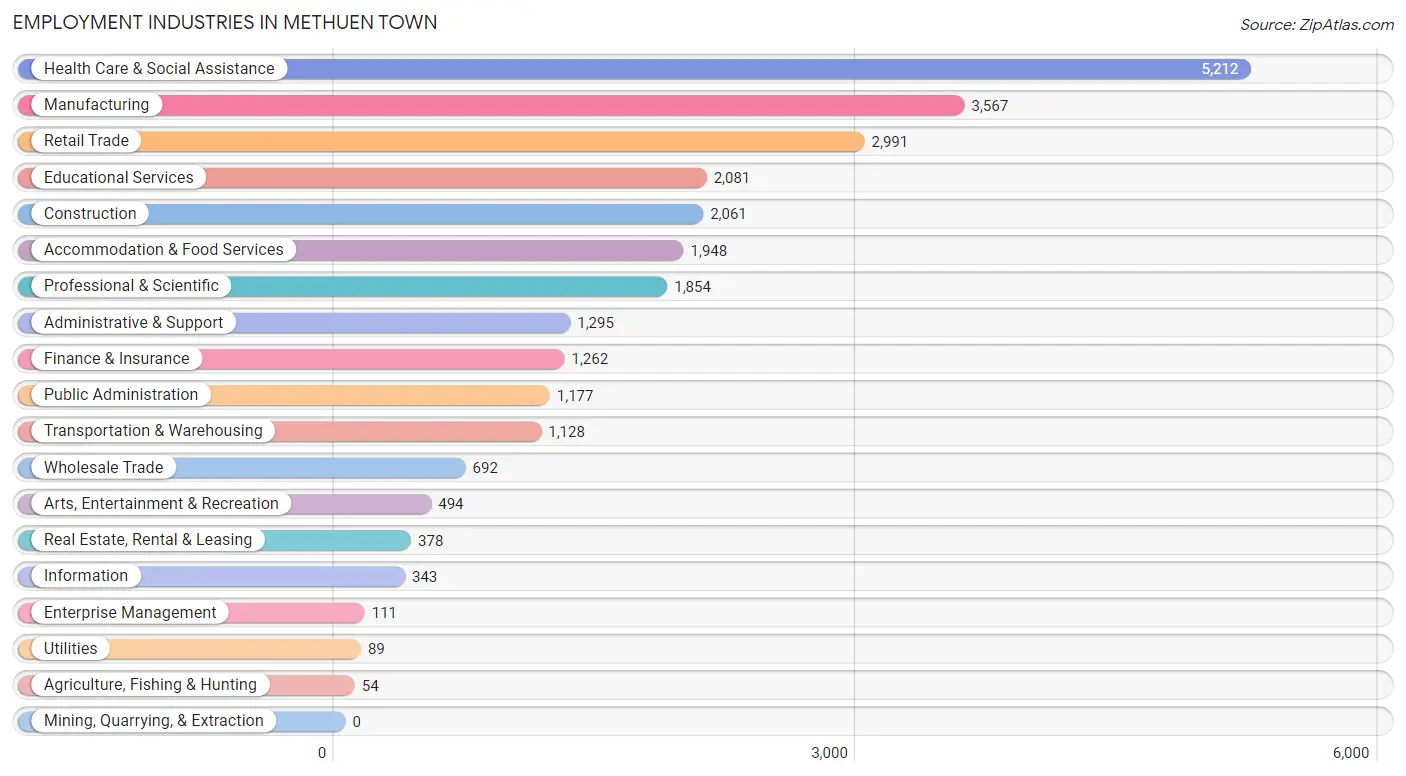
Employment Industries in Methuen Town
The major employment industries in Methuen Town include Health Care & Social Assistance (5,212 | 18.8%), Manufacturing (3,567 | 12.9%), Retail Trade (2,991 | 10.8%), Educational Services (2,081 | 7.5%), and Construction (2,061 | 7.4%).
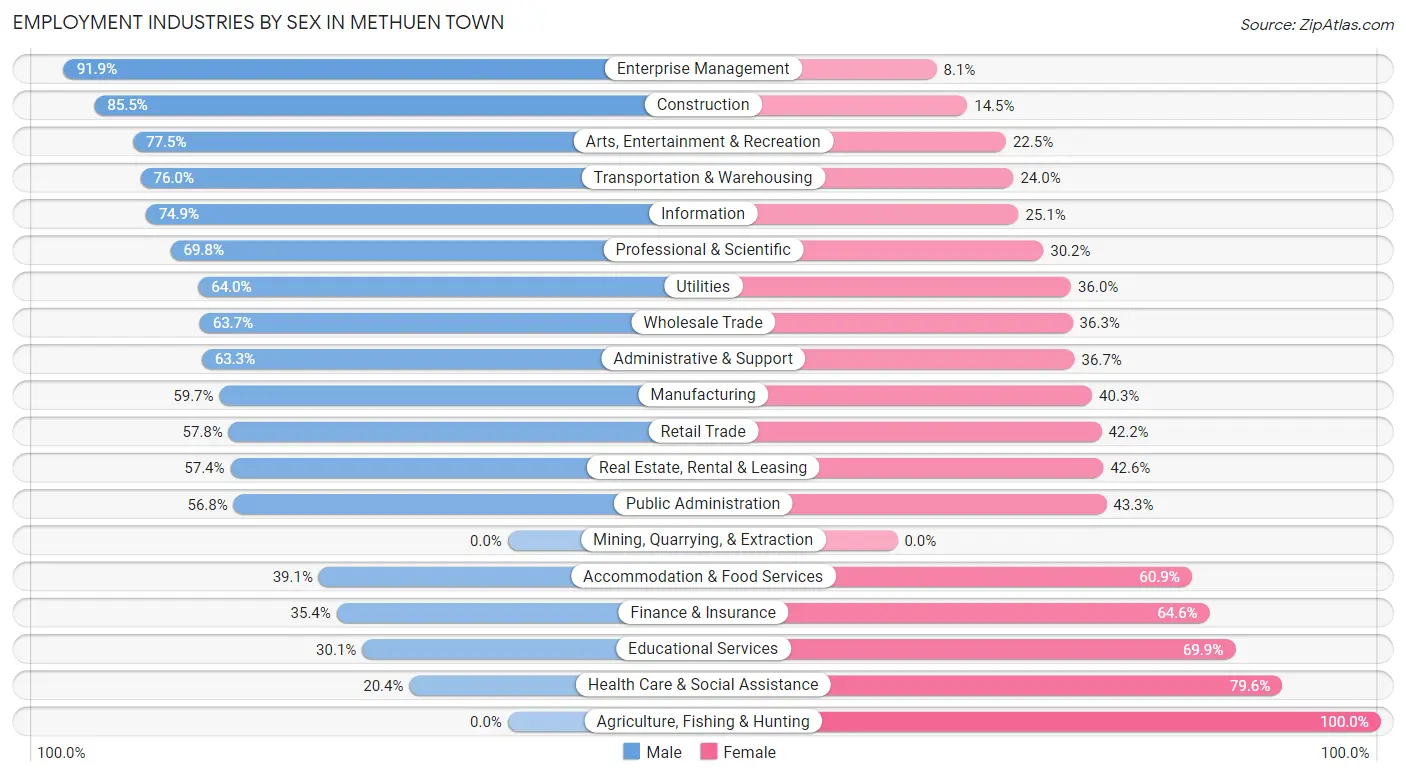
Employment Industries by Sex in Methuen Town
The Methuen Town industries that see more men than women are Enterprise Management (91.9%), Construction (85.5%), and Arts, Entertainment & Recreation (77.5%), whereas the industries that tend to have a higher number of women are Agriculture, Fishing & Hunting (100.0%), Health Care & Social Assistance (79.6%), and Educational Services (69.9%).
| Industry | Male | Female |
| Agriculture, Fishing & Hunting | 0 (0.0%) | 54 (100.0%) |
| Mining, Quarrying, & Extraction | 0 (0.0%) | 0 (0.0%) |
| Construction | 1,763 (85.5%) | 298 (14.5%) |
| Manufacturing | 2,129 (59.7%) | 1,438 (40.3%) |
| Wholesale Trade | 441 (63.7%) | 251 (36.3%) |
| Retail Trade | 1,728 (57.8%) | 1,263 (42.2%) |
| Transportation & Warehousing | 857 (76.0%) | 271 (24.0%) |
| Utilities | 57 (64.0%) | 32 (36.0%) |
| Information | 257 (74.9%) | 86 (25.1%) |
| Finance & Insurance | 447 (35.4%) | 815 (64.6%) |
| Real Estate, Rental & Leasing | 217 (57.4%) | 161 (42.6%) |
| Professional & Scientific | 1,294 (69.8%) | 560 (30.2%) |
| Enterprise Management | 102 (91.9%) | 9 (8.1%) |
| Administrative & Support | 820 (63.3%) | 475 (36.7%) |
| Educational Services | 627 (30.1%) | 1,454 (69.9%) |
| Health Care & Social Assistance | 1,062 (20.4%) | 4,150 (79.6%) |
| Arts, Entertainment & Recreation | 383 (77.5%) | 111 (22.5%) |
| Accommodation & Food Services | 762 (39.1%) | 1,186 (60.9%) |
| Public Administration | 668 (56.8%) | 509 (43.2%) |
| Total | 14,066 (50.8%) | 13,645 (49.2%) |
Education in Methuen Town
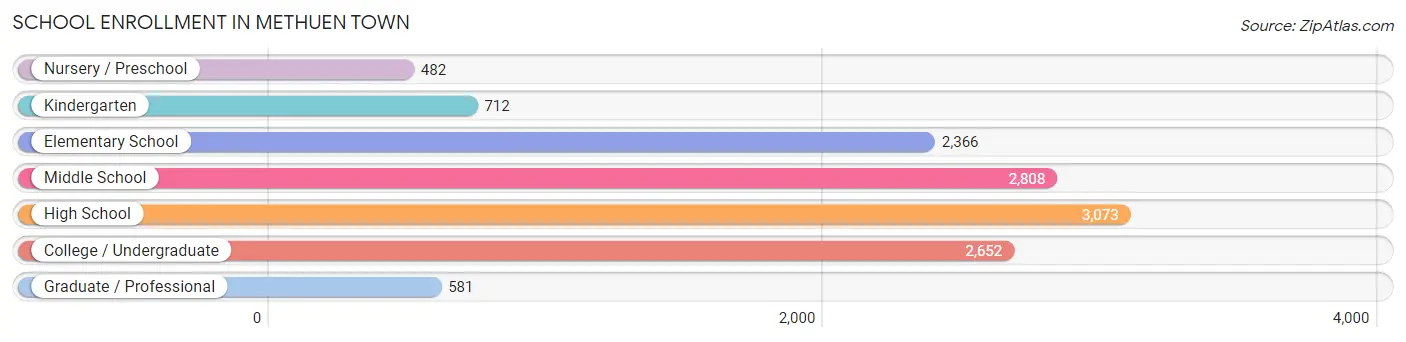
School Enrollment in Methuen Town
The most common levels of schooling among the 12,674 students in Methuen Town are high school (3,073 | 24.2%), middle school (2,808 | 22.2%), and college / undergraduate (2,652 | 20.9%).
| School Level | # Students | % Students |
| Nursery / Preschool | 482 | 3.8% |
| Kindergarten | 712 | 5.6% |
| Elementary School | 2,366 | 18.7% |
| Middle School | 2,808 | 22.2% |
| High School | 3,073 | 24.2% |
| College / Undergraduate | 2,652 | 20.9% |
| Graduate / Professional | 581 | 4.6% |
| Total | 12,674 | 100.0% |
School Enrollment by Age by Funding Source in Methuen Town
Out of a total of 12,674 students who are enrolled in schools in Methuen Town, 2,687 (21.2%) attend a private institution, while the remaining 9,987 (78.8%) are enrolled in public schools. The age group of 3 to 4 year olds has the highest likelihood of being enrolled in private schools, with 329 (66.7% in the age bracket) enrolled. Conversely, the age group of 15 to 17 year olds has the lowest likelihood of being enrolled in a private school, with 1,984 (87.8% in the age bracket) attending a public institution.
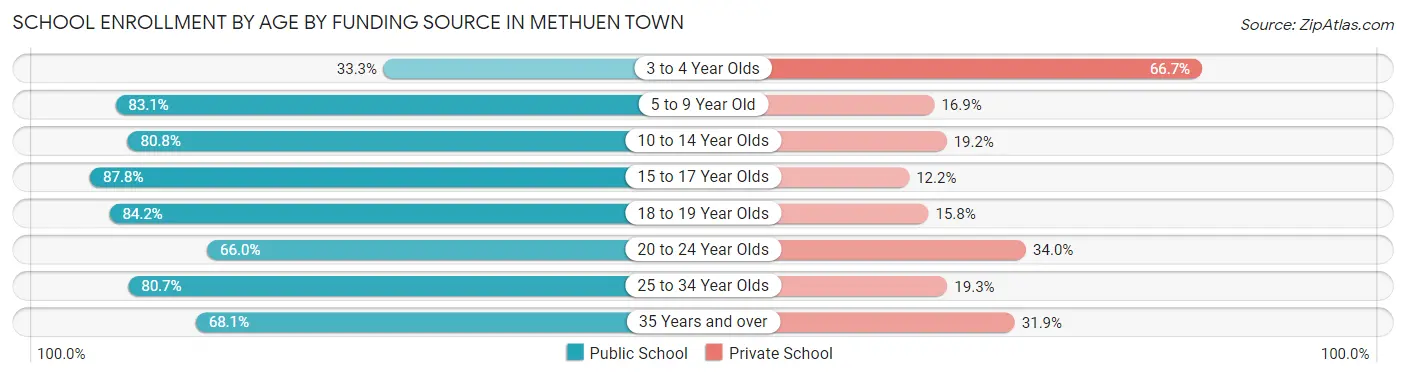
| Age Bracket | Public School | Private School |
| 3 to 4 Year Olds | 164 (33.3%) | 329 (66.7%) |
| 5 to 9 Year Old | 2,244 (83.1%) | 457 (16.9%) |
| 10 to 14 Year Olds | 2,805 (80.8%) | 666 (19.2%) |
| 15 to 17 Year Olds | 1,984 (87.8%) | 276 (12.2%) |
| 18 to 19 Year Olds | 889 (84.2%) | 167 (15.8%) |
| 20 to 24 Year Olds | 773 (66.0%) | 398 (34.0%) |
| 25 to 34 Year Olds | 593 (80.7%) | 142 (19.3%) |
| 35 Years and over | 536 (68.1%) | 251 (31.9%) |
| Total | 9,987 (78.8%) | 2,687 (21.2%) |
Educational Attainment by Field of Study in Methuen Town
Business (2,566 | 20.8%), engineering (1,186 | 9.6%), education (1,163 | 9.4%), science & technology (1,151 | 9.3%), and social sciences (905 | 7.3%) are the most common fields of study among 12,323 individuals in Methuen Town who have obtained a bachelor's degree or higher.
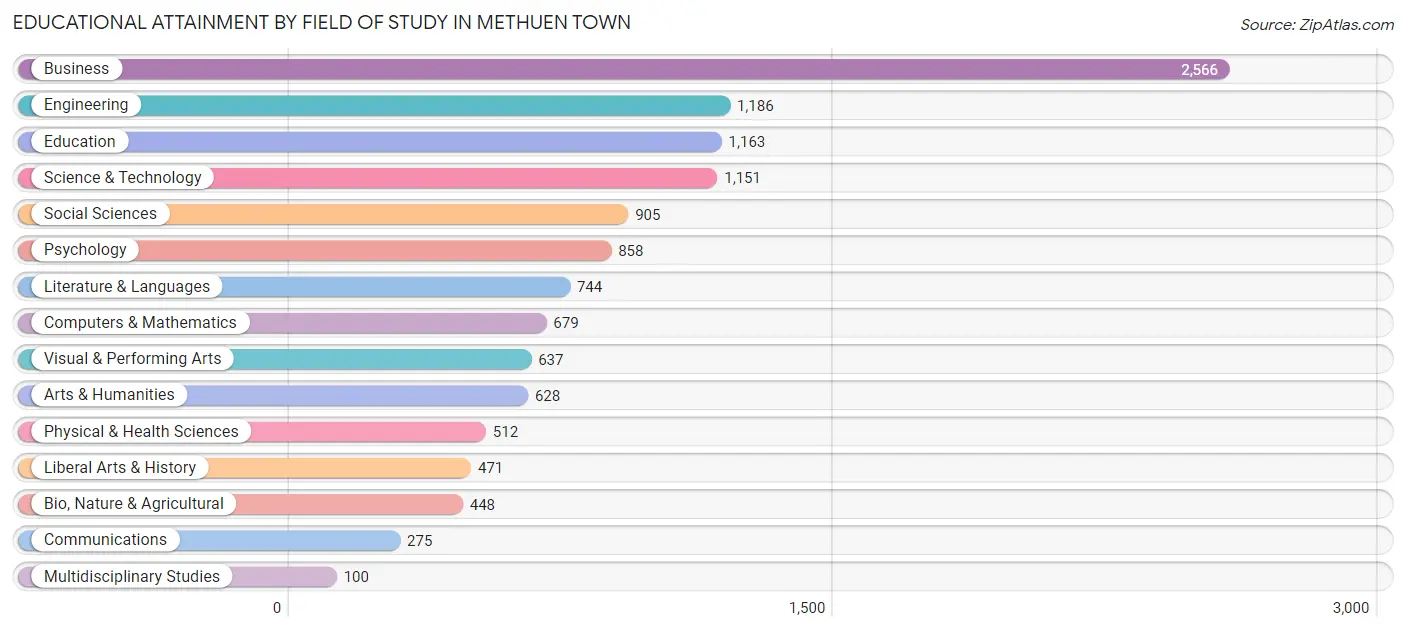
| Field of Study | # Graduates | % Graduates |
| Computers & Mathematics | 679 | 5.5% |
| Bio, Nature & Agricultural | 448 | 3.6% |
| Physical & Health Sciences | 512 | 4.2% |
| Psychology | 858 | 7.0% |
| Social Sciences | 905 | 7.3% |
| Engineering | 1,186 | 9.6% |
| Multidisciplinary Studies | 100 | 0.8% |
| Science & Technology | 1,151 | 9.3% |
| Business | 2,566 | 20.8% |
| Education | 1,163 | 9.4% |
| Literature & Languages | 744 | 6.0% |
| Liberal Arts & History | 471 | 3.8% |
| Visual & Performing Arts | 637 | 5.2% |
| Communications | 275 | 2.2% |
| Arts & Humanities | 628 | 5.1% |
| Total | 12,323 | 100.0% |
Transportation & Commute in Methuen Town
Vehicle Availability by Sex in Methuen Town
The most prevalent vehicle ownership categories in Methuen Town are males with 2 vehicles (5,515, accounting for 40.5%) and females with 2 vehicles (5,038, making up 41.3%).
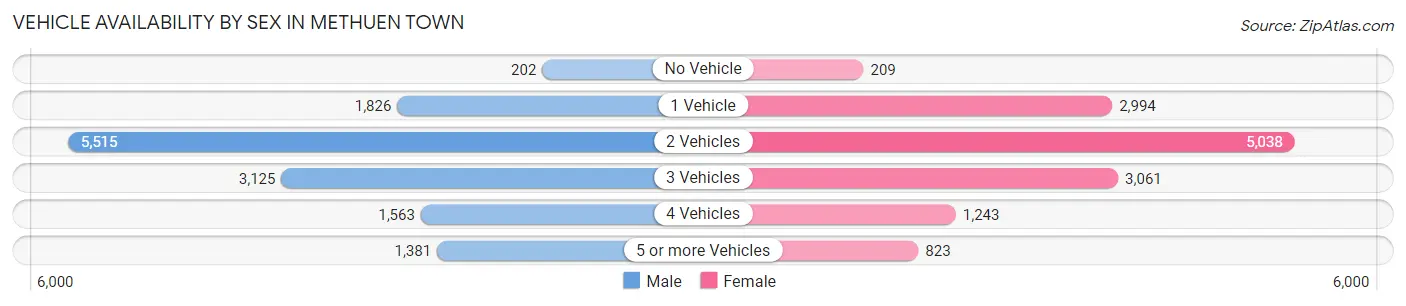
| Vehicles Available | Male | Female |
| No Vehicle | 202 (1.5%) | 209 (1.6%) |
| 1 Vehicle | 1,826 (13.4%) | 2,994 (22.4%) |
| 2 Vehicles | 5,515 (40.5%) | 5,038 (37.7%) |
| 3 Vehicles | 3,125 (23.0%) | 3,061 (22.9%) |
| 4 Vehicles | 1,563 (11.5%) | 1,243 (9.3%) |
| 5 or more Vehicles | 1,381 (10.2%) | 823 (6.2%) |
| Total | 13,612 (100.0%) | 13,368 (100.0%) |
Commute Time in Methuen Town
The most frequently occuring commute durations in Methuen Town are 15 to 19 minutes (3,998 commuters, 16.5%), 10 to 14 minutes (3,924 commuters, 16.1%), and 20 to 24 minutes (3,427 commuters, 14.1%).
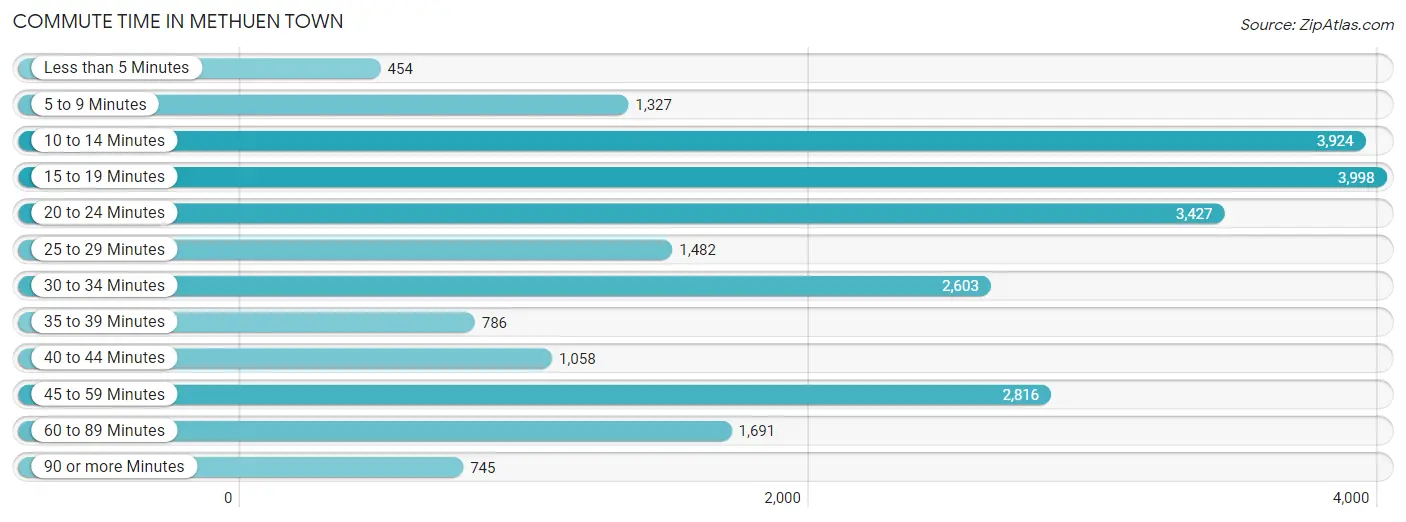
| Commute Time | # Commuters | % Commuters |
| Less than 5 Minutes | 454 | 1.9% |
| 5 to 9 Minutes | 1,327 | 5.5% |
| 10 to 14 Minutes | 3,924 | 16.1% |
| 15 to 19 Minutes | 3,998 | 16.5% |
| 20 to 24 Minutes | 3,427 | 14.1% |
| 25 to 29 Minutes | 1,482 | 6.1% |
| 30 to 34 Minutes | 2,603 | 10.7% |
| 35 to 39 Minutes | 786 | 3.2% |
| 40 to 44 Minutes | 1,058 | 4.3% |
| 45 to 59 Minutes | 2,816 | 11.6% |
| 60 to 89 Minutes | 1,691 | 7.0% |
| 90 or more Minutes | 745 | 3.1% |
Commute Time by Sex in Methuen Town
The most common commute times in Methuen Town are 15 to 19 minutes (1,918 commuters, 15.1%) for males and 10 to 14 minutes (2,357 commuters, 20.3%) for females.
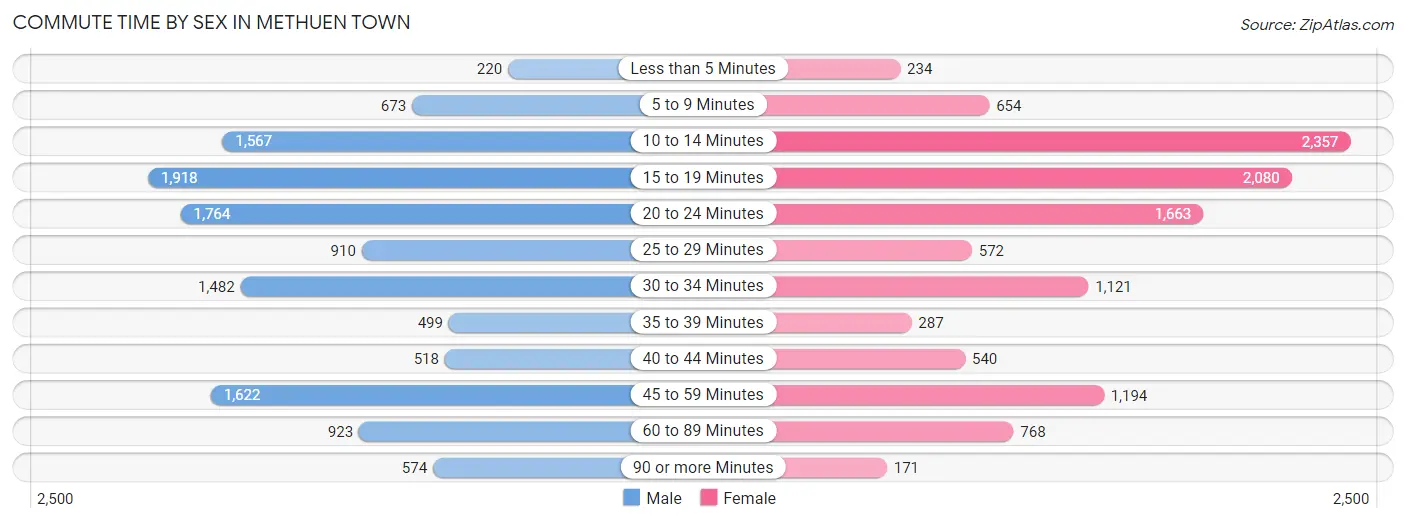
| Commute Time | Male | Female |
| Less than 5 Minutes | 220 (1.7%) | 234 (2.0%) |
| 5 to 9 Minutes | 673 (5.3%) | 654 (5.6%) |
| 10 to 14 Minutes | 1,567 (12.4%) | 2,357 (20.3%) |
| 15 to 19 Minutes | 1,918 (15.1%) | 2,080 (17.9%) |
| 20 to 24 Minutes | 1,764 (13.9%) | 1,663 (14.3%) |
| 25 to 29 Minutes | 910 (7.2%) | 572 (4.9%) |
| 30 to 34 Minutes | 1,482 (11.7%) | 1,121 (9.6%) |
| 35 to 39 Minutes | 499 (3.9%) | 287 (2.5%) |
| 40 to 44 Minutes | 518 (4.1%) | 540 (4.6%) |
| 45 to 59 Minutes | 1,622 (12.8%) | 1,194 (10.3%) |
| 60 to 89 Minutes | 923 (7.3%) | 768 (6.6%) |
| 90 or more Minutes | 574 (4.5%) | 171 (1.5%) |
Time of Departure to Work by Sex in Methuen Town
The most frequent times of departure to work in Methuen Town are 7:00 AM to 7:29 AM (1,655, 13.1%) for males and 7:00 AM to 7:29 AM (1,790, 15.4%) for females.
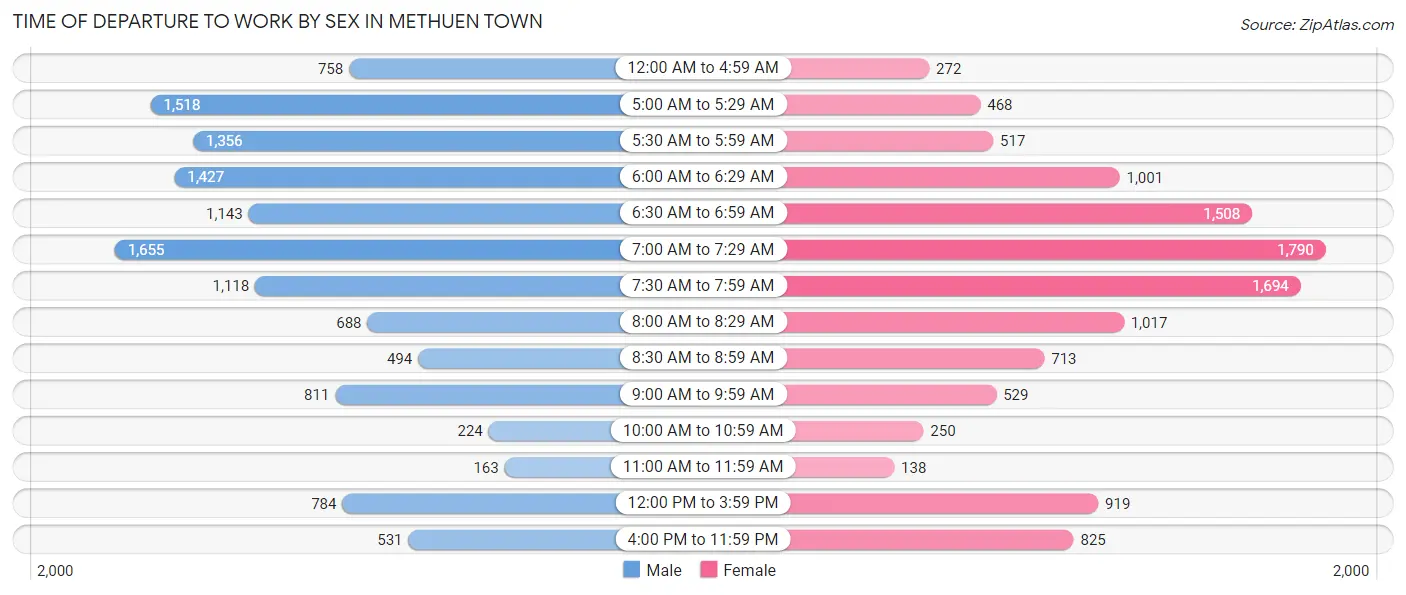
| Time of Departure | Male | Female |
| 12:00 AM to 4:59 AM | 758 (6.0%) | 272 (2.3%) |
| 5:00 AM to 5:29 AM | 1,518 (12.0%) | 468 (4.0%) |
| 5:30 AM to 5:59 AM | 1,356 (10.7%) | 517 (4.4%) |
| 6:00 AM to 6:29 AM | 1,427 (11.3%) | 1,001 (8.6%) |
| 6:30 AM to 6:59 AM | 1,143 (9.0%) | 1,508 (13.0%) |
| 7:00 AM to 7:29 AM | 1,655 (13.1%) | 1,790 (15.4%) |
| 7:30 AM to 7:59 AM | 1,118 (8.8%) | 1,694 (14.5%) |
| 8:00 AM to 8:29 AM | 688 (5.4%) | 1,017 (8.7%) |
| 8:30 AM to 8:59 AM | 494 (3.9%) | 713 (6.1%) |
| 9:00 AM to 9:59 AM | 811 (6.4%) | 529 (4.5%) |
| 10:00 AM to 10:59 AM | 224 (1.8%) | 250 (2.1%) |
| 11:00 AM to 11:59 AM | 163 (1.3%) | 138 (1.2%) |
| 12:00 PM to 3:59 PM | 784 (6.2%) | 919 (7.9%) |
| 4:00 PM to 11:59 PM | 531 (4.2%) | 825 (7.1%) |
| Total | 12,670 (100.0%) | 11,641 (100.0%) |
Housing Occupancy in Methuen Town
Occupancy by Ownership in Methuen Town
Of the total 19,043 dwellings in Methuen Town, owner-occupied units account for 14,092 (74.0%), while renter-occupied units make up 4,951 (26.0%).
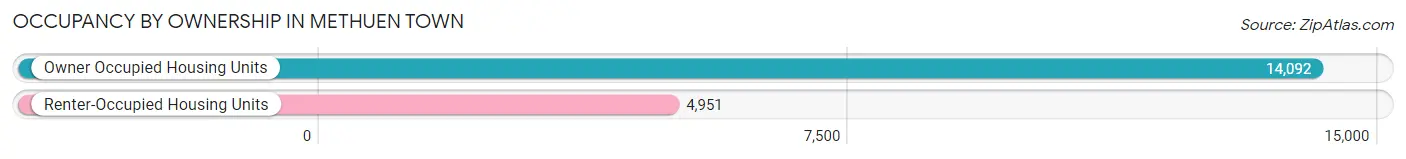
| Occupancy | # Housing Units | % Housing Units |
| Owner Occupied Housing Units | 14,092 | 74.0% |
| Renter-Occupied Housing Units | 4,951 | 26.0% |
| Total Occupied Housing Units | 19,043 | 100.0% |
Occupancy by Household Size in Methuen Town
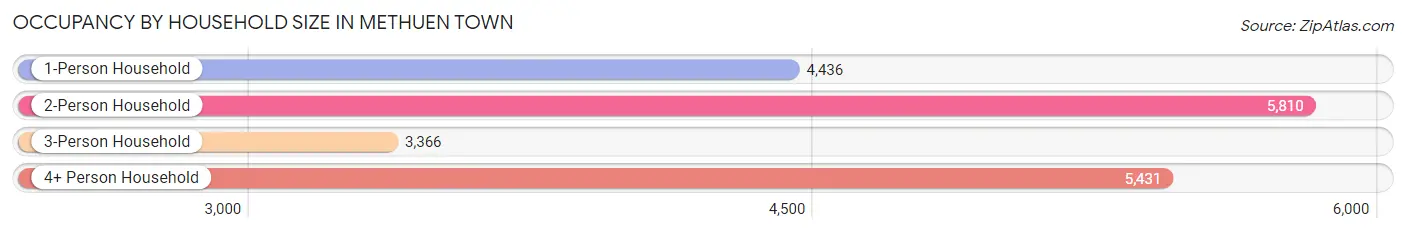
| Household Size | # Housing Units | % Housing Units |
| 1-Person Household | 4,436 | 23.3% |
| 2-Person Household | 5,810 | 30.5% |
| 3-Person Household | 3,366 | 17.7% |
| 4+ Person Household | 5,431 | 28.5% |
| Total Housing Units | 19,043 | 100.0% |
Occupancy by Ownership by Household Size in Methuen Town
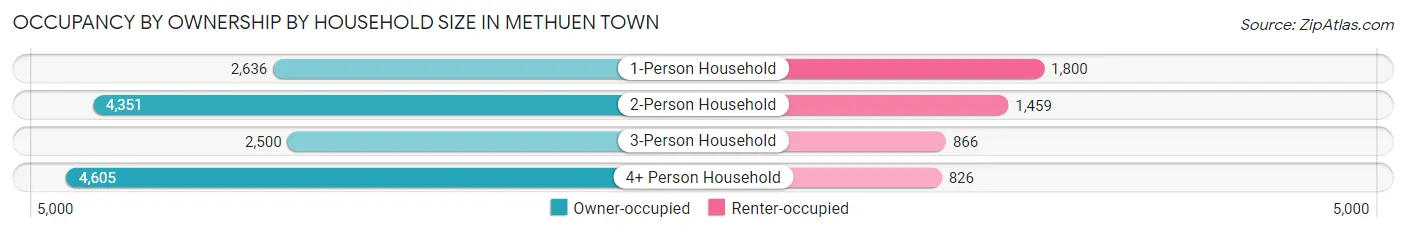
| Household Size | Owner-occupied | Renter-occupied |
| 1-Person Household | 2,636 (59.4%) | 1,800 (40.6%) |
| 2-Person Household | 4,351 (74.9%) | 1,459 (25.1%) |
| 3-Person Household | 2,500 (74.3%) | 866 (25.7%) |
| 4+ Person Household | 4,605 (84.8%) | 826 (15.2%) |
| Total Housing Units | 14,092 (74.0%) | 4,951 (26.0%) |
Occupancy by Educational Attainment in Methuen Town
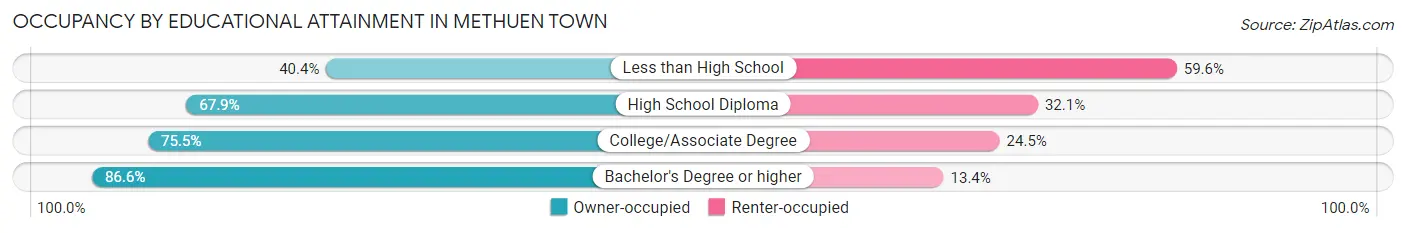
| Household Size | Owner-occupied | Renter-occupied |
| Less than High School | 675 (40.4%) | 996 (59.6%) |
| High School Diploma | 3,567 (67.9%) | 1,685 (32.1%) |
| College/Associate Degree | 4,414 (75.5%) | 1,431 (24.5%) |
| Bachelor's Degree or higher | 5,436 (86.6%) | 839 (13.4%) |
Occupancy by Age of Householder in Methuen Town
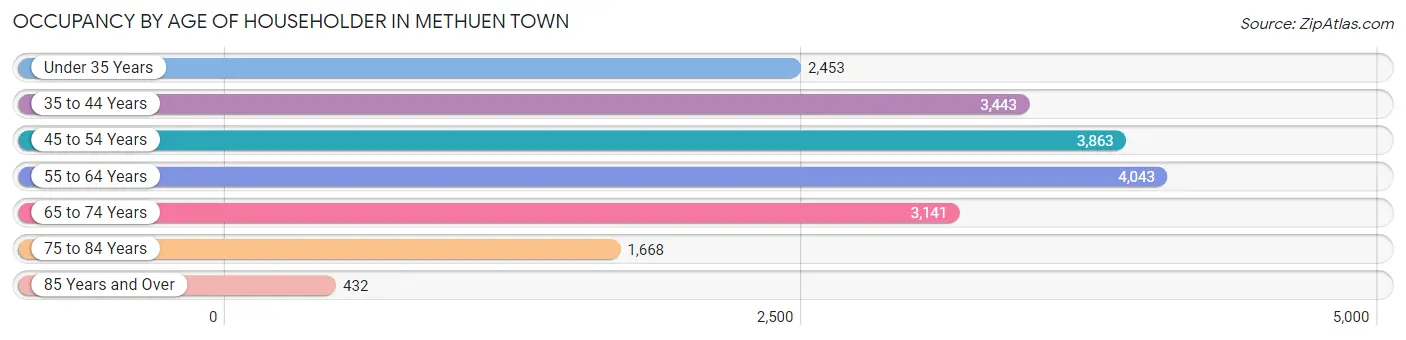
| Age Bracket | # Households | % Households |
| Under 35 Years | 2,453 | 12.9% |
| 35 to 44 Years | 3,443 | 18.1% |
| 45 to 54 Years | 3,863 | 20.3% |
| 55 to 64 Years | 4,043 | 21.2% |
| 65 to 74 Years | 3,141 | 16.5% |
| 75 to 84 Years | 1,668 | 8.8% |
| 85 Years and Over | 432 | 2.3% |
| Total | 19,043 | 100.0% |
Housing Finances in Methuen Town
Median Income by Occupancy in Methuen Town
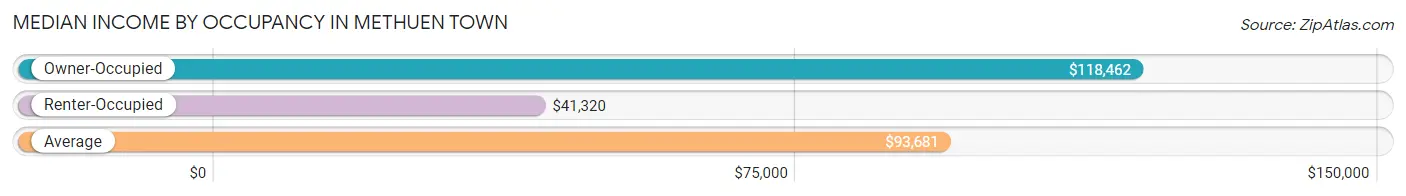
| Occupancy Type | # Households | Median Income |
| Owner-Occupied | 14,092 (74.0%) | $118,462 |
| Renter-Occupied | 4,951 (26.0%) | $41,320 |
| Average | 19,043 (100.0%) | $93,681 |
Occupancy by Householder Income Bracket in Methuen Town
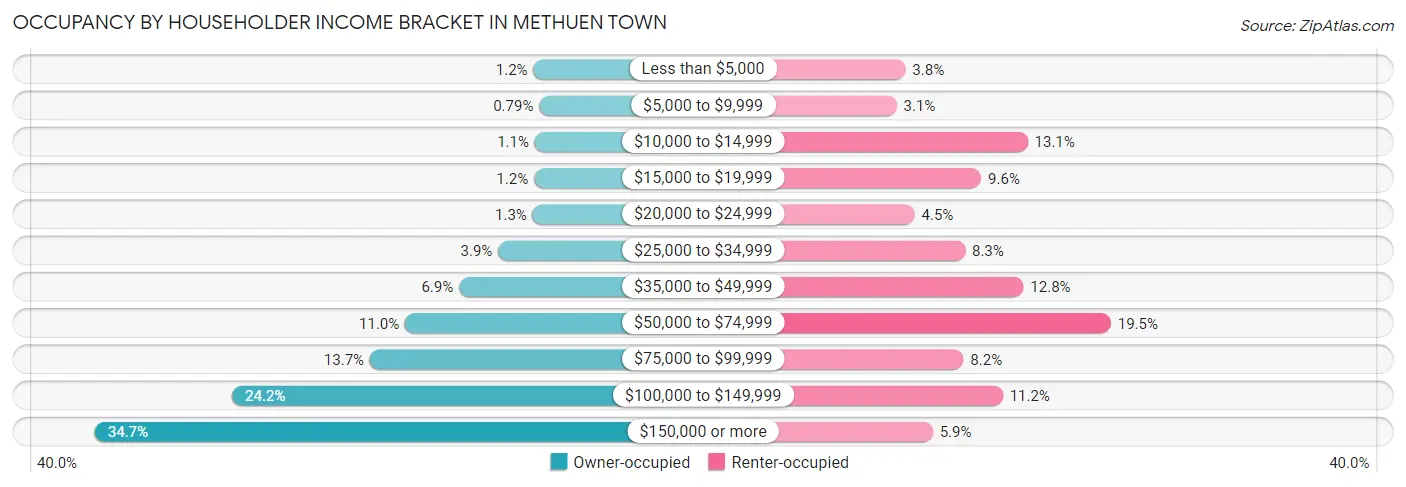
| Income Bracket | Owner-occupied | Renter-occupied |
| Less than $5,000 | 174 (1.2%) | 188 (3.8%) |
| $5,000 to $9,999 | 111 (0.8%) | 155 (3.1%) |
| $10,000 to $14,999 | 159 (1.1%) | 649 (13.1%) |
| $15,000 to $19,999 | 168 (1.2%) | 474 (9.6%) |
| $20,000 to $24,999 | 182 (1.3%) | 223 (4.5%) |
| $25,000 to $34,999 | 552 (3.9%) | 413 (8.3%) |
| $35,000 to $49,999 | 973 (6.9%) | 633 (12.8%) |
| $50,000 to $74,999 | 1,552 (11.0%) | 963 (19.5%) |
| $75,000 to $99,999 | 1,929 (13.7%) | 407 (8.2%) |
| $100,000 to $149,999 | 3,409 (24.2%) | 555 (11.2%) |
| $150,000 or more | 4,883 (34.6%) | 291 (5.9%) |
| Total | 14,092 (100.0%) | 4,951 (100.0%) |
Monthly Housing Cost Tiers in Methuen Town
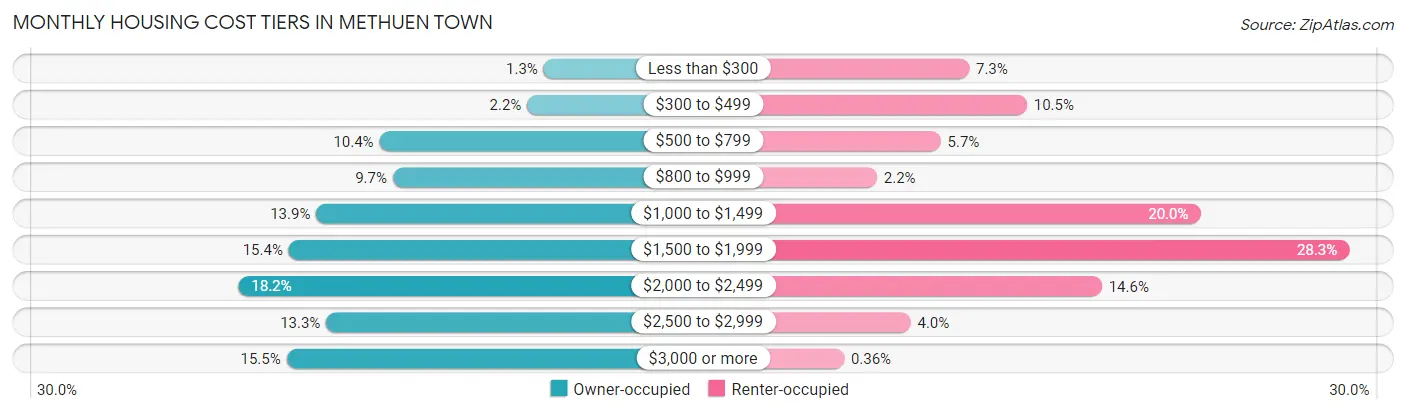
| Monthly Cost | Owner-occupied | Renter-occupied |
| Less than $300 | 188 (1.3%) | 360 (7.3%) |
| $300 to $499 | 316 (2.2%) | 518 (10.5%) |
| $500 to $799 | 1,466 (10.4%) | 282 (5.7%) |
| $800 to $999 | 1,361 (9.7%) | 108 (2.2%) |
| $1,000 to $1,499 | 1,958 (13.9%) | 992 (20.0%) |
| $1,500 to $1,999 | 2,171 (15.4%) | 1,399 (28.3%) |
| $2,000 to $2,499 | 2,564 (18.2%) | 723 (14.6%) |
| $2,500 to $2,999 | 1,880 (13.3%) | 200 (4.0%) |
| $3,000 or more | 2,188 (15.5%) | 18 (0.4%) |
| Total | 14,092 (100.0%) | 4,951 (100.0%) |
Physical Housing Characteristics in Methuen Town
Housing Structures in Methuen Town
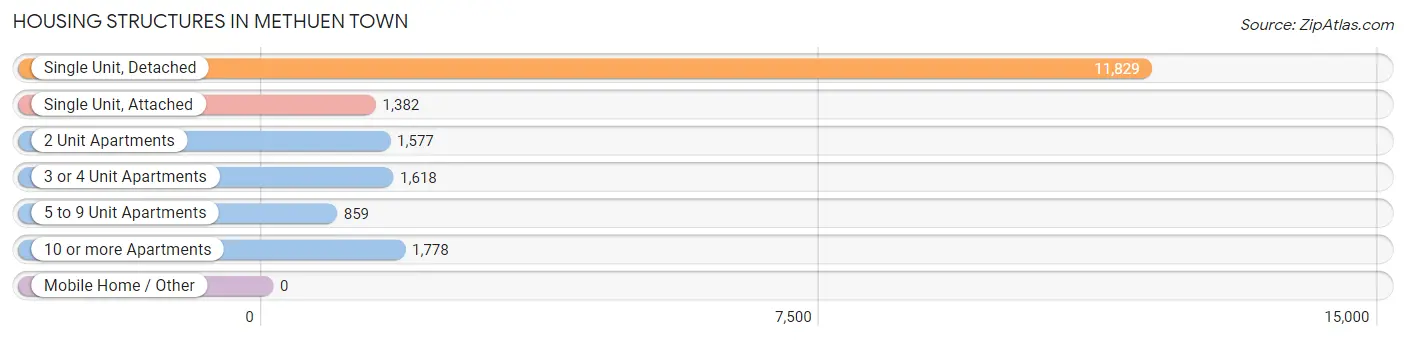
| Structure Type | # Housing Units | % Housing Units |
| Single Unit, Detached | 11,829 | 62.1% |
| Single Unit, Attached | 1,382 | 7.3% |
| 2 Unit Apartments | 1,577 | 8.3% |
| 3 or 4 Unit Apartments | 1,618 | 8.5% |
| 5 to 9 Unit Apartments | 859 | 4.5% |
| 10 or more Apartments | 1,778 | 9.3% |
| Mobile Home / Other | 0 | 0.0% |
| Total | 19,043 | 100.0% |
Housing Structures by Occupancy in Methuen Town
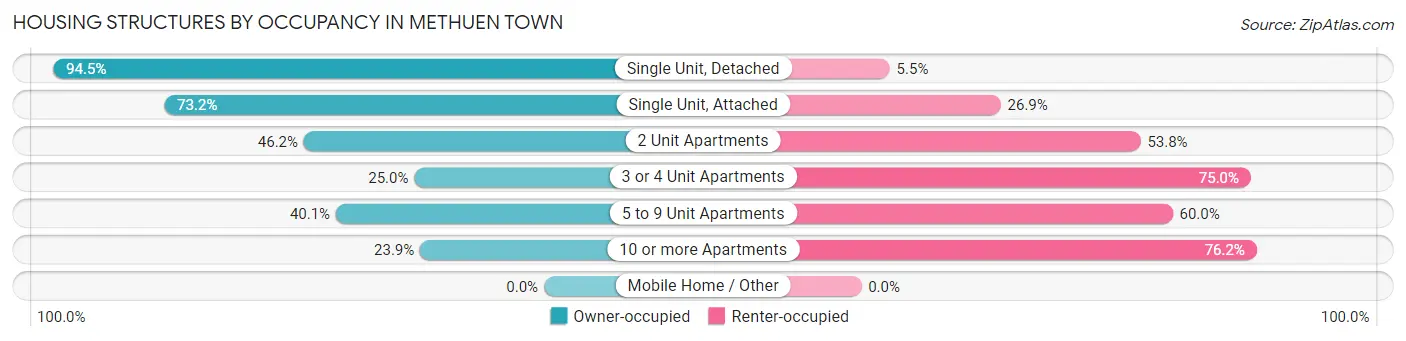
| Structure Type | Owner-occupied | Renter-occupied |
| Single Unit, Detached | 11,180 (94.5%) | 649 (5.5%) |
| Single Unit, Attached | 1,011 (73.2%) | 371 (26.9%) |
| 2 Unit Apartments | 729 (46.2%) | 848 (53.8%) |
| 3 or 4 Unit Apartments | 404 (25.0%) | 1,214 (75.0%) |
| 5 to 9 Unit Apartments | 344 (40.1%) | 515 (60.0%) |
| 10 or more Apartments | 424 (23.8%) | 1,354 (76.1%) |
| Mobile Home / Other | 0 (0.0%) | 0 (0.0%) |
| Total | 14,092 (74.0%) | 4,951 (26.0%) |
Housing Structures by Number of Rooms in Methuen Town
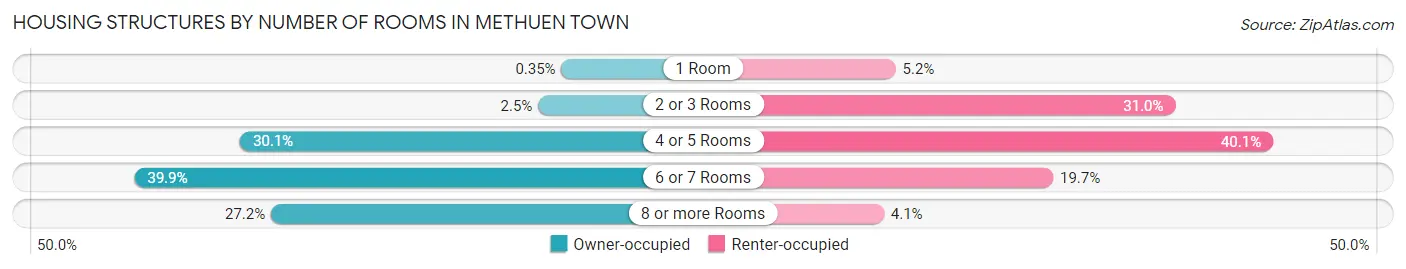
| Number of Rooms | Owner-occupied | Renter-occupied |
| 1 Room | 50 (0.4%) | 255 (5.1%) |
| 2 or 3 Rooms | 352 (2.5%) | 1,536 (31.0%) |
| 4 or 5 Rooms | 4,239 (30.1%) | 1,983 (40.1%) |
| 6 or 7 Rooms | 5,616 (39.9%) | 976 (19.7%) |
| 8 or more Rooms | 3,835 (27.2%) | 201 (4.1%) |
| Total | 14,092 (100.0%) | 4,951 (100.0%) |
Housing Structure by Heating Type in Methuen Town
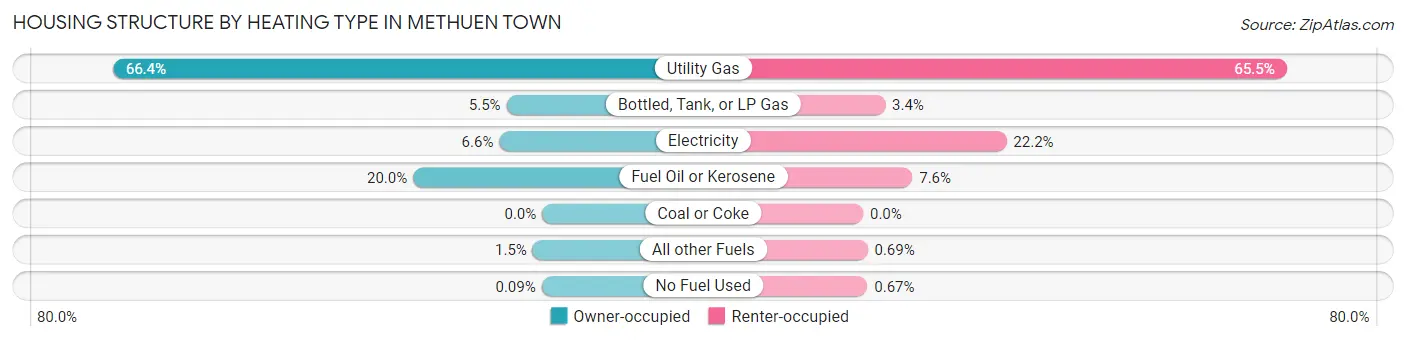
| Heating Type | Owner-occupied | Renter-occupied |
| Utility Gas | 9,351 (66.4%) | 3,241 (65.5%) |
| Bottled, Tank, or LP Gas | 777 (5.5%) | 169 (3.4%) |
| Electricity | 935 (6.6%) | 1,097 (22.2%) |
| Fuel Oil or Kerosene | 2,811 (20.0%) | 377 (7.6%) |
| Coal or Coke | 0 (0.0%) | 0 (0.0%) |
| All other Fuels | 206 (1.5%) | 34 (0.7%) |
| No Fuel Used | 12 (0.1%) | 33 (0.7%) |
| Total | 14,092 (100.0%) | 4,951 (100.0%) |
Household Vehicle Usage in Methuen Town
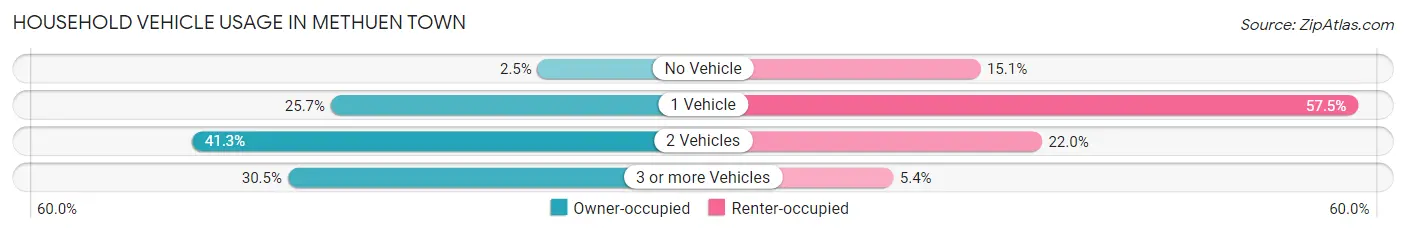
| Vehicles per Household | Owner-occupied | Renter-occupied |
| No Vehicle | 357 (2.5%) | 749 (15.1%) |
| 1 Vehicle | 3,620 (25.7%) | 2,846 (57.5%) |
| 2 Vehicles | 5,814 (41.3%) | 1,090 (22.0%) |
| 3 or more Vehicles | 4,301 (30.5%) | 266 (5.4%) |
| Total | 14,092 (100.0%) | 4,951 (100.0%) |
Real Estate & Mortgages in Methuen Town
Real Estate and Mortgage Overview in Methuen Town
| Characteristic | Without Mortgage | With Mortgage |
| Housing Units | 4,359 | 9,733 |
| Median Property Value | $428,600 | $444,700 |
| Median Household Income | $89,606 | $3,886 |
| Monthly Housing Costs | $909 | $2,188 |
| Real Estate Taxes | $4,877 | $95 |
Property Value by Mortgage Status in Methuen Town
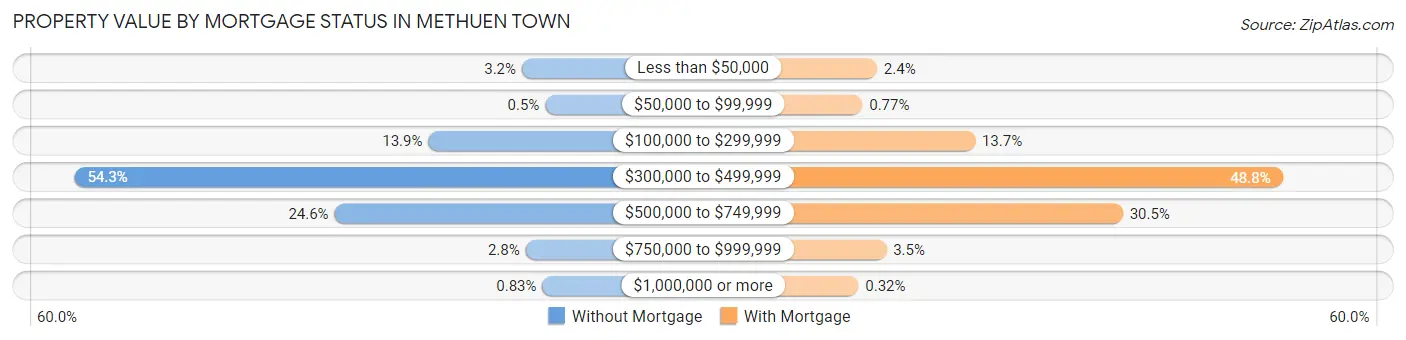
| Property Value | Without Mortgage | With Mortgage |
| Less than $50,000 | 138 (3.2%) | 237 (2.4%) |
| $50,000 to $99,999 | 22 (0.5%) | 75 (0.8%) |
| $100,000 to $299,999 | 604 (13.9%) | 1,329 (13.7%) |
| $300,000 to $499,999 | 2,367 (54.3%) | 4,749 (48.8%) |
| $500,000 to $749,999 | 1,072 (24.6%) | 2,971 (30.5%) |
| $750,000 to $999,999 | 120 (2.8%) | 341 (3.5%) |
| $1,000,000 or more | 36 (0.8%) | 31 (0.3%) |
| Total | 4,359 (100.0%) | 9,733 (100.0%) |
Household Income by Mortgage Status in Methuen Town
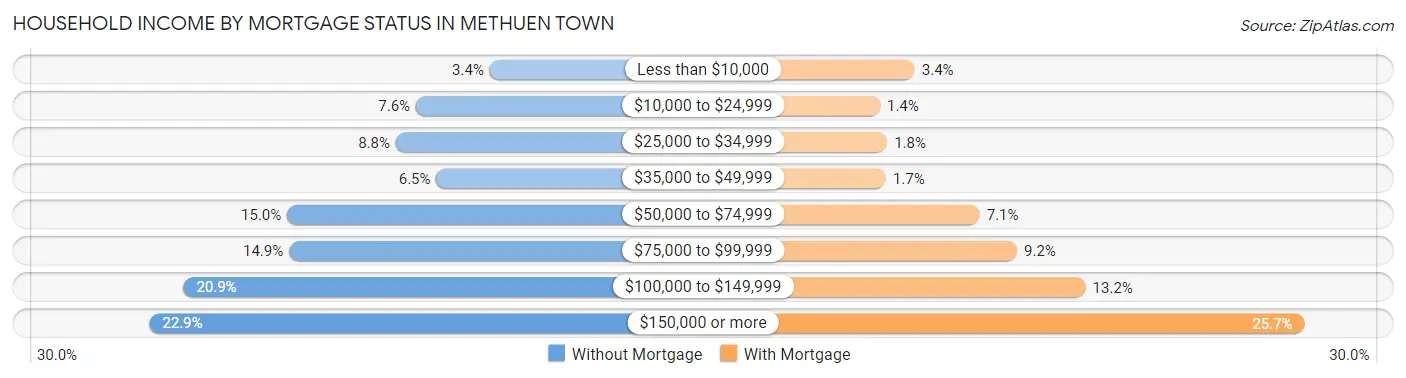
| Household Income | Without Mortgage | With Mortgage |
| Less than $10,000 | 149 (3.4%) | 330 (3.4%) |
| $10,000 to $24,999 | 333 (7.6%) | 136 (1.4%) |
| $25,000 to $34,999 | 383 (8.8%) | 176 (1.8%) |
| $35,000 to $49,999 | 282 (6.5%) | 169 (1.7%) |
| $50,000 to $74,999 | 654 (15.0%) | 691 (7.1%) |
| $75,000 to $99,999 | 649 (14.9%) | 898 (9.2%) |
| $100,000 to $149,999 | 912 (20.9%) | 1,280 (13.2%) |
| $150,000 or more | 997 (22.9%) | 2,497 (25.7%) |
| Total | 4,359 (100.0%) | 9,733 (100.0%) |
Property Value to Household Income Ratio in Methuen Town
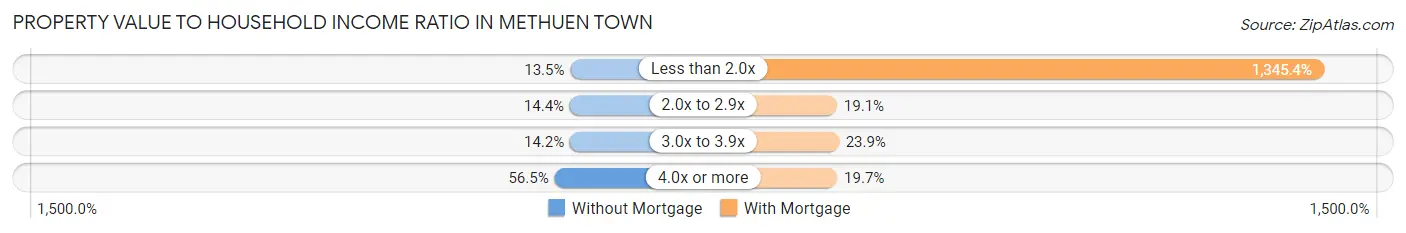
| Value-to-Income Ratio | Without Mortgage | With Mortgage |
| Less than 2.0x | 588 (13.5%) | 130,950 (1,345.4%) |
| 2.0x to 2.9x | 629 (14.4%) | 1,855 (19.1%) |
| 3.0x to 3.9x | 618 (14.2%) | 2,323 (23.9%) |
| 4.0x or more | 2,462 (56.5%) | 1,921 (19.7%) |
| Total | 4,359 (100.0%) | 9,733 (100.0%) |
Real Estate Taxes by Mortgage Status in Methuen Town
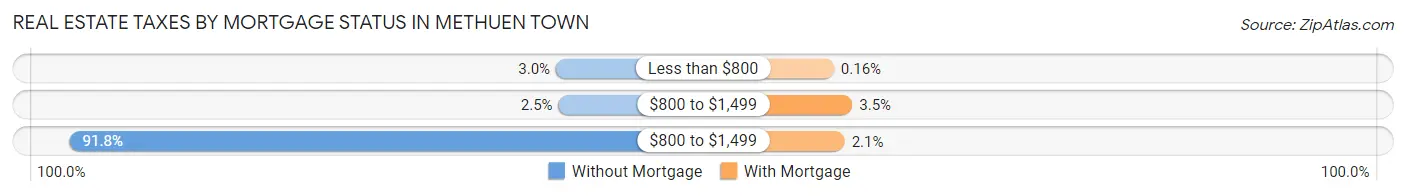
| Property Taxes | Without Mortgage | With Mortgage |
| Less than $800 | 129 (3.0%) | 16 (0.2%) |
| $800 to $1,499 | 109 (2.5%) | 343 (3.5%) |
| $800 to $1,499 | 4,000 (91.8%) | 208 (2.1%) |
| Total | 4,359 (100.0%) | 9,733 (100.0%) |
Health & Disability in Methuen Town
Health Insurance Coverage by Age in Methuen Town
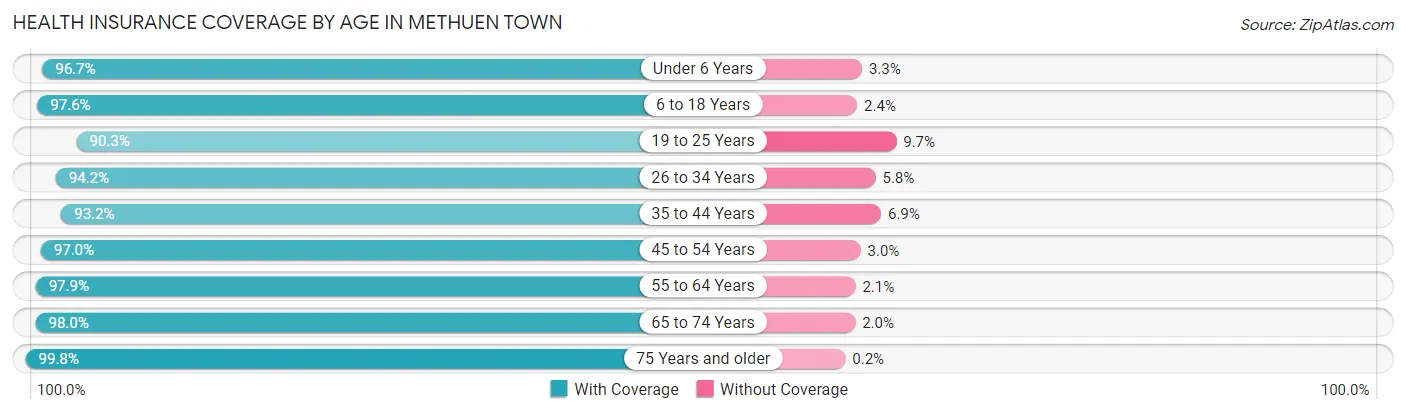
| Age Bracket | With Coverage | Without Coverage |
| Under 6 Years | 2,547 (96.7%) | 87 (3.3%) |
| 6 to 18 Years | 8,790 (97.6%) | 216 (2.4%) |
| 19 to 25 Years | 4,438 (90.3%) | 476 (9.7%) |
| 26 to 34 Years | 5,391 (94.2%) | 334 (5.8%) |
| 35 to 44 Years | 6,734 (93.1%) | 495 (6.9%) |
| 45 to 54 Years | 7,184 (97.0%) | 225 (3.0%) |
| 55 to 64 Years | 6,584 (97.9%) | 140 (2.1%) |
| 65 to 74 Years | 5,232 (98.0%) | 109 (2.0%) |
| 75 Years and older | 3,448 (99.8%) | 7 (0.2%) |
| Total | 50,348 (96.0%) | 2,089 (4.0%) |
Health Insurance Coverage by Citizenship Status in Methuen Town
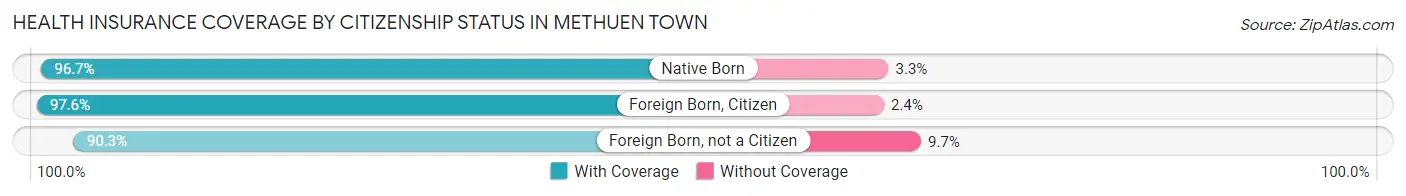
| Citizenship Status | With Coverage | Without Coverage |
| Native Born | 2,547 (96.7%) | 87 (3.3%) |
| Foreign Born, Citizen | 8,790 (97.6%) | 216 (2.4%) |
| Foreign Born, not a Citizen | 4,438 (90.3%) | 476 (9.7%) |
Health Insurance Coverage by Household Income in Methuen Town
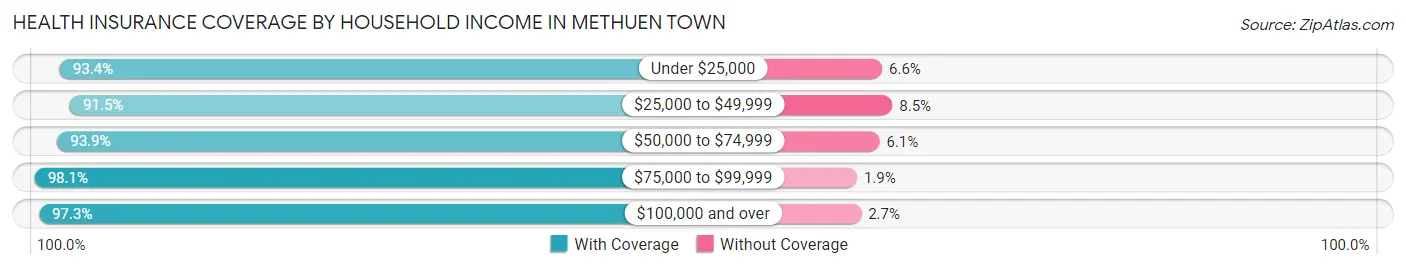
| Household Income | With Coverage | Without Coverage |
| Under $25,000 | 4,041 (93.4%) | 286 (6.6%) |
| $25,000 to $49,999 | 5,085 (91.5%) | 475 (8.5%) |
| $50,000 to $74,999 | 5,521 (93.9%) | 361 (6.1%) |
| $75,000 to $99,999 | 6,000 (98.1%) | 116 (1.9%) |
| $100,000 and over | 29,570 (97.3%) | 820 (2.7%) |
Public vs Private Health Insurance Coverage by Age in Methuen Town
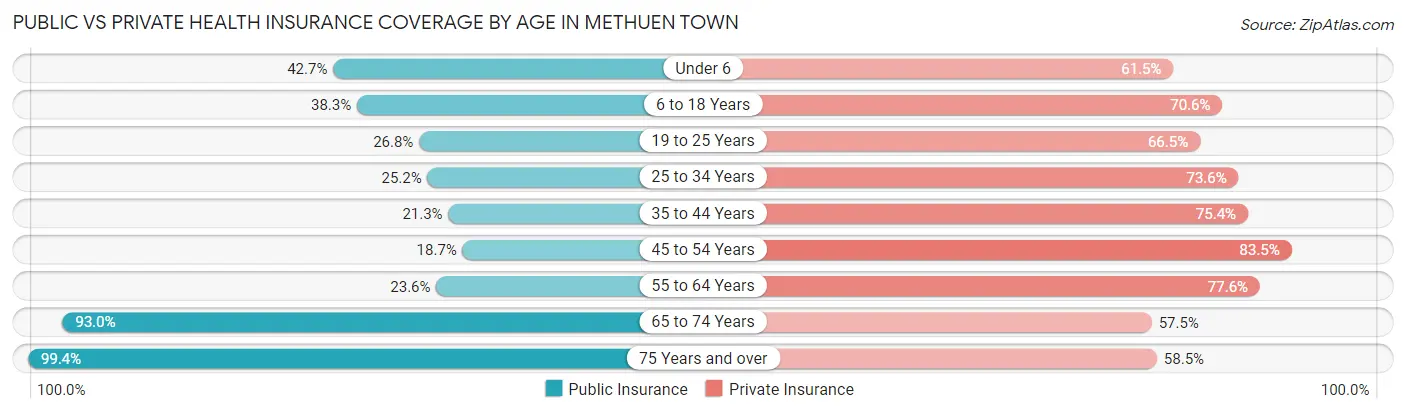
| Age Bracket | Public Insurance | Private Insurance |
| Under 6 | 1,125 (42.7%) | 1,621 (61.5%) |
| 6 to 18 Years | 3,448 (38.3%) | 6,361 (70.6%) |
| 19 to 25 Years | 1,315 (26.8%) | 3,267 (66.5%) |
| 25 to 34 Years | 1,443 (25.2%) | 4,216 (73.6%) |
| 35 to 44 Years | 1,542 (21.3%) | 5,449 (75.4%) |
| 45 to 54 Years | 1,385 (18.7%) | 6,186 (83.5%) |
| 55 to 64 Years | 1,585 (23.6%) | 5,218 (77.6%) |
| 65 to 74 Years | 4,967 (93.0%) | 3,072 (57.5%) |
| 75 Years and over | 3,434 (99.4%) | 2,021 (58.5%) |
| Total | 20,244 (38.6%) | 37,411 (71.3%) |
Disability Status by Sex by Age in Methuen Town
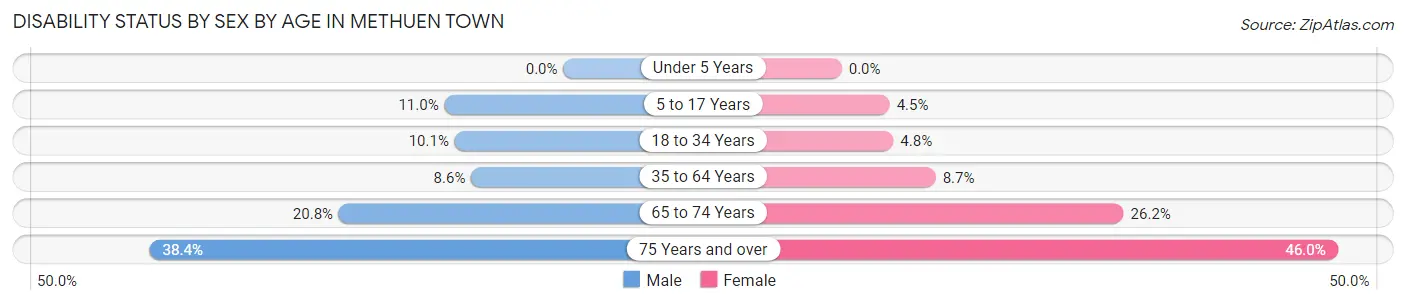
| Age Bracket | Male | Female |
| Under 5 Years | 0 (0.0%) | 0 (0.0%) |
| 5 to 17 Years | 468 (11.0%) | 196 (4.4%) |
| 18 to 34 Years | 592 (10.1%) | 268 (4.8%) |
| 35 to 64 Years | 869 (8.6%) | 977 (8.7%) |
| 65 to 74 Years | 490 (20.8%) | 782 (26.2%) |
| 75 Years and over | 547 (38.4%) | 934 (46.0%) |
Disability Class by Sex by Age in Methuen Town
Disability Class: Hearing Difficulty
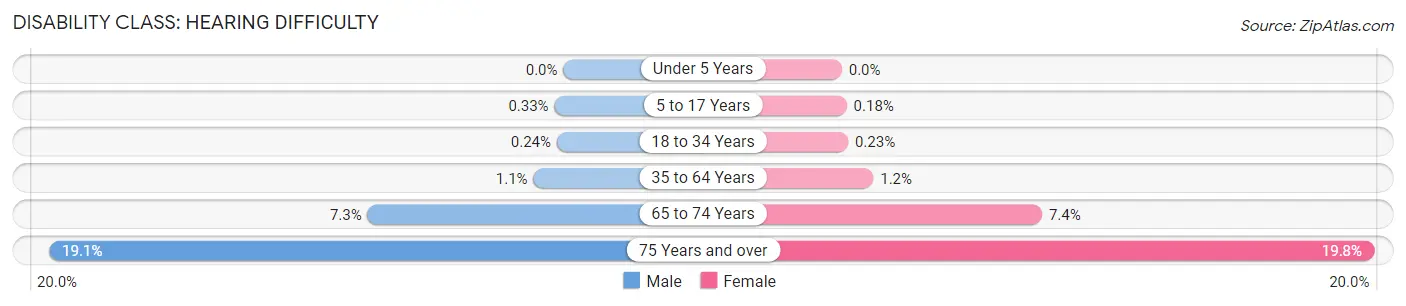
| Age Bracket | Male | Female |
| Under 5 Years | 0 (0.0%) | 0 (0.0%) |
| 5 to 17 Years | 14 (0.3%) | 8 (0.2%) |
| 18 to 34 Years | 14 (0.2%) | 13 (0.2%) |
| 35 to 64 Years | 113 (1.1%) | 131 (1.2%) |
| 65 to 74 Years | 171 (7.3%) | 222 (7.4%) |
| 75 Years and over | 272 (19.1%) | 401 (19.8%) |
Disability Class: Vision Difficulty
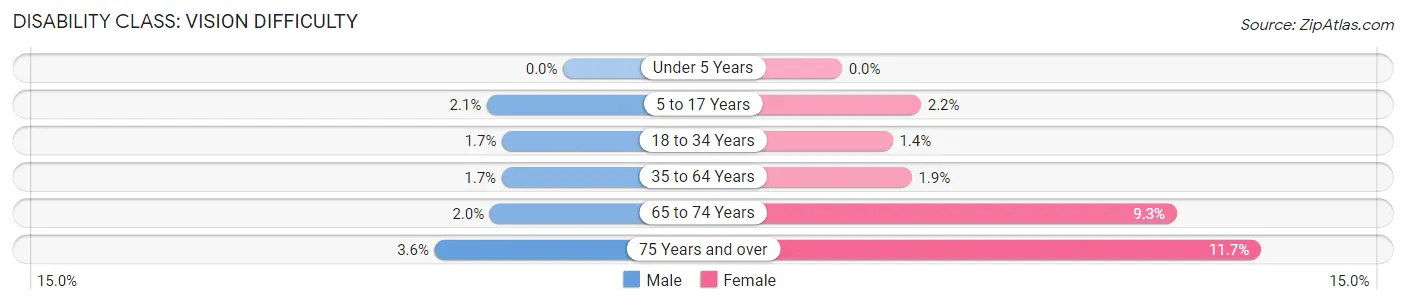
| Age Bracket | Male | Female |
| Under 5 Years | 0 (0.0%) | 0 (0.0%) |
| 5 to 17 Years | 90 (2.1%) | 97 (2.2%) |
| 18 to 34 Years | 100 (1.7%) | 79 (1.4%) |
| 35 to 64 Years | 174 (1.7%) | 217 (1.9%) |
| 65 to 74 Years | 48 (2.0%) | 279 (9.3%) |
| 75 Years and over | 51 (3.6%) | 237 (11.7%) |
Disability Class: Cognitive Difficulty
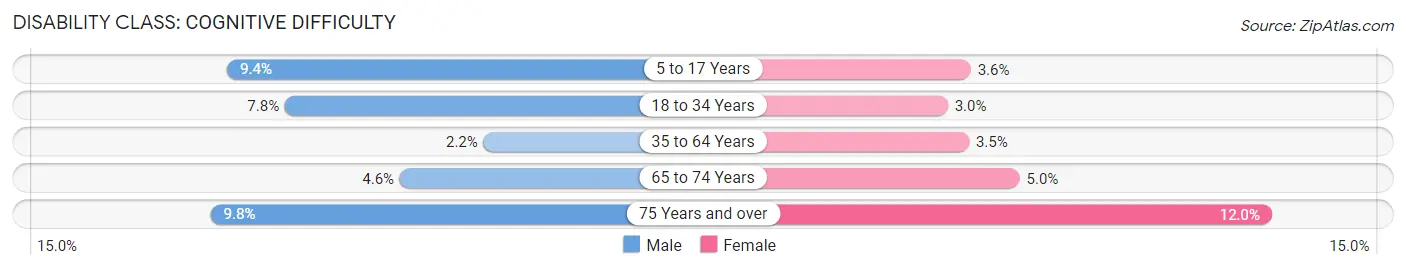
| Age Bracket | Male | Female |
| 5 to 17 Years | 397 (9.4%) | 158 (3.6%) |
| 18 to 34 Years | 455 (7.7%) | 165 (2.9%) |
| 35 to 64 Years | 226 (2.2%) | 397 (3.5%) |
| 65 to 74 Years | 107 (4.5%) | 148 (5.0%) |
| 75 Years and over | 140 (9.8%) | 243 (12.0%) |
Disability Class: Ambulatory Difficulty
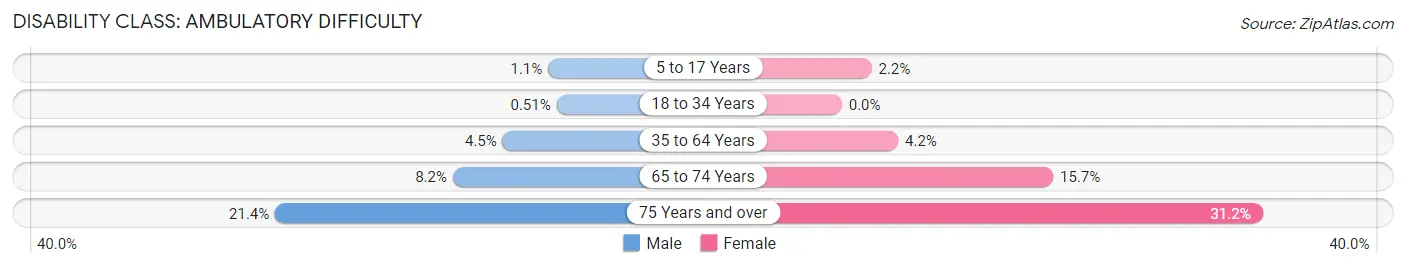
| Age Bracket | Male | Female |
| 5 to 17 Years | 48 (1.1%) | 97 (2.2%) |
| 18 to 34 Years | 30 (0.5%) | 0 (0.0%) |
| 35 to 64 Years | 458 (4.5%) | 468 (4.2%) |
| 65 to 74 Years | 193 (8.2%) | 469 (15.7%) |
| 75 Years and over | 305 (21.4%) | 634 (31.2%) |
Disability Class: Self-Care Difficulty
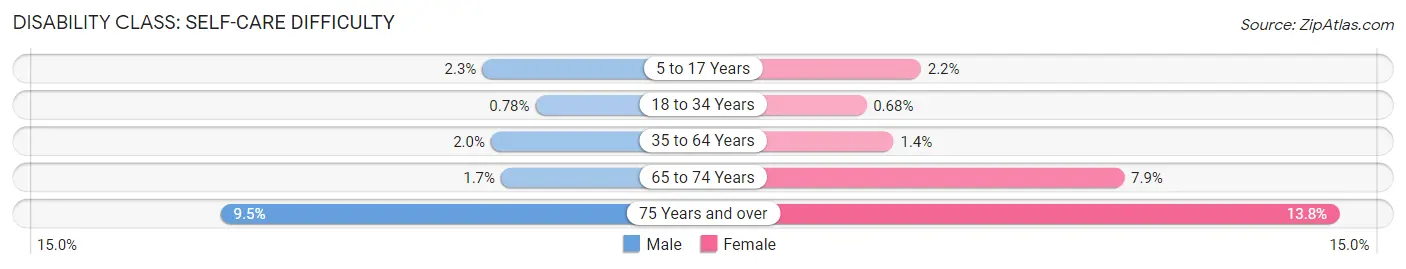
| Age Bracket | Male | Female |
| 5 to 17 Years | 96 (2.3%) | 97 (2.2%) |
| 18 to 34 Years | 46 (0.8%) | 38 (0.7%) |
| 35 to 64 Years | 205 (2.0%) | 161 (1.4%) |
| 65 to 74 Years | 41 (1.7%) | 235 (7.9%) |
| 75 Years and over | 136 (9.5%) | 281 (13.8%) |
Technology Access in Methuen Town
Computing Device Access in Methuen Town
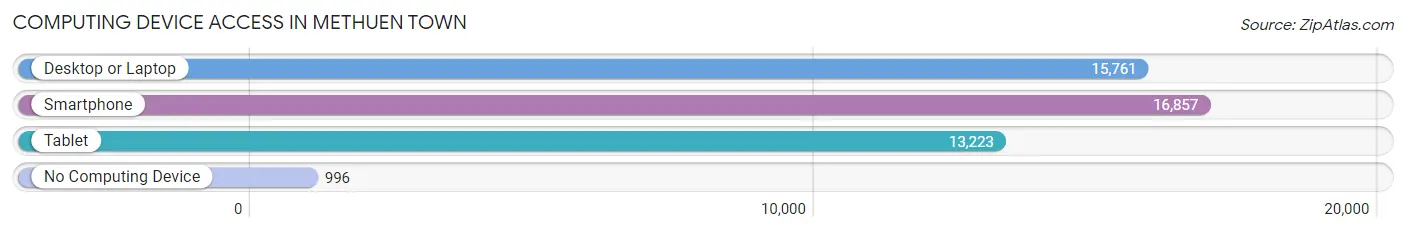
| Device Type | # Households | % Households |
| Desktop or Laptop | 15,761 | 82.8% |
| Smartphone | 16,857 | 88.5% |
| Tablet | 13,223 | 69.4% |
| No Computing Device | 996 | 5.2% |
| Total | 19,043 | 100.0% |
Internet Access in Methuen Town
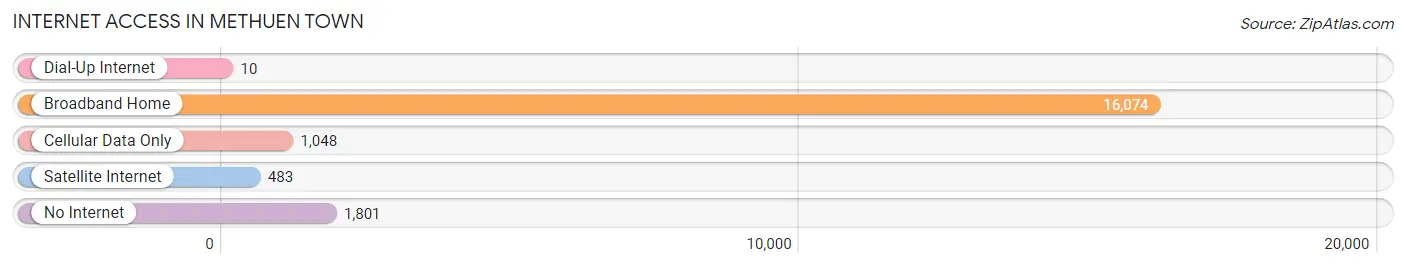
| Internet Type | # Households | % Households |
| Dial-Up Internet | 10 | 0.1% |
| Broadband Home | 16,074 | 84.4% |
| Cellular Data Only | 1,048 | 5.5% |
| Satellite Internet | 483 | 2.5% |
| No Internet | 1,801 | 9.5% |
| Total | 19,043 | 100.0% |
Methuen Town Summary
Methuen Town, Massachusetts is a city located in Essex County, Massachusetts, United States. The city is situated on the Merrimack River, approximately 30 miles north of Boston. As of the 2010 census, the city had a total population of 47,255.
History
Methuen Town was first settled in 1642 and was incorporated in 1726. The town was named after Sir Paul Methuen, an English statesman and diplomat. The town was originally part of Haverhill, Massachusetts, and was known as the "West Parish of Haverhill". In 1741, the town was separated from Haverhill and incorporated as Methuen.
During the American Revolution, the town was the site of the Battle of Methuen, which was fought on April 19, 1775. The battle was a victory for the British, who were able to capture the town and hold it until the end of the war.
In the 19th century, the town was a major center for the production of textiles, particularly woolen goods. The town was also home to several large shoe factories.
Geography
Methuen Town is located at 42°43'N 71°10'W (42.717, -71.167). The city has a total area of 22.2 square miles, of which 21.9 square miles is land and 0.3 square miles is water.
The city is located in the Merrimack Valley region of Massachusetts. The city is bordered by the towns of Lawrence to the north, Haverhill to the east, Andover to the south, and Dracut to the west.
Economy
Methuen Town is home to a variety of businesses and industries. The city is home to several large companies, including the Methuen Textile Company, the Methuen Shoe Company, and the Methuen Paper Company. The city is also home to several smaller businesses, including restaurants, retail stores, and professional services.
The city is also home to several educational institutions, including the University of Massachusetts Lowell, Northern Essex Community College, and the Merrimack Valley Regional Vocational Technical High School.
Demographics
As of the 2010 census, there were 47,255 people, 17,845 households, and 12,717 families residing in the city. The population density was 2,139.3 people per square mile. The racial makeup of the city was 87.2% White, 4.3% African American, 0.3% Native American, 4.2% Asian, 0.1% Pacific Islander, 1.7% from other races, and 2.2% from two or more races. Hispanic or Latino of any race were 6.3% of the population.
The median income for a household in the city was $60,945, and the median income for a family was $72,945. The per capita income for the city was $27,945. About 4.3% of families and 6.2% of the population were below the poverty line, including 8.2% of those under age 18 and 5.2% of those age 65 or over.
Common Questions
What is the Total Population of Methuen Town?
Total Population of Methuen Town is 52,812.
What is the Total Male Population of Methuen Town?
Total Male Population of Methuen Town is 25,396.
What is the Total Female Population of Methuen Town?
Total Female Population of Methuen Town is 27,416.
What is the Ratio of Males per 100 Females in Methuen Town?
There are 92.63 Males per 100 Females in Methuen Town.
What is the Ratio of Females per 100 Males in Methuen Town?
There are 107.95 Females per 100 Males in Methuen Town.
What is the Median Population Age in Methuen Town?
Median Population Age in Methuen Town is 40.6 Years.
What is the Average Family Size in Methuen Town
Average Family Size in Methuen Town is 3.2 People.
What is the Average Household Size in Methuen Town
Average Household Size in Methuen Town is 2.8 People.
What is Per Capita Income in Methuen Town?
Per Capita income in Methuen Town is $43,551.
What is the Median Family Income in Methuen Town?
Median Family Income in Methuen Town is $114,241.
What is the Median Household income in Methuen Town?
Median Household Income in Methuen Town is $93,681.
What is Income or Wage Gap in Methuen Town?
Income or Wage Gap in Methuen Town is 30.9%.
Women in Methuen Town earn 69.1 cents for every dollar earned by a man.
What is Family Income Deficit in Methuen Town?
Family Income Deficit in Methuen Town is $9,808.
Families that are below poverty line in Methuen Town earn $9,808 less on average than the poverty threshold level.
What is Inequality or Gini Index in Methuen Town?
Inequality or Gini Index in Methuen Town is 0.44.
How Large is the Labor Force in Methuen Town?
There are 29,574 People in the Labor Forcein in Methuen Town.
What is the Percentage of People in the Labor Force in Methuen Town?
67.9% of People are in the Labor Force in Methuen Town.
What is the Unemployment Rate in Methuen Town?
Unemployment Rate in Methuen Town is 6.4%.