Cities with the Most Immigrants from Caribbean in Utah
RELATED REPORTS & OPTIONS
Caribbean
Utah
Compare Cities
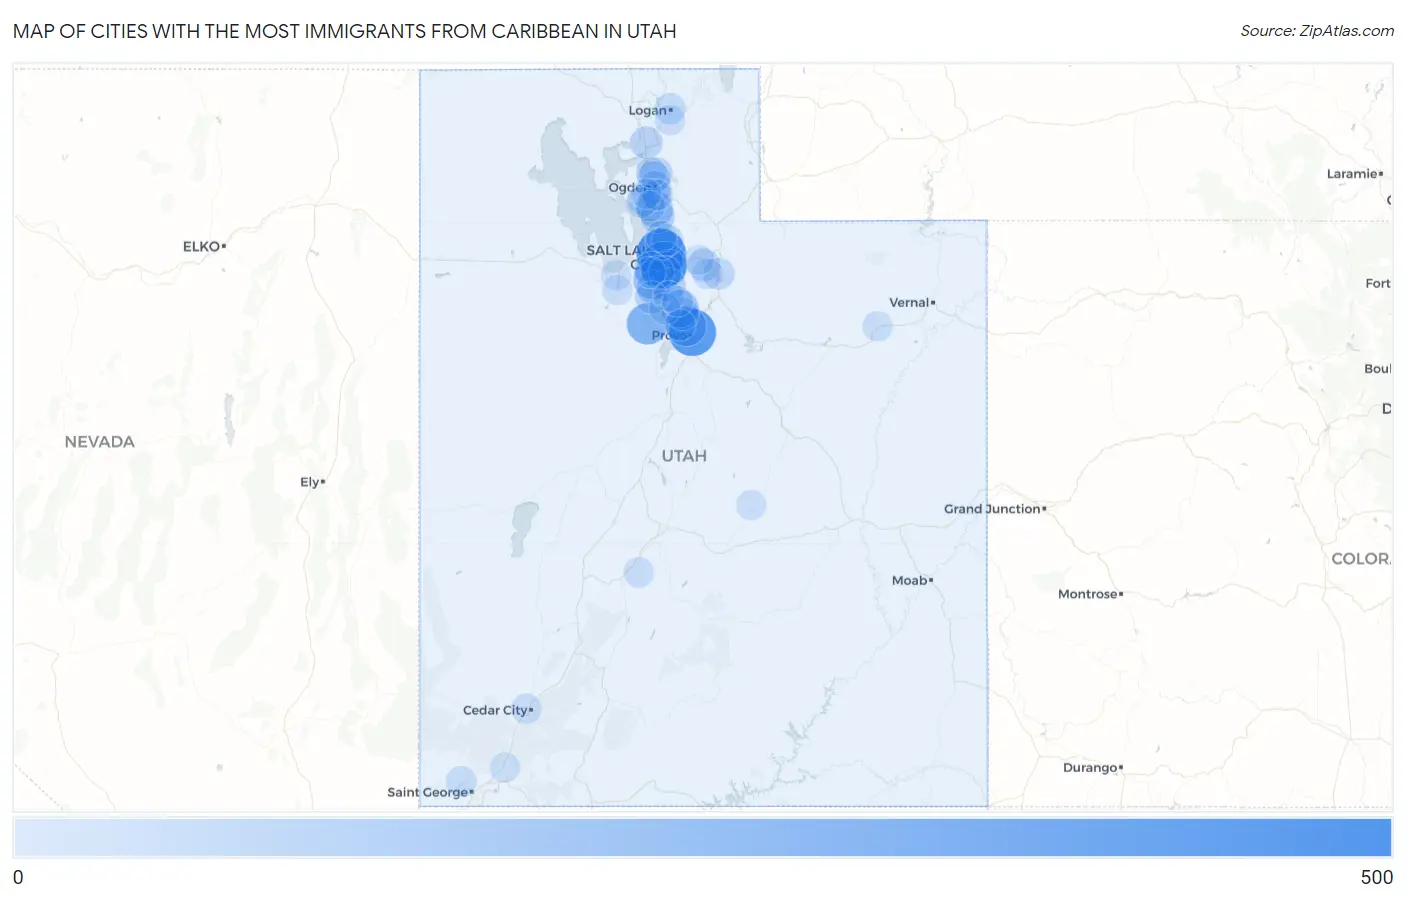
Map of Cities with the Most Immigrants from Caribbean in Utah
0
500
Cities with the Most Immigrants from Caribbean in Utah
| City | Caribbean | vs State | vs National | |
| 1. | Salt Lake City | 462 | 3,788(12.20%)#1 | 4,544,093(0.01%)#713 |
| 2. | Provo | 405 | 3,788(10.69%)#2 | 4,544,093(0.01%)#792 |
| 3. | South Salt Lake | 392 | 3,788(10.35%)#3 | 4,544,093(0.01%)#810 |
| 4. | Eagle Mountain | 263 | 3,788(6.94%)#4 | 4,544,093(0.01%)#1,091 |
| 5. | Orem | 231 | 3,788(6.10%)#5 | 4,544,093(0.01%)#1,204 |
| 6. | West Jordan | 196 | 3,788(5.17%)#6 | 4,544,093(0.00%)#1,354 |
| 7. | Cedar Hills | 174 | 3,788(4.59%)#7 | 4,544,093(0.00%)#1,467 |
| 8. | Layton | 138 | 3,788(3.64%)#8 | 4,544,093(0.00%)#1,693 |
| 9. | Millcreek | 131 | 3,788(3.46%)#9 | 4,544,093(0.00%)#1,758 |
| 10. | Kaysville | 93 | 3,788(2.46%)#10 | 4,544,093(0.00%)#2,187 |
| 11. | South Jordan | 91 | 3,788(2.40%)#11 | 4,544,093(0.00%)#2,211 |
| 12. | West Valley City | 84 | 3,788(2.22%)#12 | 4,544,093(0.00%)#2,313 |
| 13. | Sandy | 84 | 3,788(2.22%)#13 | 4,544,093(0.00%)#2,314 |
| 14. | Pleasant Grove | 69 | 3,788(1.82%)#14 | 4,544,093(0.00%)#2,560 |
| 15. | Murray | 67 | 3,788(1.77%)#15 | 4,544,093(0.00%)#2,602 |
| 16. | Taylorsville | 64 | 3,788(1.69%)#16 | 4,544,093(0.00%)#2,649 |
| 17. | North Ogden | 62 | 3,788(1.64%)#17 | 4,544,093(0.00%)#2,694 |
| 18. | Ogden | 60 | 3,788(1.58%)#18 | 4,544,093(0.00%)#2,741 |
| 19. | Brigham City | 59 | 3,788(1.56%)#19 | 4,544,093(0.00%)#2,772 |
| 20. | Harrisville | 59 | 3,788(1.56%)#20 | 4,544,093(0.00%)#2,780 |
| 21. | Snyderville | 59 | 3,788(1.56%)#21 | 4,544,093(0.00%)#2,781 |
| 22. | Herriman | 55 | 3,788(1.45%)#22 | 4,544,093(0.00%)#2,856 |
| 23. | North Salt Lake | 49 | 3,788(1.29%)#23 | 4,544,093(0.00%)#3,017 |
| 24. | Washington Terrace | 39 | 3,788(1.03%)#24 | 4,544,093(0.00%)#3,334 |
| 25. | Hideout | 36 | 3,788(0.95%)#25 | 4,544,093(0.00%)#3,468 |
| 26. | Lehi | 33 | 3,788(0.87%)#26 | 4,544,093(0.00%)#3,543 |
| 27. | Bountiful | 28 | 3,788(0.74%)#27 | 4,544,093(0.00%)#3,767 |
| 28. | Logan | 26 | 3,788(0.69%)#28 | 4,544,093(0.00%)#3,862 |
| 29. | Clinton | 23 | 3,788(0.61%)#29 | 4,544,093(0.00%)#4,048 |
| 30. | Vineyard | 21 | 3,788(0.55%)#30 | 4,544,093(0.00%)#4,163 |
| 31. | Kearns | 20 | 3,788(0.53%)#31 | 4,544,093(0.00%)#4,217 |
| 32. | West Point | 19 | 3,788(0.50%)#32 | 4,544,093(0.00%)#4,293 |
| 33. | West Bountiful | 19 | 3,788(0.50%)#33 | 4,544,093(0.00%)#4,308 |
| 34. | South Ogden | 18 | 3,788(0.48%)#34 | 4,544,093(0.00%)#4,369 |
| 35. | Park City | 16 | 3,788(0.42%)#35 | 4,544,093(0.00%)#4,522 |
| 36. | Draper | 14 | 3,788(0.37%)#36 | 4,544,093(0.00%)#4,657 |
| 37. | Pleasant View | 13 | 3,788(0.34%)#37 | 4,544,093(0.00%)#4,760 |
| 38. | Alpine | 12 | 3,788(0.32%)#38 | 4,544,093(0.00%)#4,868 |
| 39. | Ivins | 12 | 3,788(0.32%)#39 | 4,544,093(0.00%)#4,870 |
| 40. | Stansbury Park | 10 | 3,788(0.26%)#40 | 4,544,093(0.00%)#5,072 |
| 41. | Cedar City | 8 | 3,788(0.21%)#41 | 4,544,093(0.00%)#5,307 |
| 42. | Clearfield | 7 | 3,788(0.18%)#42 | 4,544,093(0.00%)#5,425 |
| 43. | Nibley | 7 | 3,788(0.18%)#43 | 4,544,093(0.00%)#5,470 |
| 44. | Monroe | 7 | 3,788(0.18%)#44 | 4,544,093(0.00%)#5,509 |
| 45. | Tooele | 5 | 3,788(0.13%)#45 | 4,544,093(0.00%)#5,718 |
| 46. | Summit Park | 5 | 3,788(0.13%)#46 | 4,544,093(0.00%)#5,738 |
| 47. | Roy | 4 | 3,788(0.11%)#47 | 4,544,093(0.00%)#5,860 |
| 48. | Roosevelt | 4 | 3,788(0.11%)#48 | 4,544,093(0.00%)#5,887 |
| 49. | Toquerville | 3 | 3,788(0.08%)#49 | 4,544,093(0.00%)#6,049 |
| 50. | Ferron | 3 | 3,788(0.08%)#50 | 4,544,093(0.00%)#6,075 |
Common Questions
What are the Top 10 Cities with the Most Immigrants from Caribbean in Utah?
Top 10 Cities with the Most Immigrants from Caribbean in Utah are:
#1
462
#2
405
#3
392
#4
263
#5
231
#6
196
#7
174
#8
138
#9
131
#10
93
What city has the Most Immigrants from Caribbean in Utah?
Salt Lake City has the Most Immigrants from Caribbean in Utah with 462.
What is the Total Immigrants from Caribbean in the State of Utah?
Total Immigrants from Caribbean in Utah is 3,788.
What is the Total Immigrants from Caribbean in the United States?
Total Immigrants from Caribbean in the United States is 4,544,093.