Cities with the Most Immigrants from Caribbean in Nebraska
RELATED REPORTS & OPTIONS
Caribbean
Nebraska
Compare Cities
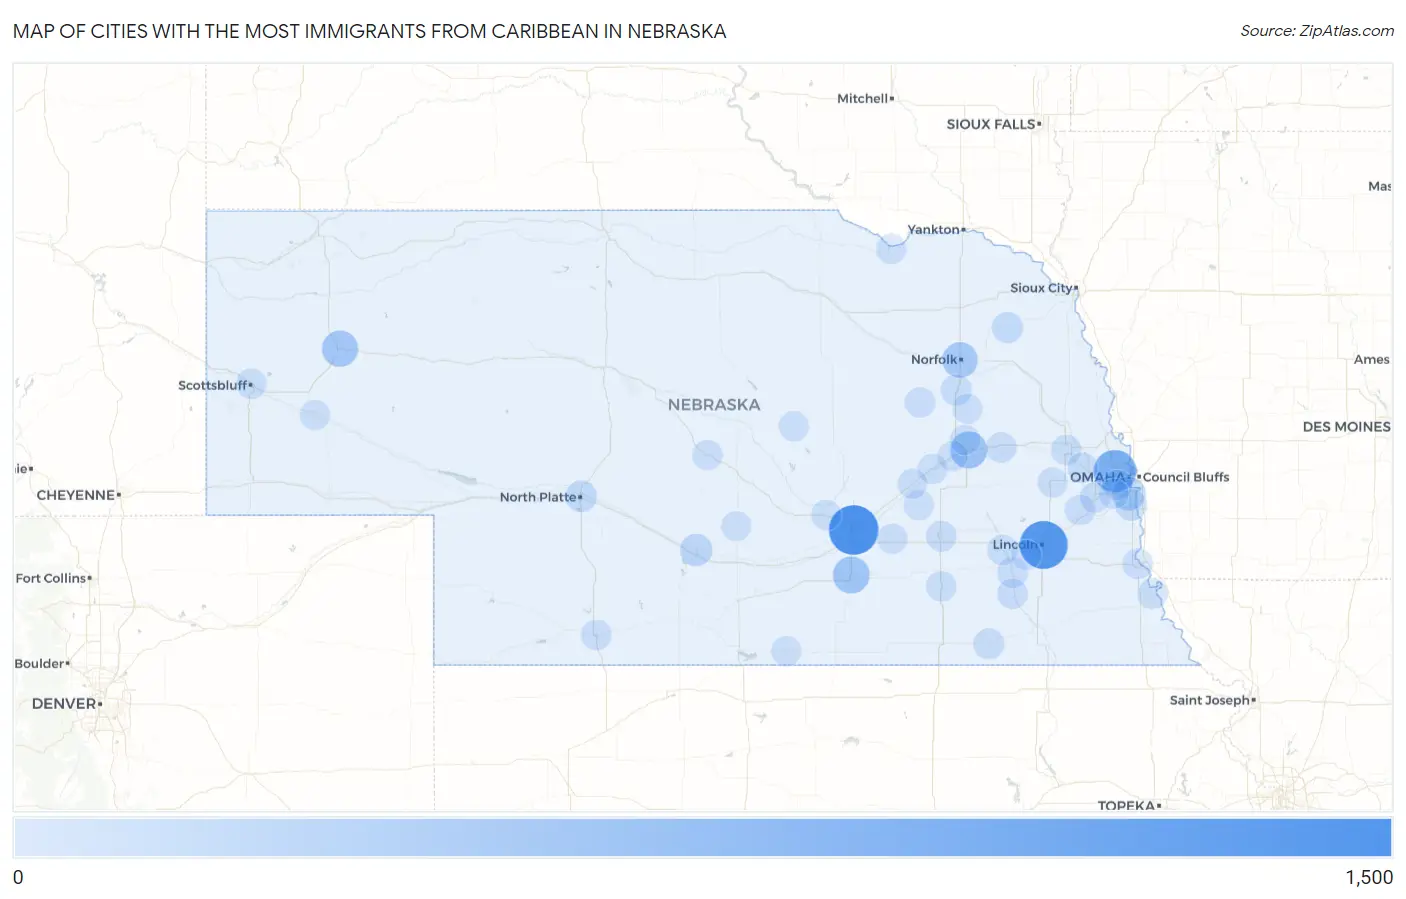
Map of Cities with the Most Immigrants from Caribbean in Nebraska
0
1,500
Cities with the Most Immigrants from Caribbean in Nebraska
| City | Caribbean | vs State | vs National | |
| 1. | Grand Island | 1,164 | 5,578(20.87%)#1 | 4,544,093(0.03%)#379 |
| 2. | Lincoln | 1,066 | 5,578(19.11%)#2 | 4,544,093(0.02%)#404 |
| 3. | Omaha | 736 | 5,578(13.19%)#3 | 4,544,093(0.02%)#523 |
| 4. | Columbus | 402 | 5,578(7.21%)#4 | 4,544,093(0.01%)#799 |
| 5. | Hastings | 384 | 5,578(6.88%)#5 | 4,544,093(0.01%)#821 |
| 6. | Alliance | 352 | 5,578(6.31%)#6 | 4,544,093(0.01%)#881 |
| 7. | Norfolk | 306 | 5,578(5.49%)#7 | 4,544,093(0.01%)#990 |
| 8. | Bellevue | 195 | 5,578(3.50%)#8 | 4,544,093(0.00%)#1,360 |
| 9. | Lexington | 123 | 5,578(2.21%)#9 | 4,544,093(0.00%)#1,834 |
| 10. | La Platte | 79 | 5,578(1.42%)#10 | 4,544,093(0.00%)#2,400 |
| 11. | North Platte | 77 | 5,578(1.38%)#11 | 4,544,093(0.00%)#2,423 |
| 12. | Wayne | 53 | 5,578(0.95%)#12 | 4,544,093(0.00%)#2,921 |
| 13. | Madison | 43 | 5,578(0.77%)#13 | 4,544,093(0.00%)#3,223 |
| 14. | Fairbury | 38 | 5,578(0.68%)#14 | 4,544,093(0.00%)#3,382 |
| 15. | Crete | 29 | 5,578(0.52%)#15 | 4,544,093(0.00%)#3,741 |
| 16. | Mccook | 27 | 5,578(0.48%)#16 | 4,544,093(0.00%)#3,842 |
| 17. | Milford | 24 | 5,578(0.43%)#17 | 4,544,093(0.00%)#4,019 |
| 18. | York | 23 | 5,578(0.41%)#18 | 4,544,093(0.00%)#4,058 |
| 19. | Schuyler | 23 | 5,578(0.41%)#19 | 4,544,093(0.00%)#4,059 |
| 20. | Ashland | 20 | 5,578(0.36%)#20 | 4,544,093(0.00%)#4,255 |
| 21. | Wilber | 20 | 5,578(0.36%)#21 | 4,544,093(0.00%)#4,269 |
| 22. | Nebraska City | 17 | 5,578(0.30%)#22 | 4,544,093(0.00%)#4,462 |
| 23. | Gretna | 16 | 5,578(0.29%)#23 | 4,544,093(0.00%)#4,519 |
| 24. | Geneva | 13 | 5,578(0.23%)#24 | 4,544,093(0.00%)#4,809 |
| 25. | Fremont | 12 | 5,578(0.22%)#25 | 4,544,093(0.00%)#4,842 |
| 26. | Scottsbluff | 12 | 5,578(0.22%)#26 | 4,544,093(0.00%)#4,858 |
| 27. | Newman Grove | 12 | 5,578(0.22%)#27 | 4,544,093(0.00%)#4,917 |
| 28. | Valley | 11 | 5,578(0.20%)#28 | 4,544,093(0.00%)#4,996 |
| 29. | Peru | 10 | 5,578(0.18%)#29 | 4,544,093(0.00%)#5,161 |
| 30. | Broken Bow | 8 | 5,578(0.14%)#30 | 4,544,093(0.00%)#5,358 |
| 31. | Duncan | 8 | 5,578(0.14%)#31 | 4,544,093(0.00%)#5,408 |
| 32. | Ralston | 7 | 5,578(0.13%)#32 | 4,544,093(0.00%)#5,473 |
| 33. | Aurora | 7 | 5,578(0.13%)#33 | 4,544,093(0.00%)#5,485 |
| 34. | Ord | 7 | 5,578(0.13%)#34 | 4,544,093(0.00%)#5,520 |
| 35. | Papillion | 6 | 5,578(0.11%)#35 | 4,544,093(0.00%)#5,584 |
| 36. | Polk | 6 | 5,578(0.11%)#36 | 4,544,093(0.00%)#5,710 |
| 37. | Lakeview | 6 | 5,578(0.11%)#37 | 4,544,093(0.00%)#5,712 |
| 38. | Denton | 5 | 5,578(0.09%)#38 | 4,544,093(0.00%)#5,853 |
| 39. | Wahoo | 3 | 5,578(0.05%)#39 | 4,544,093(0.00%)#6,018 |
| 40. | Cairo | 3 | 5,578(0.05%)#40 | 4,544,093(0.00%)#6,091 |
| 41. | Silver Creek | 2 | 5,578(0.04%)#41 | 4,544,093(0.00%)#6,283 |
| 42. | Clarks | 2 | 5,578(0.04%)#42 | 4,544,093(0.00%)#6,290 |
| 43. | Creston | 2 | 5,578(0.04%)#43 | 4,544,093(0.00%)#6,304 |
| 44. | Miller | 2 | 5,578(0.04%)#44 | 4,544,093(0.00%)#6,307 |
| 45. | Bridgeport | 1 | 5,578(0.02%)#45 | 4,544,093(0.00%)#6,395 |
| 46. | Franklin | 1 | 5,578(0.02%)#46 | 4,544,093(0.00%)#6,416 |
| 47. | Niobrara | 1 | 5,578(0.02%)#47 | 4,544,093(0.00%)#6,447 |
Common Questions
What are the Top 10 Cities with the Most Immigrants from Caribbean in Nebraska?
Top 10 Cities with the Most Immigrants from Caribbean in Nebraska are:
What city has the Most Immigrants from Caribbean in Nebraska?
Grand Island has the Most Immigrants from Caribbean in Nebraska with 1,164.
What is the Total Immigrants from Caribbean in the State of Nebraska?
Total Immigrants from Caribbean in Nebraska is 5,578.
What is the Total Immigrants from Caribbean in the United States?
Total Immigrants from Caribbean in the United States is 4,544,093.