Cities with the Most Immigrants from Caribbean in Minnesota
RELATED REPORTS & OPTIONS
Caribbean
Minnesota
Compare Cities
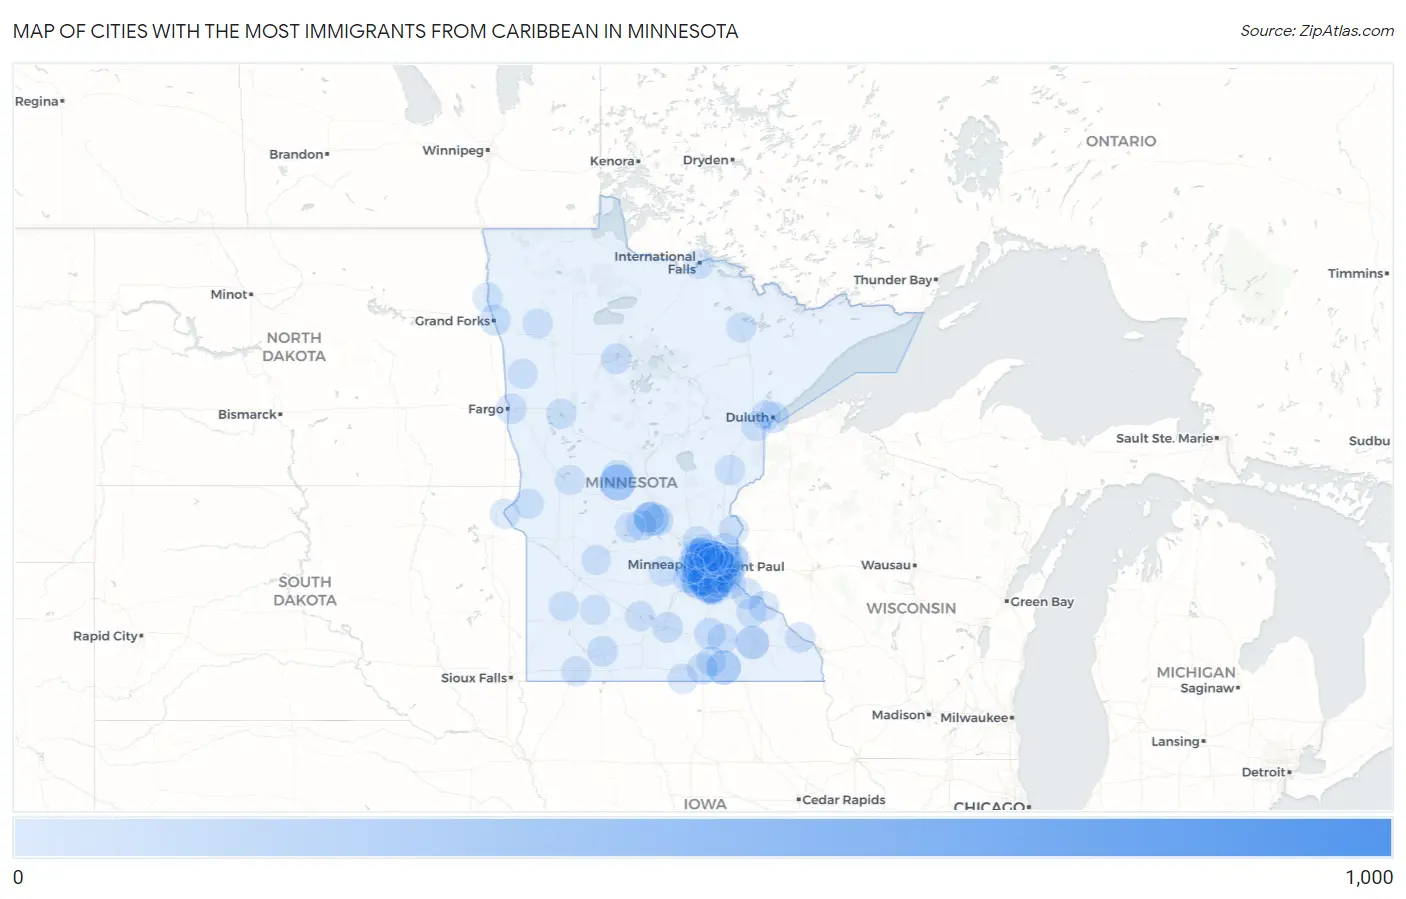
Map of Cities with the Most Immigrants from Caribbean in Minnesota
0
1,000
Cities with the Most Immigrants from Caribbean in Minnesota
| City | Caribbean | vs State | vs National | |
| 1. | Minneapolis | 916 | 6,762(13.55%)#1 | 4,544,093(0.02%)#448 |
| 2. | Apple Valley | 471 | 6,762(6.97%)#2 | 4,544,093(0.01%)#696 |
| 3. | St Paul | 433 | 6,762(6.40%)#3 | 4,544,093(0.01%)#748 |
| 4. | Bloomington | 388 | 6,762(5.74%)#4 | 4,544,093(0.01%)#814 |
| 5. | Long Prairie | 265 | 6,762(3.92%)#5 | 4,544,093(0.01%)#1,087 |
| 6. | Waite Park | 201 | 6,762(2.97%)#6 | 4,544,093(0.00%)#1,332 |
| 7. | Austin | 194 | 6,762(2.87%)#7 | 4,544,093(0.00%)#1,374 |
| 8. | Burnsville | 190 | 6,762(2.81%)#8 | 4,544,093(0.00%)#1,387 |
| 9. | Inver Grove Heights | 187 | 6,762(2.77%)#9 | 4,544,093(0.00%)#1,397 |
| 10. | Oakdale | 184 | 6,762(2.72%)#10 | 4,544,093(0.00%)#1,411 |
| 11. | New Brighton | 175 | 6,762(2.59%)#11 | 4,544,093(0.00%)#1,458 |
| 12. | Woodbury | 165 | 6,762(2.44%)#12 | 4,544,093(0.00%)#1,525 |
| 13. | Eagan | 154 | 6,762(2.28%)#13 | 4,544,093(0.00%)#1,594 |
| 14. | Rochester | 151 | 6,762(2.23%)#14 | 4,544,093(0.00%)#1,609 |
| 15. | Hopkins | 143 | 6,762(2.11%)#15 | 4,544,093(0.00%)#1,664 |
| 16. | New Hope | 133 | 6,762(1.97%)#16 | 4,544,093(0.00%)#1,744 |
| 17. | Plymouth | 119 | 6,762(1.76%)#17 | 4,544,093(0.00%)#1,865 |
| 18. | West St Paul | 103 | 6,762(1.52%)#18 | 4,544,093(0.00%)#2,042 |
| 19. | Brooklyn Park | 102 | 6,762(1.51%)#19 | 4,544,093(0.00%)#2,055 |
| 20. | Eden Prairie | 96 | 6,762(1.42%)#20 | 4,544,093(0.00%)#2,140 |
| 21. | Richfield | 78 | 6,762(1.15%)#21 | 4,544,093(0.00%)#2,406 |
| 22. | Maplewood | 73 | 6,762(1.08%)#22 | 4,544,093(0.00%)#2,495 |
| 23. | Lakeville | 72 | 6,762(1.06%)#23 | 4,544,093(0.00%)#2,512 |
| 24. | Shakopee | 72 | 6,762(1.06%)#24 | 4,544,093(0.00%)#2,514 |
| 25. | St Cloud | 63 | 6,762(0.93%)#25 | 4,544,093(0.00%)#2,666 |
| 26. | Chaska | 60 | 6,762(0.89%)#26 | 4,544,093(0.00%)#2,748 |
| 27. | Robbinsdale | 59 | 6,762(0.87%)#27 | 4,544,093(0.00%)#2,775 |
| 28. | Owatonna | 53 | 6,762(0.78%)#28 | 4,544,093(0.00%)#2,916 |
| 29. | Albert Lea | 51 | 6,762(0.75%)#29 | 4,544,093(0.00%)#2,968 |
| 30. | Brooklyn Center | 49 | 6,762(0.72%)#30 | 4,544,093(0.00%)#3,014 |
| 31. | St Louis Park | 45 | 6,762(0.67%)#31 | 4,544,093(0.00%)#3,131 |
| 32. | Hugo | 44 | 6,762(0.65%)#32 | 4,544,093(0.00%)#3,170 |
| 33. | Cottage Grove | 43 | 6,762(0.64%)#33 | 4,544,093(0.00%)#3,198 |
| 34. | East Grand Forks | 43 | 6,762(0.64%)#34 | 4,544,093(0.00%)#3,214 |
| 35. | Duluth | 41 | 6,762(0.61%)#35 | 4,544,093(0.00%)#3,264 |
| 36. | Prior Lake | 37 | 6,762(0.55%)#36 | 4,544,093(0.00%)#3,398 |
| 37. | Columbia Heights | 37 | 6,762(0.55%)#37 | 4,544,093(0.00%)#3,399 |
| 38. | Fridley | 36 | 6,762(0.53%)#38 | 4,544,093(0.00%)#3,430 |
| 39. | Minnetonka | 35 | 6,762(0.52%)#39 | 4,544,093(0.00%)#3,473 |
| 40. | Mankato | 33 | 6,762(0.49%)#40 | 4,544,093(0.00%)#3,548 |
| 41. | Vadnais Heights | 33 | 6,762(0.49%)#41 | 4,544,093(0.00%)#3,559 |
| 42. | Bayport | 32 | 6,762(0.47%)#42 | 4,544,093(0.00%)#3,630 |
| 43. | Golden Valley | 31 | 6,762(0.46%)#43 | 4,544,093(0.00%)#3,648 |
| 44. | Red Wing | 30 | 6,762(0.44%)#44 | 4,544,093(0.00%)#3,687 |
| 45. | Edina | 27 | 6,762(0.40%)#45 | 4,544,093(0.00%)#3,822 |
| 46. | Cold Spring | 26 | 6,762(0.38%)#46 | 4,544,093(0.00%)#3,902 |
| 47. | Rosemount | 24 | 6,762(0.35%)#47 | 4,544,093(0.00%)#3,987 |
| 48. | Windom | 24 | 6,762(0.35%)#48 | 4,544,093(0.00%)#4,009 |
| 49. | Savage | 23 | 6,762(0.34%)#49 | 4,544,093(0.00%)#4,041 |
| 50. | Shoreview | 23 | 6,762(0.34%)#50 | 4,544,093(0.00%)#4,045 |
| 51. | Browerville | 22 | 6,762(0.33%)#51 | 4,544,093(0.00%)#4,138 |
| 52. | Bemidji | 21 | 6,762(0.31%)#52 | 4,544,093(0.00%)#4,155 |
| 53. | St Joseph | 20 | 6,762(0.30%)#53 | 4,544,093(0.00%)#4,241 |
| 54. | Roseville | 19 | 6,762(0.28%)#54 | 4,544,093(0.00%)#4,279 |
| 55. | Maple Grove | 18 | 6,762(0.27%)#55 | 4,544,093(0.00%)#4,350 |
| 56. | Stillwater | 15 | 6,762(0.22%)#56 | 4,544,093(0.00%)#4,585 |
| 57. | Claremont | 15 | 6,762(0.22%)#57 | 4,544,093(0.00%)#4,650 |
| 58. | Moorhead | 14 | 6,762(0.21%)#58 | 4,544,093(0.00%)#4,660 |
| 59. | Winona | 13 | 6,762(0.19%)#59 | 4,544,093(0.00%)#4,739 |
| 60. | Arden Hills | 12 | 6,762(0.18%)#60 | 4,544,093(0.00%)#4,869 |
| 61. | Ramsey | 11 | 6,762(0.16%)#61 | 4,544,093(0.00%)#4,934 |
| 62. | Lake City | 11 | 6,762(0.16%)#62 | 4,544,093(0.00%)#4,973 |
| 63. | Landfall | 10 | 6,762(0.15%)#63 | 4,544,093(0.00%)#5,160 |
| 64. | Coon Rapids | 9 | 6,762(0.13%)#64 | 4,544,093(0.00%)#5,169 |
| 65. | Detroit Lakes | 9 | 6,762(0.13%)#65 | 4,544,093(0.00%)#5,215 |
| 66. | St. John's University | 9 | 6,762(0.13%)#66 | 4,544,093(0.00%)#5,275 |
| 67. | Farmington | 8 | 6,762(0.12%)#67 | 4,544,093(0.00%)#5,316 |
| 68. | Lauderdale | 8 | 6,762(0.12%)#68 | 4,544,093(0.00%)#5,378 |
| 69. | Dumont | 8 | 6,762(0.12%)#69 | 4,544,093(0.00%)#5,418 |
| 70. | Worthington | 7 | 6,762(0.10%)#70 | 4,544,093(0.00%)#5,445 |
| 71. | Marshall | 7 | 6,762(0.10%)#71 | 4,544,093(0.00%)#5,449 |
| 72. | New Ulm | 6 | 6,762(0.09%)#72 | 4,544,093(0.00%)#5,593 |
| 73. | International Falls | 6 | 6,762(0.09%)#73 | 4,544,093(0.00%)#5,619 |
| 74. | Osseo | 6 | 6,762(0.09%)#74 | 4,544,093(0.00%)#5,651 |
| 75. | Sandstone | 6 | 6,762(0.09%)#75 | 4,544,093(0.00%)#5,653 |
| 76. | Little Canada | 5 | 6,762(0.07%)#76 | 4,544,093(0.00%)#5,732 |
| 77. | Lester Prairie | 5 | 6,762(0.07%)#77 | 4,544,093(0.00%)#5,786 |
| 78. | Wabasso | 5 | 6,762(0.07%)#78 | 4,544,093(0.00%)#5,835 |
| 79. | Browns Valley | 5 | 6,762(0.07%)#79 | 4,544,093(0.00%)#5,843 |
| 80. | Raymond | 4 | 6,762(0.06%)#80 | 4,544,093(0.00%)#5,967 |
| 81. | Evansville | 4 | 6,762(0.06%)#81 | 4,544,093(0.00%)#5,972 |
| 82. | Ada | 3 | 6,762(0.04%)#82 | 4,544,093(0.00%)#6,059 |
| 83. | Hilltop | 3 | 6,762(0.04%)#83 | 4,544,093(0.00%)#6,098 |
| 84. | Center City | 3 | 6,762(0.04%)#84 | 4,544,093(0.00%)#6,121 |
| 85. | Kiester | 3 | 6,762(0.04%)#85 | 4,544,093(0.00%)#6,123 |
| 86. | Cook | 3 | 6,762(0.04%)#86 | 4,544,093(0.00%)#6,133 |
| 87. | Oslo | 3 | 6,762(0.04%)#87 | 4,544,093(0.00%)#6,140 |
| 88. | Bellechester | 3 | 6,762(0.04%)#88 | 4,544,093(0.00%)#6,148 |
| 89. | Tonka Bay | 2 | 6,762(0.03%)#89 | 4,544,093(0.00%)#6,213 |
| 90. | Red Lake Falls | 2 | 6,762(0.03%)#90 | 4,544,093(0.00%)#6,221 |
| 91. | Hastings | 1 | 6,762(0.01%)#91 | 4,544,093(0.00%)#6,316 |
| 92. | Hermantown | 1 | 6,762(0.01%)#92 | 4,544,093(0.00%)#6,329 |
| 93. | Carlton | 1 | 6,762(0.01%)#93 | 4,544,093(0.00%)#6,410 |
| 94. | Hollandale | 1 | 6,762(0.01%)#94 | 4,544,093(0.00%)#6,449 |
| 95. | Roscoe | 1 | 6,762(0.01%)#95 | 4,544,093(0.00%)#6,471 |
Common Questions
What are the Top 10 Cities with the Most Immigrants from Caribbean in Minnesota?
Top 10 Cities with the Most Immigrants from Caribbean in Minnesota are:
#1
916
#2
471
#3
433
#4
388
#5
265
#6
201
#7
194
#8
190
#9
187
#10
184
What city has the Most Immigrants from Caribbean in Minnesota?
Minneapolis has the Most Immigrants from Caribbean in Minnesota with 916.
What is the Total Immigrants from Caribbean in the State of Minnesota?
Total Immigrants from Caribbean in Minnesota is 6,762.
What is the Total Immigrants from Caribbean in the United States?
Total Immigrants from Caribbean in the United States is 4,544,093.