Cities with the Most Immigrants from Caribbean in Mississippi
RELATED REPORTS & OPTIONS
Caribbean
Mississippi
Compare Cities
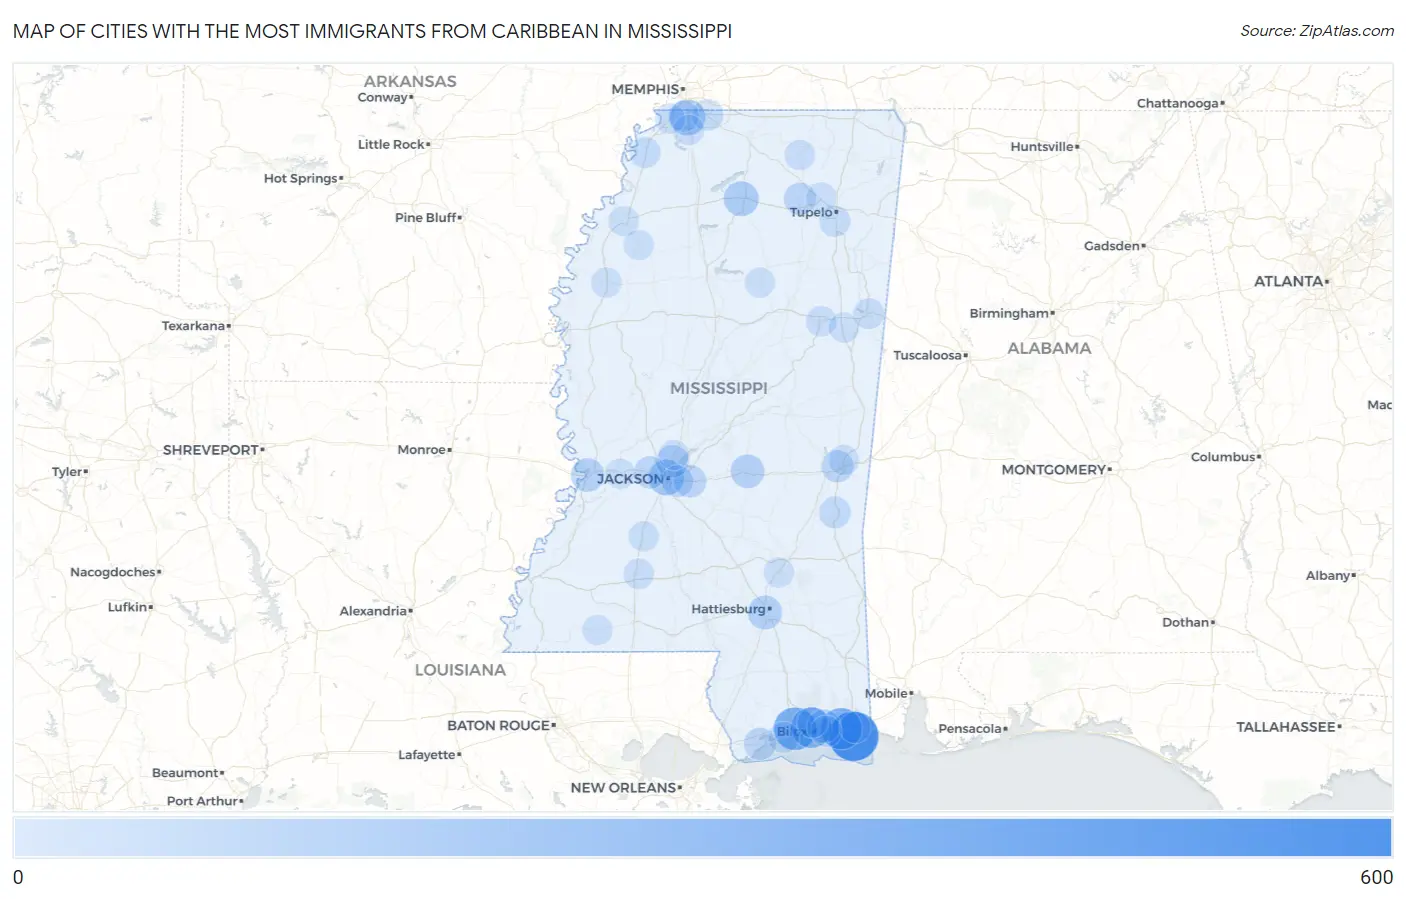
Map of Cities with the Most Immigrants from Caribbean in Mississippi
0
600
Cities with the Most Immigrants from Caribbean in Mississippi
| City | Caribbean | vs State | vs National | |
| 1. | Pascagoula | 566 | 3,847(14.71%)#1 | 4,544,093(0.01%)#622 |
| 2. | Gulfport | 362 | 3,847(9.41%)#2 | 4,544,093(0.01%)#859 |
| 3. | Gautier | 326 | 3,847(8.47%)#3 | 4,544,093(0.01%)#941 |
| 4. | Biloxi | 303 | 3,847(7.88%)#4 | 4,544,093(0.01%)#993 |
| 5. | Southaven | 159 | 3,847(4.13%)#5 | 4,544,093(0.00%)#1,563 |
| 6. | Jackson | 158 | 3,847(4.11%)#6 | 4,544,093(0.00%)#1,572 |
| 7. | Oxford | 133 | 3,847(3.46%)#7 | 4,544,093(0.00%)#1,742 |
| 8. | Hattiesburg | 103 | 3,847(2.68%)#8 | 4,544,093(0.00%)#2,038 |
| 9. | Forest | 98 | 3,847(2.55%)#9 | 4,544,093(0.00%)#2,113 |
| 10. | Vicksburg | 90 | 3,847(2.34%)#10 | 4,544,093(0.00%)#2,233 |
| 11. | Gulf Hills | 89 | 3,847(2.31%)#11 | 4,544,093(0.00%)#2,249 |
| 12. | Brandon | 67 | 3,847(1.74%)#12 | 4,544,093(0.00%)#2,603 |
| 13. | Ridgeland | 64 | 3,847(1.66%)#13 | 4,544,093(0.00%)#2,652 |
| 14. | Clinton | 61 | 3,847(1.59%)#14 | 4,544,093(0.00%)#2,720 |
| 15. | Ecru | 57 | 3,847(1.48%)#15 | 4,544,093(0.00%)#2,831 |
| 16. | Meridian | 56 | 3,847(1.46%)#16 | 4,544,093(0.00%)#2,837 |
| 17. | Bay St Louis | 55 | 3,847(1.43%)#17 | 4,544,093(0.00%)#2,870 |
| 18. | Pearl | 43 | 3,847(1.12%)#18 | 4,544,093(0.00%)#3,201 |
| 19. | Quitman | 41 | 3,847(1.07%)#19 | 4,544,093(0.00%)#3,292 |
| 20. | Olive Branch | 33 | 3,847(0.86%)#20 | 4,544,093(0.00%)#3,545 |
| 21. | Tunica | 29 | 3,847(0.75%)#21 | 4,544,093(0.00%)#3,758 |
| 22. | Long Beach | 23 | 3,847(0.60%)#22 | 4,544,093(0.00%)#4,051 |
| 23. | Moss Point | 23 | 3,847(0.60%)#23 | 4,544,093(0.00%)#4,054 |
| 24. | Verona | 23 | 3,847(0.60%)#24 | 4,544,093(0.00%)#4,075 |
| 25. | Ocean Springs | 22 | 3,847(0.57%)#25 | 4,544,093(0.00%)#4,097 |
| 26. | Horn Lake | 19 | 3,847(0.49%)#26 | 4,544,093(0.00%)#4,280 |
| 27. | Columbus | 17 | 3,847(0.44%)#27 | 4,544,093(0.00%)#4,433 |
| 28. | Hernando | 10 | 3,847(0.26%)#28 | 4,544,093(0.00%)#5,057 |
| 29. | Starkville | 9 | 3,847(0.23%)#29 | 4,544,093(0.00%)#5,183 |
| 30. | Brookhaven | 8 | 3,847(0.21%)#30 | 4,544,093(0.00%)#5,331 |
| 31. | D Iberville | 7 | 3,847(0.18%)#31 | 4,544,093(0.00%)#5,451 |
| 32. | Hazlehurst | 6 | 3,847(0.16%)#32 | 4,544,093(0.00%)#5,639 |
| 33. | Walls | 6 | 3,847(0.16%)#33 | 4,544,093(0.00%)#5,672 |
| 34. | Clarksdale | 5 | 3,847(0.13%)#34 | 4,544,093(0.00%)#5,728 |
| 35. | Marion | 5 | 3,847(0.13%)#35 | 4,544,093(0.00%)#5,781 |
| 36. | Blue Mountain | 5 | 3,847(0.13%)#36 | 4,544,093(0.00%)#5,815 |
| 37. | Cleveland | 4 | 3,847(0.10%)#37 | 4,544,093(0.00%)#5,875 |
| 38. | Madison | 3 | 3,847(0.08%)#38 | 4,544,093(0.00%)#5,995 |
| 39. | Ellisville | 3 | 3,847(0.08%)#39 | 4,544,093(0.00%)#6,021 |
| 40. | Edwards | 2 | 3,847(0.05%)#40 | 4,544,093(0.00%)#6,241 |
| 41. | Liberty | 2 | 3,847(0.05%)#41 | 4,544,093(0.00%)#6,243 |
| 42. | Artesia | 2 | 3,847(0.05%)#42 | 4,544,093(0.00%)#6,289 |
| 43. | Tutwiler | 1 | 3,847(0.03%)#43 | 4,544,093(0.00%)#6,376 |
| 44. | Sherman | 1 | 3,847(0.03%)#44 | 4,544,093(0.00%)#6,423 |
| 45. | Slate Springs | 1 | 3,847(0.03%)#45 | 4,544,093(0.00%)#6,473 |
Common Questions
What are the Top 10 Cities with the Most Immigrants from Caribbean in Mississippi?
Top 10 Cities with the Most Immigrants from Caribbean in Mississippi are:
#1
566
#2
362
#3
326
#4
303
#5
159
#6
158
#7
133
#8
103
#9
98
#10
90
What city has the Most Immigrants from Caribbean in Mississippi?
Pascagoula has the Most Immigrants from Caribbean in Mississippi with 566.
What is the Total Immigrants from Caribbean in the State of Mississippi?
Total Immigrants from Caribbean in Mississippi is 3,847.
What is the Total Immigrants from Caribbean in the United States?
Total Immigrants from Caribbean in the United States is 4,544,093.