Cities with the Most Immigrants from Caribbean in West Virginia
RELATED REPORTS & OPTIONS
Caribbean
West Virginia
Compare Cities
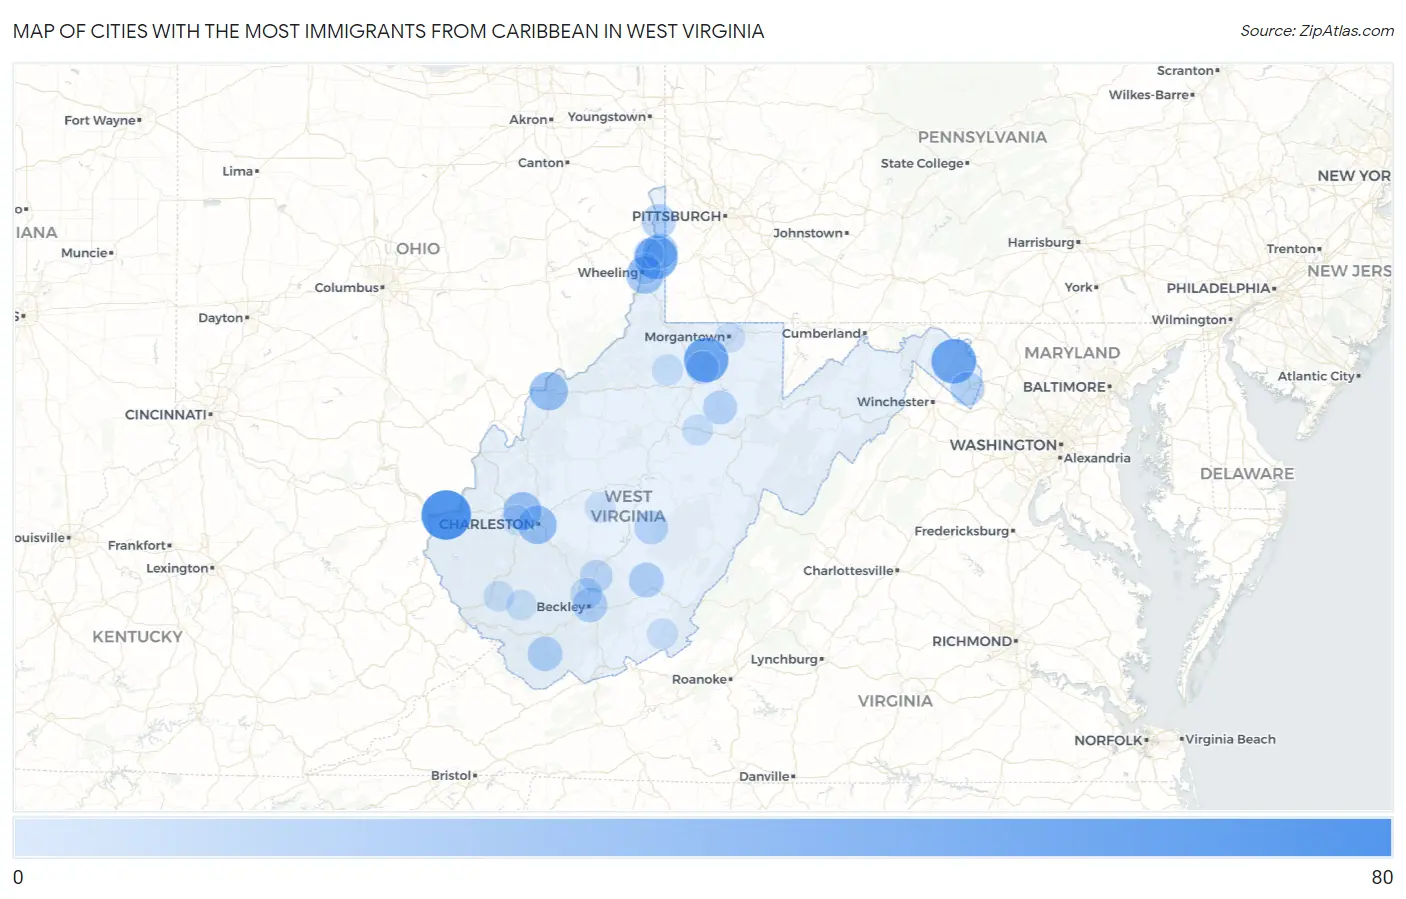
Map of Cities with the Most Immigrants from Caribbean in West Virginia
0
80
Cities with the Most Immigrants from Caribbean in West Virginia
| City | Caribbean | vs State | vs National | |
| 1. | Huntington | 76 | 1,588(4.79%)#1 | 4,544,093(0.00%)#2,436 |
| 2. | Martinsburg | 56 | 1,588(3.53%)#2 | 4,544,093(0.00%)#2,839 |
| 3. | Fairmont | 56 | 1,588(3.53%)#3 | 4,544,093(0.00%)#2,840 |
| 4. | West Liberty | 50 | 1,588(3.15%)#4 | 4,544,093(0.00%)#3,006 |
| 5. | Crooked Creek | 34 | 1,588(2.14%)#5 | 4,544,093(0.00%)#3,541 |
| 6. | Charleston | 32 | 1,588(2.02%)#6 | 4,544,093(0.00%)#3,588 |
| 7. | Parkersburg | 32 | 1,588(2.02%)#7 | 4,544,093(0.00%)#3,596 |
| 8. | Cross Lanes | 31 | 1,588(1.95%)#8 | 4,544,093(0.00%)#3,655 |
| 9. | Bethlehem | 28 | 1,588(1.76%)#9 | 4,544,093(0.00%)#3,809 |
| 10. | Bethany | 19 | 1,588(1.20%)#10 | 4,544,093(0.00%)#4,344 |
| 11. | Rupert | 18 | 1,588(1.13%)#11 | 4,544,093(0.00%)#4,421 |
| 12. | Beckley | 17 | 1,588(1.07%)#12 | 4,544,093(0.00%)#4,437 |
| 13. | Welch | 17 | 1,588(1.07%)#13 | 4,544,093(0.00%)#4,474 |
| 14. | Weirton | 16 | 1,588(1.01%)#14 | 4,544,093(0.00%)#4,503 |
| 15. | Charles Town | 14 | 1,588(0.88%)#15 | 4,544,093(0.00%)#4,691 |
| 16. | Philippi | 14 | 1,588(0.88%)#16 | 4,544,093(0.00%)#4,709 |
| 17. | Craigsville | 14 | 1,588(0.88%)#17 | 4,544,093(0.00%)#4,719 |
| 18. | White Hall | 11 | 1,588(0.69%)#18 | 4,544,093(0.00%)#5,026 |
| 19. | Oak Hill | 10 | 1,588(0.63%)#19 | 4,544,093(0.00%)#5,078 |
| 20. | Bradley | 7 | 1,588(0.44%)#20 | 4,544,093(0.00%)#5,537 |
| 21. | Buckhannon | 4 | 1,588(0.25%)#21 | 4,544,093(0.00%)#5,892 |
| 22. | Wallace | 4 | 1,588(0.25%)#22 | 4,544,093(0.00%)#5,992 |
| 23. | Wheeling | 3 | 1,588(0.19%)#23 | 4,544,093(0.00%)#5,996 |
| 24. | Logan | 3 | 1,588(0.19%)#24 | 4,544,093(0.00%)#6,047 |
| 25. | Clay | 3 | 1,588(0.19%)#25 | 4,544,093(0.00%)#6,129 |
| 26. | Union | 3 | 1,588(0.19%)#26 | 4,544,093(0.00%)#6,131 |
| 27. | Institute | 2 | 1,588(0.13%)#27 | 4,544,093(0.00%)#6,265 |
| 28. | Robinette | 2 | 1,588(0.13%)#28 | 4,544,093(0.00%)#6,273 |
| 29. | Morgantown | 1 | 1,588(0.06%)#29 | 4,544,093(0.00%)#6,314 |
| 30. | St Albans | 1 | 1,588(0.06%)#30 | 4,544,093(0.00%)#6,326 |
| 31. | Windsor Heights | 1 | 1,588(0.06%)#31 | 4,544,093(0.00%)#6,431 |
1
2Common Questions
What are the Top 10 Cities with the Most Immigrants from Caribbean in West Virginia?
Top 10 Cities with the Most Immigrants from Caribbean in West Virginia are:
#1
76
#2
56
#3
56
#4
50
#5
32
#6
32
#7
31
#8
28
#9
19
#10
18
What city has the Most Immigrants from Caribbean in West Virginia?
Huntington has the Most Immigrants from Caribbean in West Virginia with 76.
What is the Total Immigrants from Caribbean in the State of West Virginia?
Total Immigrants from Caribbean in West Virginia is 1,588.
What is the Total Immigrants from Caribbean in the United States?
Total Immigrants from Caribbean in the United States is 4,544,093.