Milford, MA
Milford Map
Milford Overview
27,569
TOTAL POPULATION
14,379
MALE POPULATION
13,190
FEMALE POPULATION
109.01
MALES / 100 FEMALES
91.73
FEMALES / 100 MALES
39.3
MEDIAN AGE
3.2
AVG FAMILY SIZE
2.6
AVG HOUSEHOLD SIZE
$42,761
PER CAPITA INCOME
$106,629
AVG FAMILY INCOME
$89,608
AVG HOUSEHOLD INCOME
40.6%
WAGE / INCOME GAP [ % ]
59.4¢/ $1
WAGE / INCOME GAP [ $ ]
0.41
INEQUALITY / GINI INDEX
16,067
LABOR FORCE [ PEOPLE ]
72.1%
PERCENT IN LABOR FORCE
5.9%
UNEMPLOYMENT RATE
Milford Zip Codes
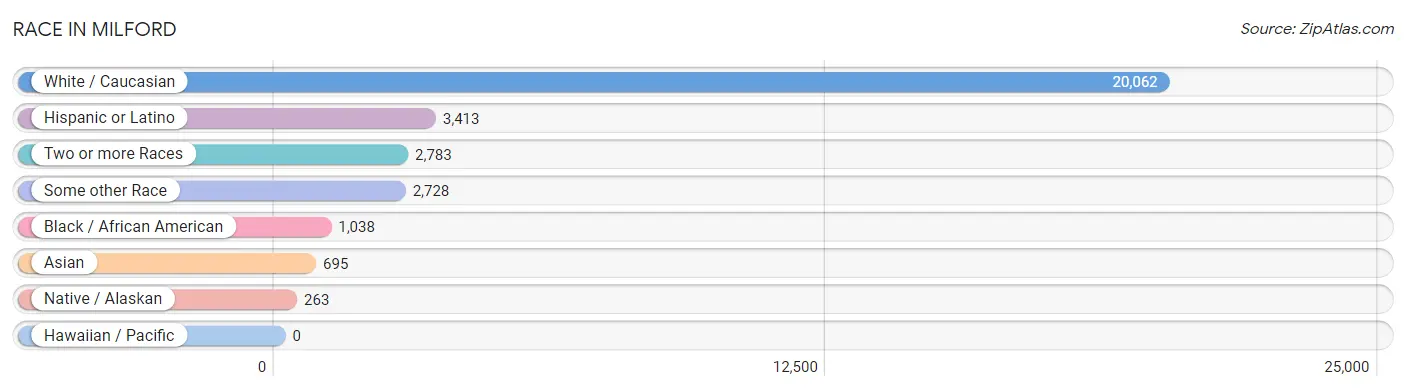
Race in Milford
The most populous races in Milford are White / Caucasian (20,062 | 72.8%), Hispanic or Latino (3,413 | 12.4%), and Two or more Races (2,783 | 10.1%).
| Race | # Population | % Population |
| Asian | 695 | 2.5% |
| Black / African American | 1,038 | 3.8% |
| Hawaiian / Pacific | 0 | 0.0% |
| Hispanic or Latino | 3,413 | 12.4% |
| Native / Alaskan | 263 | 0.9% |
| White / Caucasian | 20,062 | 72.8% |
| Two or more Races | 2,783 | 10.1% |
| Some other Race | 2,728 | 9.9% |
| Total | 27,569 | 100.0% |
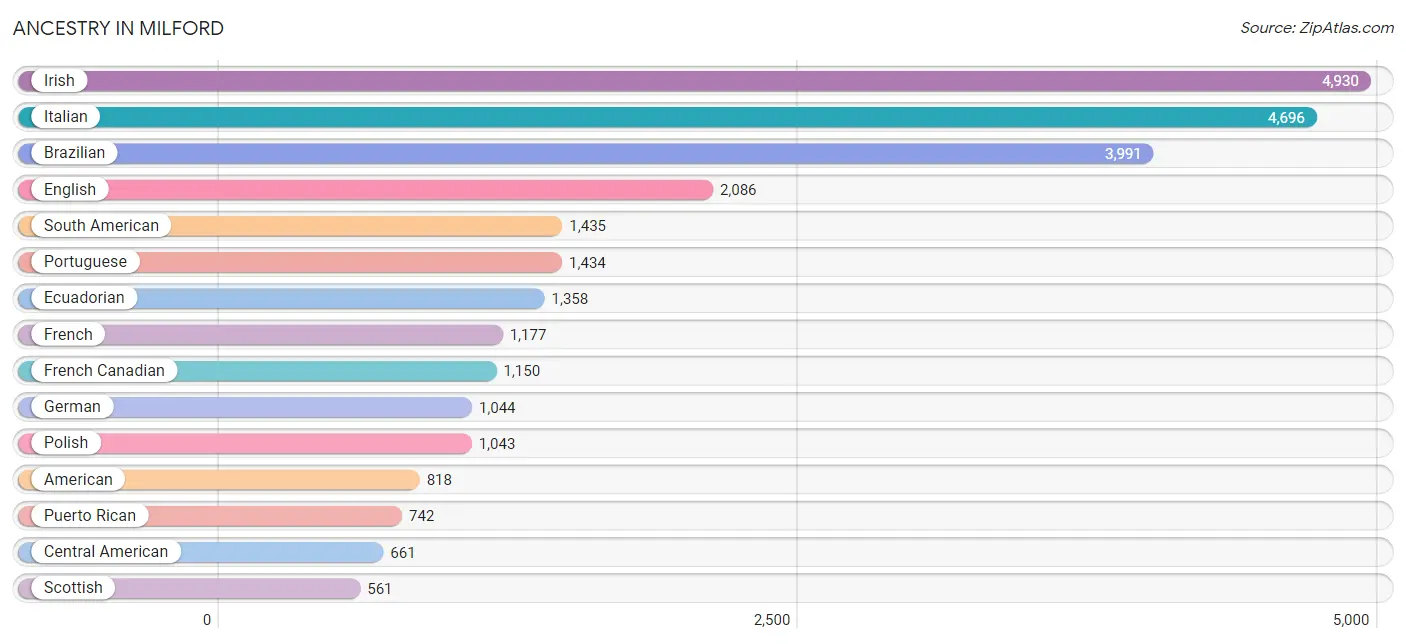
Ancestry in Milford
The most populous ancestries reported in Milford are Irish (4,930 | 17.9%), Italian (4,696 | 17.0%), Brazilian (3,991 | 14.5%), English (2,086 | 7.6%), and South American (1,435 | 5.2%), together accounting for 62.2% of all Milford residents.
| Ancestry | # Population | % Population |
| African | 177 | 0.6% |
| American | 818 | 3.0% |
| Arab | 299 | 1.1% |
| Armenian | 126 | 0.5% |
| Austrian | 14 | 0.1% |
| Bhutanese | 15 | 0.1% |
| Brazilian | 3,991 | 14.5% |
| British | 68 | 0.3% |
| Bulgarian | 15 | 0.1% |
| Burmese | 117 | 0.4% |
| Canadian | 88 | 0.3% |
| Cape Verdean | 59 | 0.2% |
| Central American | 661 | 2.4% |
| Central American Indian | 57 | 0.2% |
| Cherokee | 3 | 0.0% |
| Colombian | 38 | 0.1% |
| Cuban | 95 | 0.3% |
| Danish | 12 | 0.0% |
| Dominican | 325 | 1.2% |
| Dutch | 152 | 0.5% |
| Eastern European | 136 | 0.5% |
| Ecuadorian | 1,358 | 4.9% |
| Egyptian | 74 | 0.3% |
| English | 2,086 | 7.6% |
| European | 235 | 0.9% |
| Finnish | 15 | 0.1% |
| French | 1,177 | 4.3% |
| French Canadian | 1,150 | 4.2% |
| German | 1,044 | 3.8% |
| Ghanaian | 17 | 0.1% |
| Greek | 258 | 0.9% |
| Guatemalan | 142 | 0.5% |
| Guyanese | 49 | 0.2% |
| Haitian | 345 | 1.3% |
| Hungarian | 129 | 0.5% |
| Indian (Asian) | 77 | 0.3% |
| Irish | 4,930 | 17.9% |
| Italian | 4,696 | 17.0% |
| Korean | 106 | 0.4% |
| Laotian | 16 | 0.1% |
| Latvian | 10 | 0.0% |
| Lebanese | 128 | 0.5% |
| Lithuanian | 57 | 0.2% |
| Mexican | 62 | 0.2% |
| Moroccan | 55 | 0.2% |
| Northern European | 5 | 0.0% |
| Pakistani | 17 | 0.1% |
| Polish | 1,043 | 3.8% |
| Portuguese | 1,434 | 5.2% |
| Potawatomi | 14 | 0.1% |
| Puerto Rican | 742 | 2.7% |
| Russian | 94 | 0.3% |
| Salvadoran | 519 | 1.9% |
| Scandinavian | 68 | 0.3% |
| Scotch-Irish | 146 | 0.5% |
| Scottish | 561 | 2.0% |
| Slovak | 20 | 0.1% |
| South American | 1,435 | 5.2% |
| Spanish | 14 | 0.1% |
| Sri Lankan | 50 | 0.2% |
| Subsaharan African | 561 | 2.0% |
| Swedish | 142 | 0.5% |
| Syrian | 45 | 0.2% |
| Thai | 246 | 0.9% |
| Trinidadian and Tobagonian | 9 | 0.0% |
| Ukrainian | 41 | 0.2% |
| Welsh | 25 | 0.1% |
| West Indian | 4 | 0.0% |
| Yugoslavian | 9 | 0.0% | View All 69 Rows |
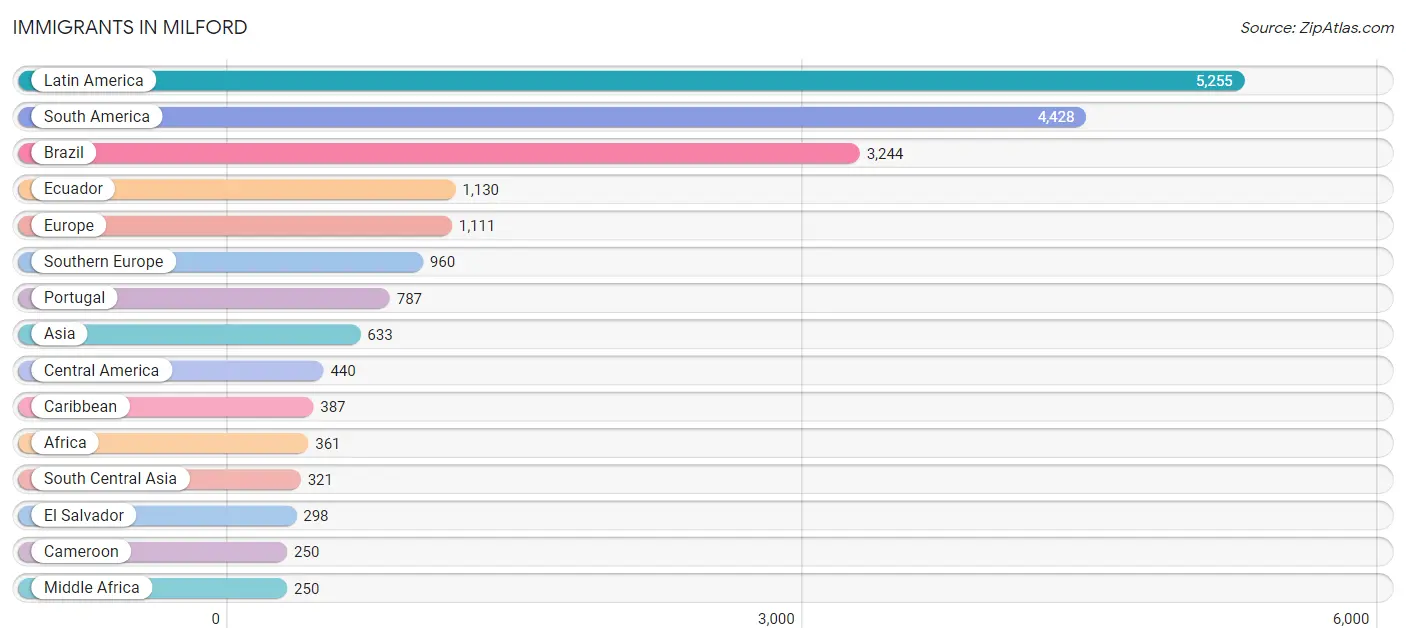
Immigrants in Milford
The most numerous immigrant groups reported in Milford came from Latin America (5,255 | 19.1%), South America (4,428 | 16.1%), Brazil (3,244 | 11.8%), Ecuador (1,130 | 4.1%), and Europe (1,111 | 4.0%), together accounting for 55.0% of all Milford residents.
| Immigration Origin | # Population | % Population |
| Africa | 361 | 1.3% |
| Asia | 633 | 2.3% |
| Azores | 11 | 0.0% |
| Brazil | 3,244 | 11.8% |
| Bulgaria | 15 | 0.1% |
| Cameroon | 250 | 0.9% |
| Canada | 183 | 0.7% |
| Caribbean | 387 | 1.4% |
| Central America | 440 | 1.6% |
| China | 40 | 0.2% |
| Cuba | 74 | 0.3% |
| Dominican Republic | 156 | 0.6% |
| Eastern Asia | 157 | 0.6% |
| Eastern Europe | 15 | 0.1% |
| Ecuador | 1,130 | 4.1% |
| Egypt | 62 | 0.2% |
| El Salvador | 298 | 1.1% |
| England | 17 | 0.1% |
| Europe | 1,111 | 4.0% |
| France | 74 | 0.3% |
| Germany | 28 | 0.1% |
| Ghana | 22 | 0.1% |
| Greece | 97 | 0.4% |
| Guatemala | 126 | 0.5% |
| Guyana | 54 | 0.2% |
| Haiti | 148 | 0.5% |
| Hong Kong | 2 | 0.0% |
| India | 248 | 0.9% |
| Ireland | 17 | 0.1% |
| Italy | 76 | 0.3% |
| Korea | 117 | 0.4% |
| Latin America | 5,255 | 19.1% |
| Lebanon | 49 | 0.2% |
| Mexico | 16 | 0.1% |
| Middle Africa | 250 | 0.9% |
| Morocco | 27 | 0.1% |
| Northern Africa | 89 | 0.3% |
| Northern Europe | 34 | 0.1% |
| Pakistan | 73 | 0.3% |
| Philippines | 38 | 0.1% |
| Portugal | 787 | 2.9% |
| South America | 4,428 | 16.1% |
| South Central Asia | 321 | 1.2% |
| South Eastern Asia | 79 | 0.3% |
| Southern Europe | 960 | 3.5% |
| Syria | 27 | 0.1% |
| Thailand | 17 | 0.1% |
| Trinidad and Tobago | 9 | 0.0% |
| Vietnam | 24 | 0.1% |
| Western Africa | 22 | 0.1% |
| Western Asia | 76 | 0.3% |
| Western Europe | 102 | 0.4% | View All 52 Rows |
Sex and Age in Milford
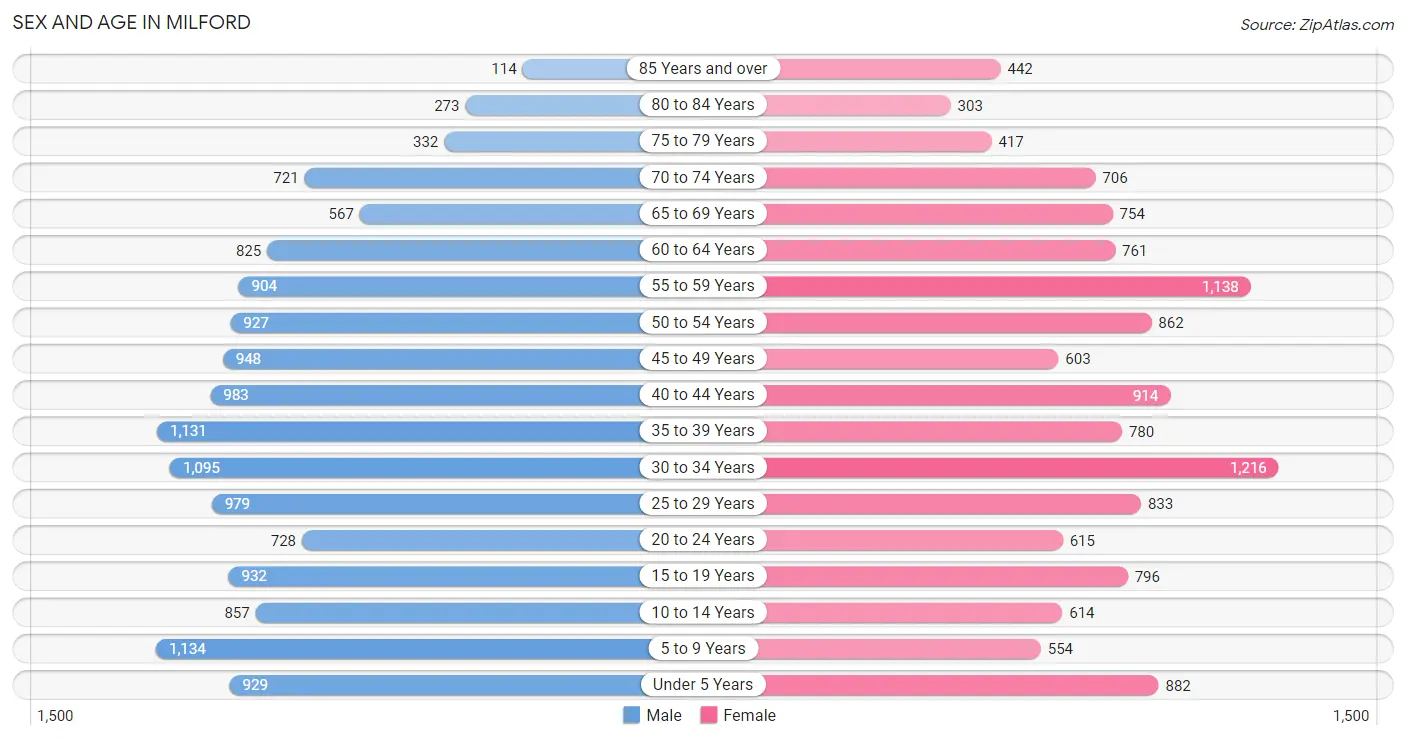
Sex and Age in Milford
The most populous age groups in Milford are 5 to 9 Years (1,134 | 7.9%) for men and 30 to 34 Years (1,216 | 9.2%) for women.
| Age Bracket | Male | Female |
| Under 5 Years | 929 (6.5%) | 882 (6.7%) |
| 5 to 9 Years | 1,134 (7.9%) | 554 (4.2%) |
| 10 to 14 Years | 857 (6.0%) | 614 (4.7%) |
| 15 to 19 Years | 932 (6.5%) | 796 (6.0%) |
| 20 to 24 Years | 728 (5.1%) | 615 (4.7%) |
| 25 to 29 Years | 979 (6.8%) | 833 (6.3%) |
| 30 to 34 Years | 1,095 (7.6%) | 1,216 (9.2%) |
| 35 to 39 Years | 1,131 (7.9%) | 780 (5.9%) |
| 40 to 44 Years | 983 (6.8%) | 914 (6.9%) |
| 45 to 49 Years | 948 (6.6%) | 603 (4.6%) |
| 50 to 54 Years | 927 (6.5%) | 862 (6.5%) |
| 55 to 59 Years | 904 (6.3%) | 1,138 (8.6%) |
| 60 to 64 Years | 825 (5.7%) | 761 (5.8%) |
| 65 to 69 Years | 567 (3.9%) | 754 (5.7%) |
| 70 to 74 Years | 721 (5.0%) | 706 (5.3%) |
| 75 to 79 Years | 332 (2.3%) | 417 (3.2%) |
| 80 to 84 Years | 273 (1.9%) | 303 (2.3%) |
| 85 Years and over | 114 (0.8%) | 442 (3.4%) |
| Total | 14,379 (100.0%) | 13,190 (100.0%) |
Families and Households in Milford
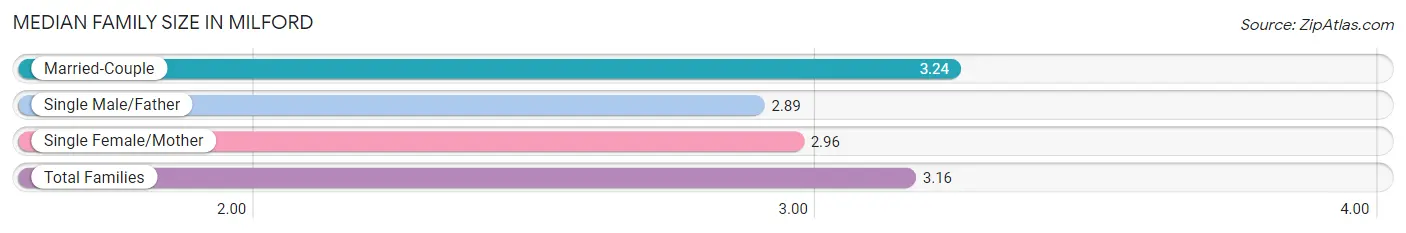
Median Family Size in Milford
The median family size in Milford is 3.16 persons per family, with married-couple families (5,160 | 73.1%) accounting for the largest median family size of 3.24 persons per family. On the other hand, single male/father families (549 | 7.8%) represent the smallest median family size with 2.89 persons per family.
| Family Type | # Families | Family Size |
| Married-Couple | 5,160 (73.1%) | 3.24 |
| Single Male/Father | 549 (7.8%) | 2.89 |
| Single Female/Mother | 1,347 (19.1%) | 2.96 |
| Total Families | 7,056 (100.0%) | 3.16 |
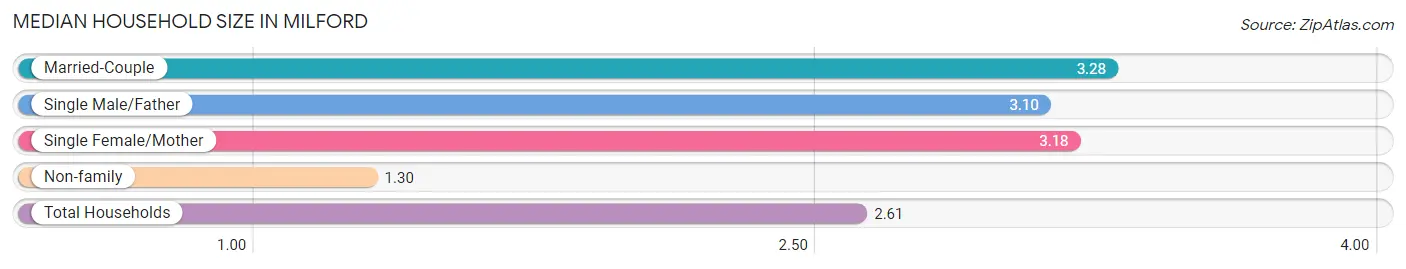
Median Household Size in Milford
The median household size in Milford is 2.61 persons per household, with married-couple households (5,160 | 49.3%) accounting for the largest median household size of 3.28 persons per household. non-family households (3,416 | 32.6%) represent the smallest median household size with 1.30 persons per household.
| Household Type | # Households | Household Size |
| Married-Couple | 5,160 (49.3%) | 3.28 |
| Single Male/Father | 549 (5.2%) | 3.10 |
| Single Female/Mother | 1,347 (12.9%) | 3.18 |
| Non-family | 3,416 (32.6%) | 1.30 |
| Total Households | 10,472 (100.0%) | 2.61 |
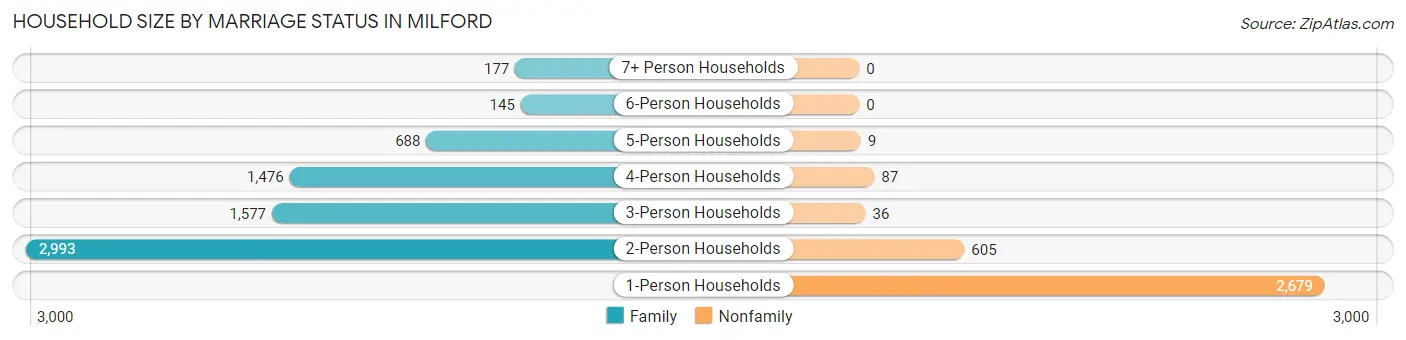
Household Size by Marriage Status in Milford
Out of a total of 10,472 households in Milford, 7,056 (67.4%) are family households, while 3,416 (32.6%) are nonfamily households. The most numerous type of family households are 2-person households, comprising 2,993, and the most common type of nonfamily households are 1-person households, comprising 2,679.
| Household Size | Family Households | Nonfamily Households |
| 1-Person Households | - | 2,679 (25.6%) |
| 2-Person Households | 2,993 (28.6%) | 605 (5.8%) |
| 3-Person Households | 1,577 (15.1%) | 36 (0.3%) |
| 4-Person Households | 1,476 (14.1%) | 87 (0.8%) |
| 5-Person Households | 688 (6.6%) | 9 (0.1%) |
| 6-Person Households | 145 (1.4%) | 0 (0.0%) |
| 7+ Person Households | 177 (1.7%) | 0 (0.0%) |
| Total | 7,056 (67.4%) | 3,416 (32.6%) |
Female Fertility in Milford
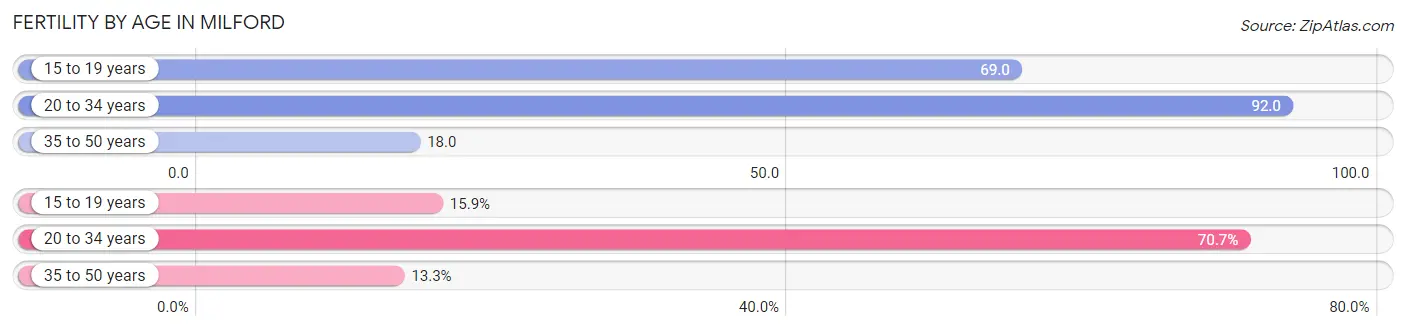
Fertility by Age in Milford
Average fertility rate in Milford is 58.0 births per 1,000 women. Women in the age bracket of 20 to 34 years have the highest fertility rate with 92.0 births per 1,000 women. Women in the age bracket of 20 to 34 years acount for 70.7% of all women with births.
| Age Bracket | Women with Births | Births / 1,000 Women |
| 15 to 19 years | 55 (15.9%) | 69.0 |
| 20 to 34 years | 244 (70.7%) | 92.0 |
| 35 to 50 years | 46 (13.3%) | 18.0 |
| Total | 345 (100.0%) | 58.0 |
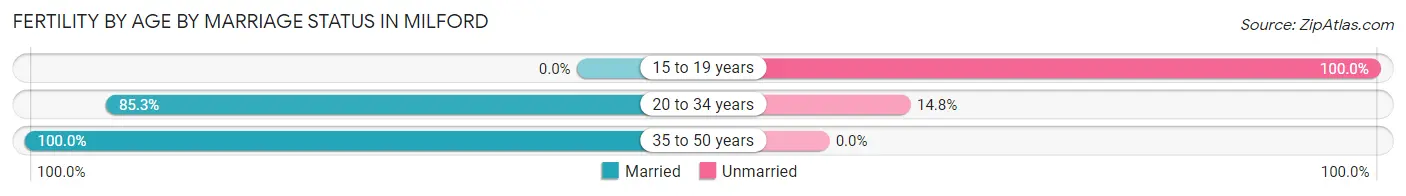
Fertility by Age by Marriage Status in Milford
73.6% of women with births (345) in Milford are married. The highest percentage of unmarried women with births falls into 15 to 19 years age bracket with 100.0% of them unmarried at the time of birth, while the lowest percentage of unmarried women with births belong to 35 to 50 years age bracket with 0.0% of them unmarried.
| Age Bracket | Married | Unmarried |
| 15 to 19 years | 0 (0.0%) | 55 (100.0%) |
| 20 to 34 years | 208 (85.3%) | 36 (14.7%) |
| 35 to 50 years | 46 (100.0%) | 0 (0.0%) |
| Total | 254 (73.6%) | 91 (26.4%) |
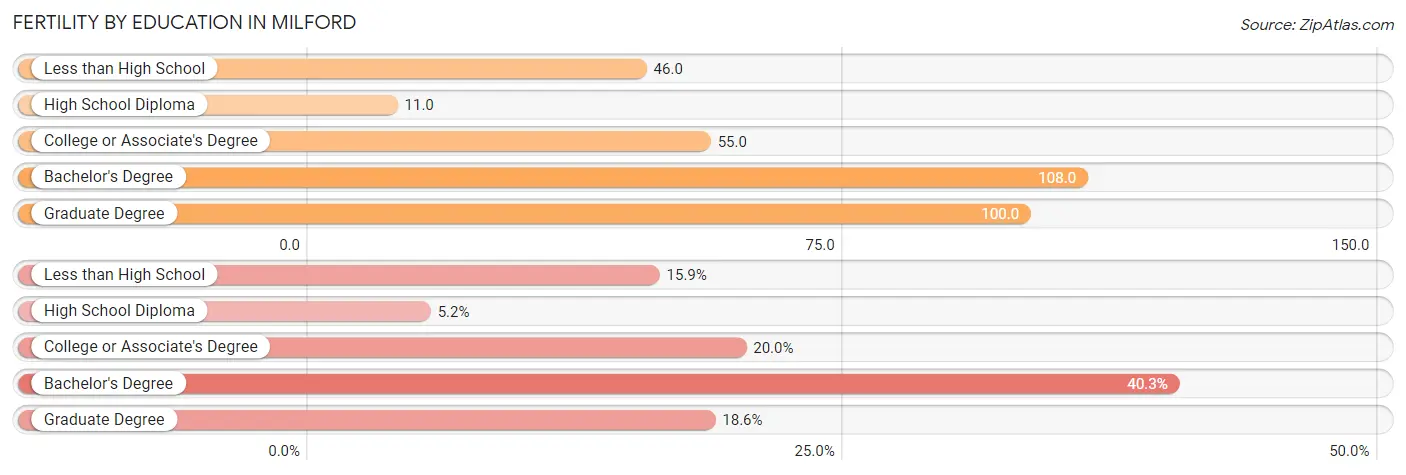
Fertility by Education in Milford
Average fertility rate in Milford is 58.0 births per 1,000 women. Women with the education attainment of bachelor's degree have the highest fertility rate of 108.0 births per 1,000 women, while women with the education attainment of high school diploma have the lowest fertility at 11.0 births per 1,000 women. Women with the education attainment of bachelor's degree represent 40.3% of all women with births.
| Educational Attainment | Women with Births | Births / 1,000 Women |
| Less than High School | 55 (15.9%) | 46.0 |
| High School Diploma | 18 (5.2%) | 11.0 |
| College or Associate's Degree | 69 (20.0%) | 55.0 |
| Bachelor's Degree | 139 (40.3%) | 108.0 |
| Graduate Degree | 64 (18.5%) | 100.0 |
| Total | 345 (100.0%) | 58.0 |
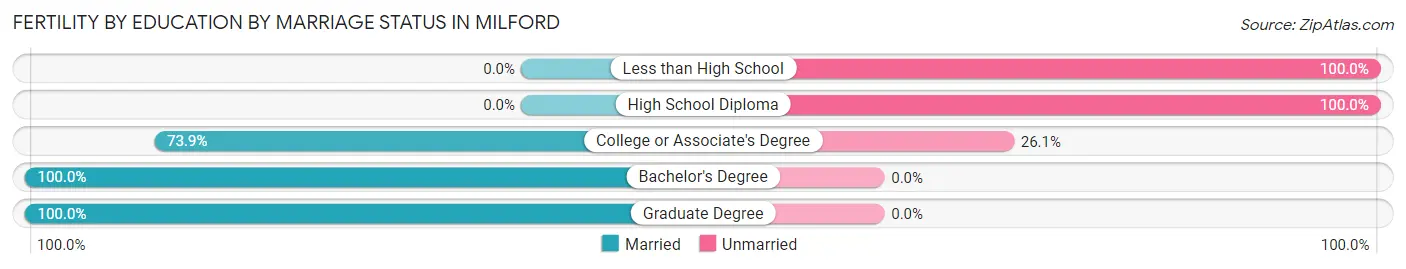
Fertility by Education by Marriage Status in Milford
26.4% of women with births in Milford are unmarried. Women with the educational attainment of bachelor's degree are most likely to be married with 100.0% of them married at childbirth, while women with the educational attainment of less than high school are least likely to be married with 100.0% of them unmarried at childbirth.
| Educational Attainment | Married | Unmarried |
| Less than High School | 0 (0.0%) | 55 (100.0%) |
| High School Diploma | 0 (0.0%) | 18 (100.0%) |
| College or Associate's Degree | 51 (73.9%) | 18 (26.1%) |
| Bachelor's Degree | 139 (100.0%) | 0 (0.0%) |
| Graduate Degree | 64 (100.0%) | 0 (0.0%) |
| Total | 254 (73.6%) | 91 (26.4%) |
Income in Milford
Income Overview in Milford
Per Capita Income in Milford is $42,761, while median incomes of families and households are $106,629 and $89,608 respectively.
| Characteristic | Number | Measure |
| Per Capita Income | 27,569 | $42,761 |
| Median Family Income | 7,056 | $106,629 |
| Mean Family Income | 7,056 | $127,862 |
| Median Household Income | 10,472 | $89,608 |
| Mean Household Income | 10,472 | $110,826 |
| Income Deficit | 7,056 | $0 |
| Wage / Income Gap (%) | 27,569 | 40.62% |
| Wage / Income Gap ($) | 27,569 | 59.38¢ per $1 |
| Gini / Inequality Index | 27,569 | 0.41 |
Earnings by Sex in Milford
Average Earnings in Milford are $46,419, $55,890 for men and $33,186 for women, a difference of 40.6%.
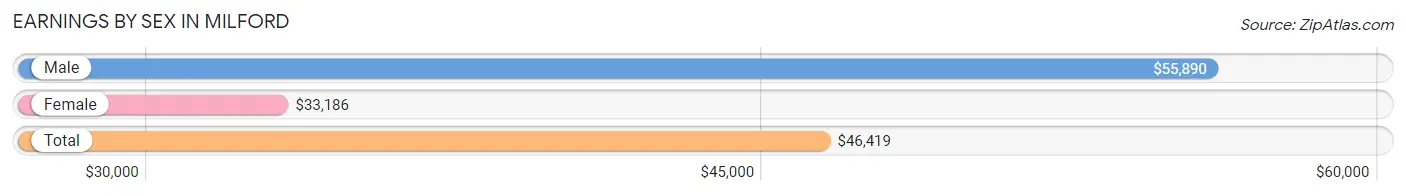
| Sex | Number | Average Earnings |
| Male | 8,938 (54.7%) | $55,890 |
| Female | 7,393 (45.3%) | $33,186 |
| Total | 16,331 (100.0%) | $46,419 |
Earnings by Sex by Income Bracket in Milford
The most common earnings brackets in Milford are $100,000+ for men (1,926 | 21.5%) and $75,000 to $99,999 for women (911 | 12.3%).
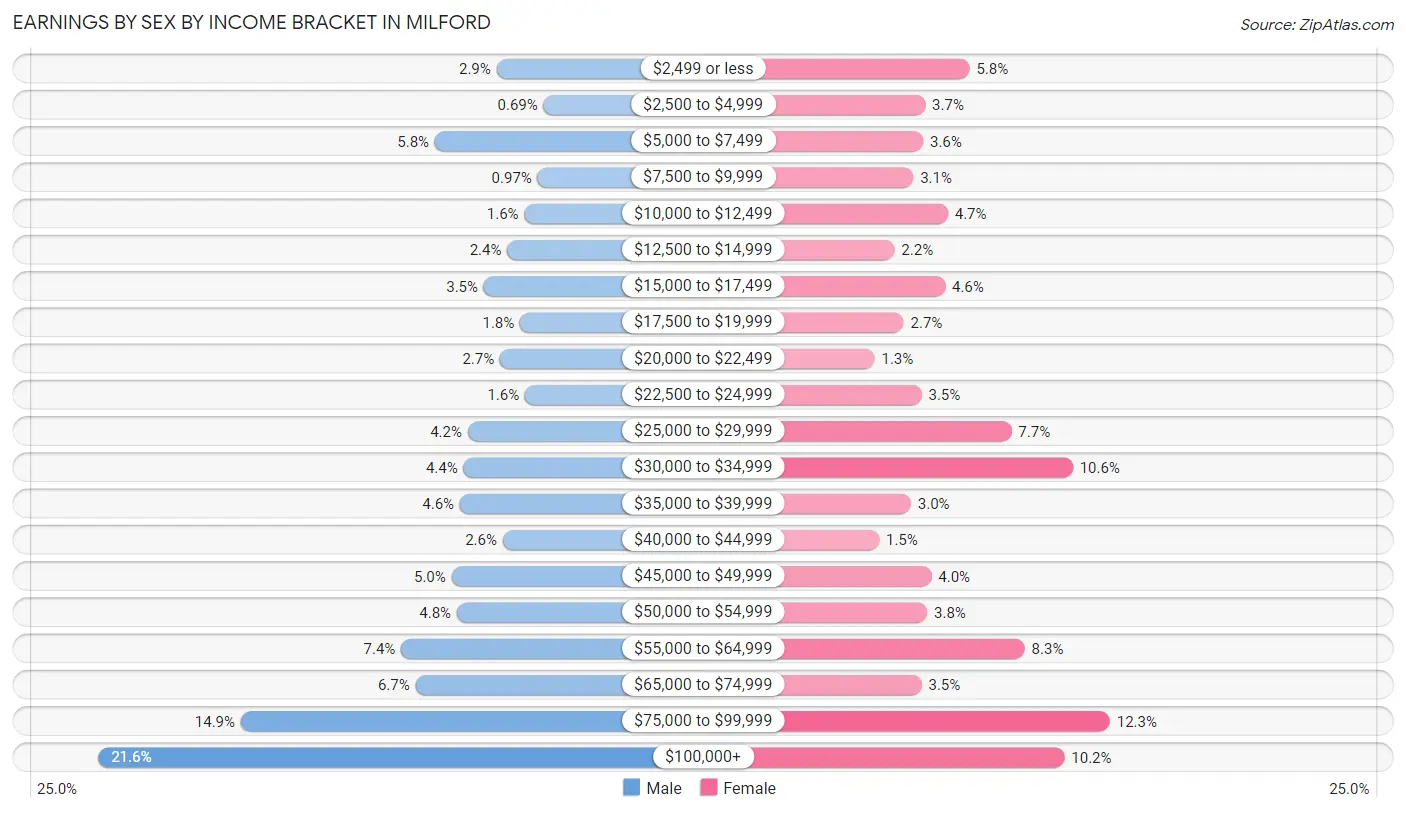
| Income | Male | Female |
| $2,499 or less | 258 (2.9%) | 425 (5.8%) |
| $2,500 to $4,999 | 62 (0.7%) | 271 (3.7%) |
| $5,000 to $7,499 | 517 (5.8%) | 264 (3.6%) |
| $7,500 to $9,999 | 87 (1.0%) | 230 (3.1%) |
| $10,000 to $12,499 | 142 (1.6%) | 350 (4.7%) |
| $12,500 to $14,999 | 214 (2.4%) | 165 (2.2%) |
| $15,000 to $17,499 | 312 (3.5%) | 340 (4.6%) |
| $17,500 to $19,999 | 160 (1.8%) | 197 (2.7%) |
| $20,000 to $22,499 | 244 (2.7%) | 96 (1.3%) |
| $22,500 to $24,999 | 139 (1.6%) | 259 (3.5%) |
| $25,000 to $29,999 | 379 (4.2%) | 570 (7.7%) |
| $30,000 to $34,999 | 397 (4.4%) | 782 (10.6%) |
| $35,000 to $39,999 | 412 (4.6%) | 222 (3.0%) |
| $40,000 to $44,999 | 232 (2.6%) | 112 (1.5%) |
| $45,000 to $49,999 | 447 (5.0%) | 293 (4.0%) |
| $50,000 to $54,999 | 425 (4.8%) | 278 (3.8%) |
| $55,000 to $64,999 | 658 (7.4%) | 616 (8.3%) |
| $65,000 to $74,999 | 598 (6.7%) | 259 (3.5%) |
| $75,000 to $99,999 | 1,329 (14.9%) | 911 (12.3%) |
| $100,000+ | 1,926 (21.5%) | 753 (10.2%) |
| Total | 8,938 (100.0%) | 7,393 (100.0%) |
Earnings by Sex by Educational Attainment in Milford
Average earnings in Milford are $63,292 for men and $38,232 for women, a difference of 39.6%. Men with an educational attainment of graduate degree enjoy the highest average annual earnings of $126,744, while those with less than high school education earn the least with $41,488. Women with an educational attainment of graduate degree earn the most with the average annual earnings of $75,815, while those with less than high school education have the smallest earnings of $25,947.
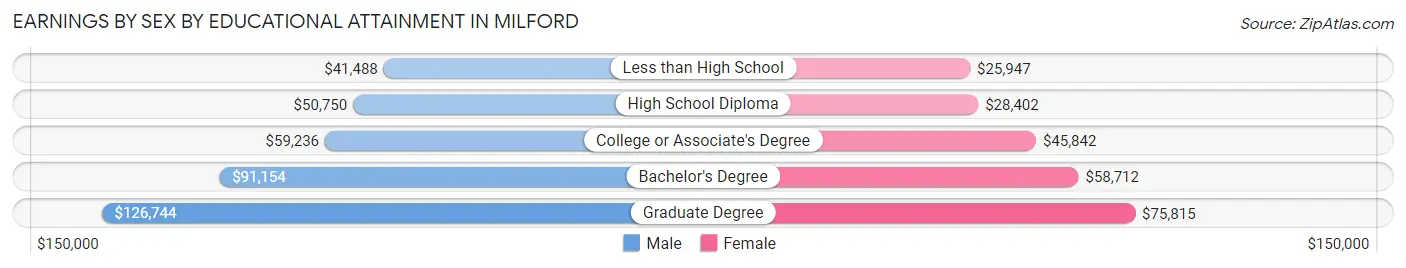
| Educational Attainment | Male Income | Female Income |
| Less than High School | $41,488 | $25,947 |
| High School Diploma | $50,750 | $28,402 |
| College or Associate's Degree | $59,236 | $45,842 |
| Bachelor's Degree | $91,154 | $58,712 |
| Graduate Degree | $126,744 | $75,815 |
| Total | $63,292 | $38,232 |
Family Income in Milford
Family Income Brackets in Milford
According to the Milford family income data, there are 1,573 families falling into the $100,000 to $149,999 income range, which is the most common income bracket and makes up 22.3% of all families. Conversely, the $10,000 to $14,999 income bracket is the least frequent group with only 49 families (0.7%) belonging to this category.
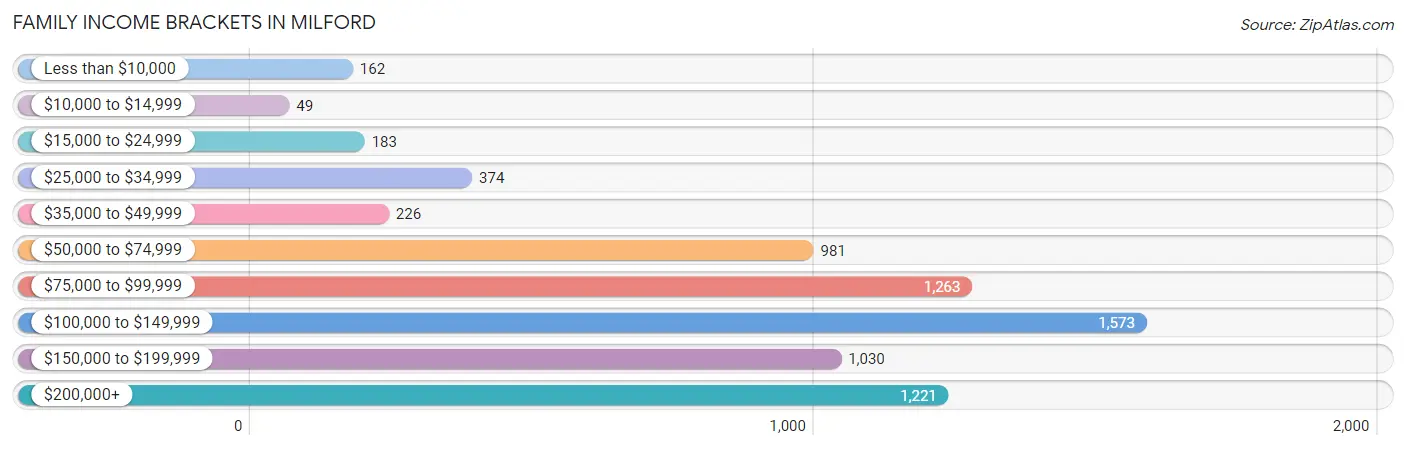
| Income Bracket | # Families | % Families |
| Less than $10,000 | 162 | 2.3% |
| $10,000 to $14,999 | 49 | 0.7% |
| $15,000 to $24,999 | 183 | 2.6% |
| $25,000 to $34,999 | 374 | 5.3% |
| $35,000 to $49,999 | 226 | 3.2% |
| $50,000 to $74,999 | 981 | 13.9% |
| $75,000 to $99,999 | 1,263 | 17.9% |
| $100,000 to $149,999 | 1,573 | 22.3% |
| $150,000 to $199,999 | 1,030 | 14.6% |
| $200,000+ | 1,221 | 17.3% |
Family Income by Famaliy Size in Milford
7+ person families (177 | 2.5%) account for the highest median family income in Milford with $163,149 per family, while 2-person families (3,149 | 44.6%) have the highest median income of $49,630 per family member.
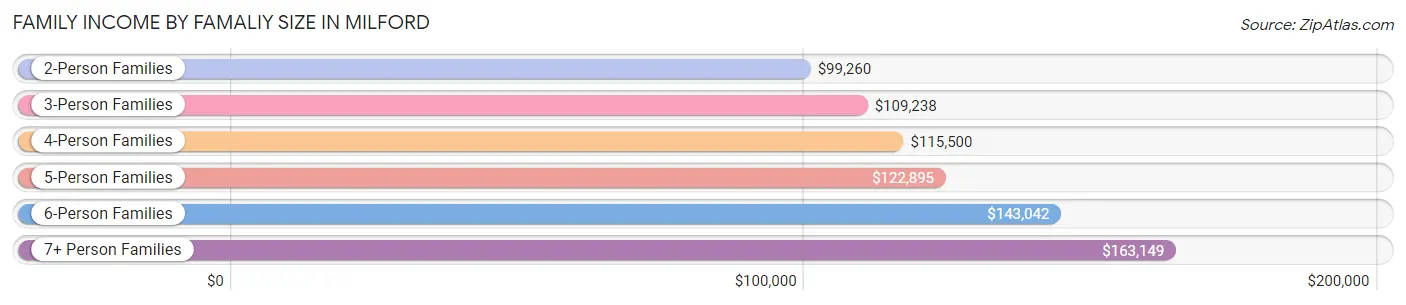
| Income Bracket | # Families | Median Income |
| 2-Person Families | 3,149 (44.6%) | $99,260 |
| 3-Person Families | 1,607 (22.8%) | $109,238 |
| 4-Person Families | 1,424 (20.2%) | $115,500 |
| 5-Person Families | 574 (8.1%) | $122,895 |
| 6-Person Families | 125 (1.8%) | $143,042 |
| 7+ Person Families | 177 (2.5%) | $163,149 |
| Total | 7,056 (100.0%) | $106,629 |
Family Income by Number of Earners in Milford
The median family income in Milford is $106,629, with families comprising 3+ earners (1,316) having the highest median family income of $151,759, while families with no earners (826) have the lowest median family income of $60,027, accounting for 18.6% and 11.7% of families, respectively.
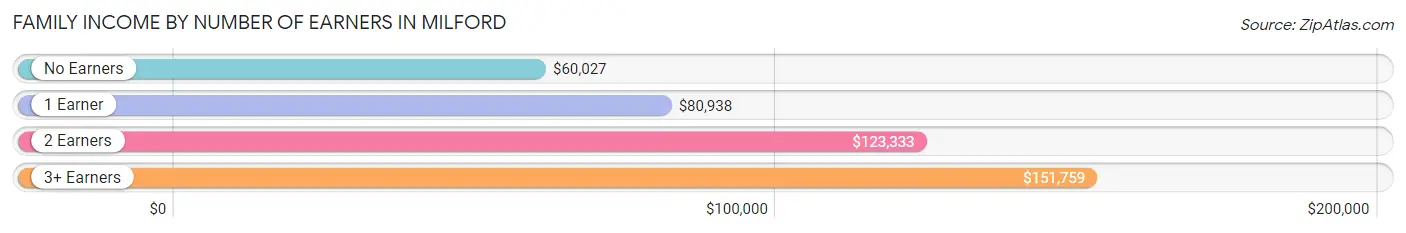
| Number of Earners | # Families | Median Income |
| No Earners | 826 (11.7%) | $60,027 |
| 1 Earner | 1,626 (23.0%) | $80,938 |
| 2 Earners | 3,288 (46.6%) | $123,333 |
| 3+ Earners | 1,316 (18.6%) | $151,759 |
| Total | 7,056 (100.0%) | $106,629 |
Household Income in Milford
Household Income Brackets in Milford
With 1,812 households falling in the category, the $75,000 to $99,999 income range is the most frequent in Milford, accounting for 17.3% of all households. In contrast, only 230 households (2.2%) fall into the $10,000 to $14,999 income bracket, making it the least populous group.
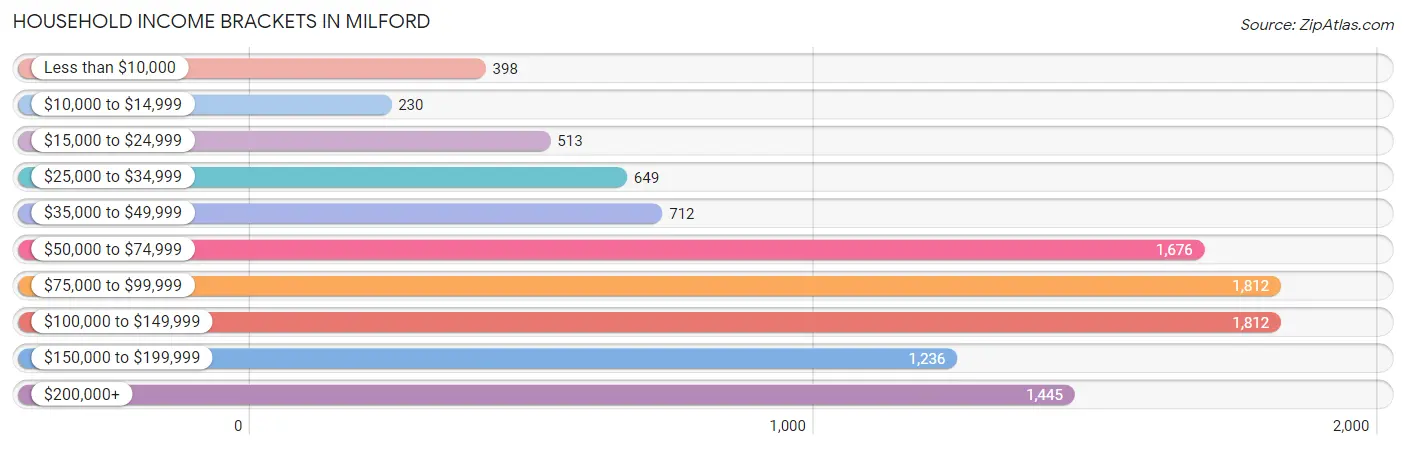
| Income Bracket | # Households | % Households |
| Less than $10,000 | 398 | 3.8% |
| $10,000 to $14,999 | 230 | 2.2% |
| $15,000 to $24,999 | 513 | 4.9% |
| $25,000 to $34,999 | 649 | 6.2% |
| $35,000 to $49,999 | 712 | 6.8% |
| $50,000 to $74,999 | 1,676 | 16.0% |
| $75,000 to $99,999 | 1,812 | 17.3% |
| $100,000 to $149,999 | 1,812 | 17.3% |
| $150,000 to $199,999 | 1,236 | 11.8% |
| $200,000+ | 1,445 | 13.8% |
Household Income by Householder Age in Milford
The median household income in Milford is $89,608, with the highest median household income of $104,457 found in the 45 to 64 years age bracket for the primary householder. A total of 3,983 households (38.0%) fall into this category. Meanwhile, the 15 to 24 years age bracket for the primary householder has the lowest median household income of $0, with 19 households (0.2%) in this group.
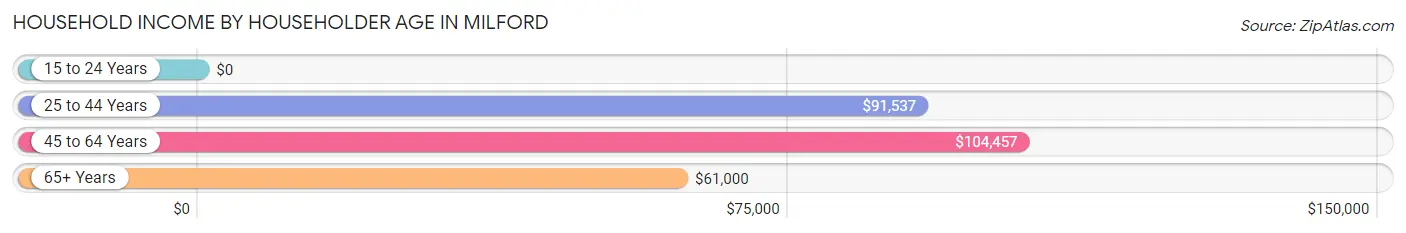
| Income Bracket | # Households | Median Income |
| 15 to 24 Years | 19 (0.2%) | $0 |
| 25 to 44 Years | 3,642 (34.8%) | $91,537 |
| 45 to 64 Years | 3,983 (38.0%) | $104,457 |
| 65+ Years | 2,828 (27.0%) | $61,000 |
| Total | 10,472 (100.0%) | $89,608 |
Poverty in Milford
Income Below Poverty by Sex and Age in Milford
With 9.6% poverty level for males and 10.6% for females among the residents of Milford, under 5 year old males and 15 year old females are the most vulnerable to poverty, with 232 males (27.5%) and 119 females (65.7%) in their respective age groups living below the poverty level.
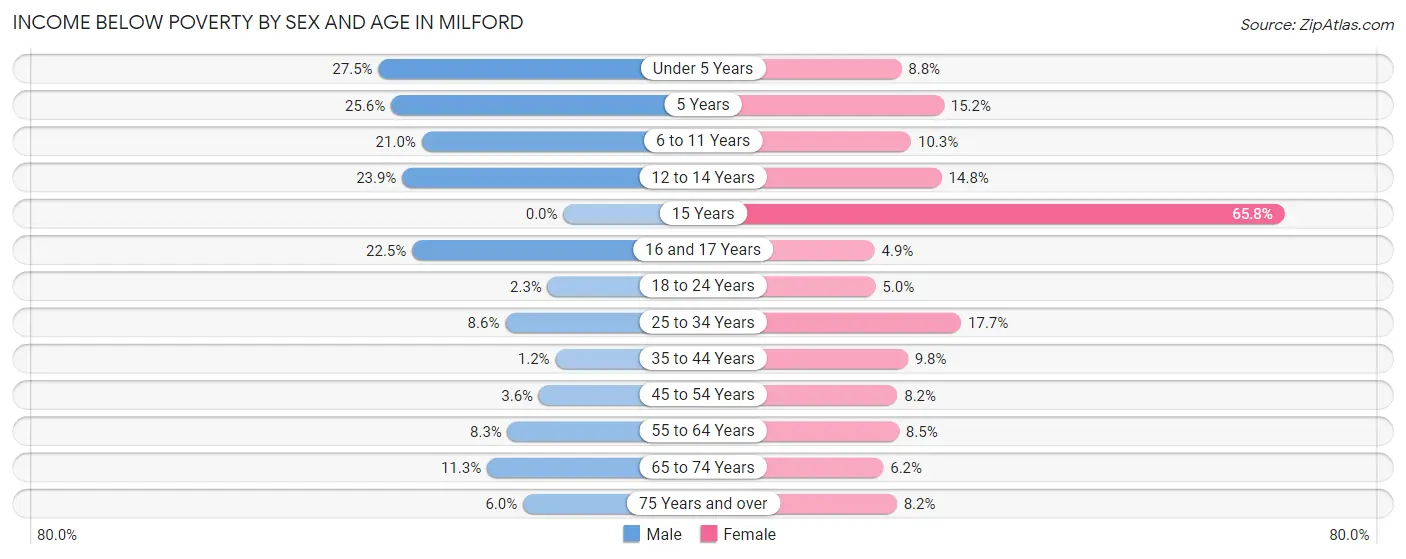
| Age Bracket | Male | Female |
| Under 5 Years | 232 (27.5%) | 78 (8.8%) |
| 5 Years | 77 (25.6%) | 15 (15.1%) |
| 6 to 11 Years | 234 (21.0%) | 65 (10.3%) |
| 12 to 14 Years | 117 (23.9%) | 62 (14.8%) |
| 15 Years | 0 (0.0%) | 119 (65.7%) |
| 16 and 17 Years | 73 (22.5%) | 15 (4.9%) |
| 18 to 24 Years | 28 (2.3%) | 46 (5.0%) |
| 25 to 34 Years | 179 (8.6%) | 363 (17.7%) |
| 35 to 44 Years | 25 (1.2%) | 166 (9.8%) |
| 45 to 54 Years | 68 (3.6%) | 120 (8.2%) |
| 55 to 64 Years | 143 (8.3%) | 161 (8.5%) |
| 65 to 74 Years | 146 (11.3%) | 89 (6.2%) |
| 75 Years and over | 41 (6.0%) | 88 (8.2%) |
| Total | 1,363 (9.6%) | 1,387 (10.6%) |
Income Above Poverty by Sex and Age in Milford
According to the poverty statistics in Milford, males aged 15 years and females aged 16 and 17 years are the age groups that are most secure financially, with 100.0% of males and 95.1% of females in these age groups living above the poverty line.
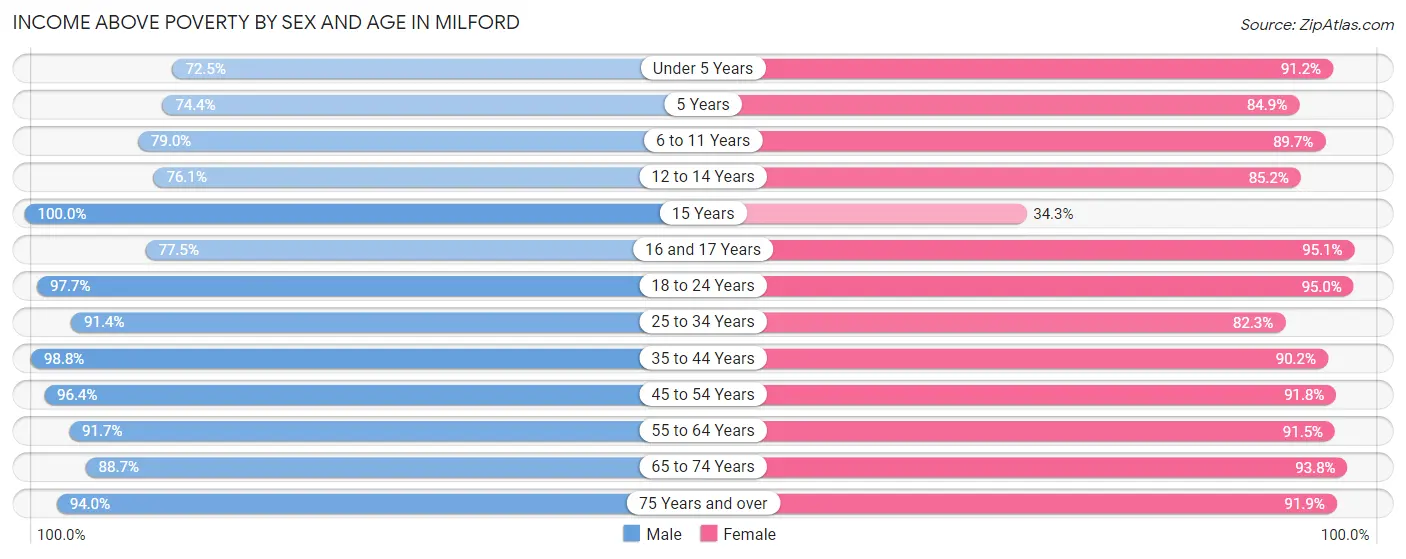
| Age Bracket | Male | Female |
| Under 5 Years | 613 (72.5%) | 804 (91.2%) |
| 5 Years | 224 (74.4%) | 84 (84.9%) |
| 6 to 11 Years | 878 (79.0%) | 567 (89.7%) |
| 12 to 14 Years | 372 (76.1%) | 356 (85.2%) |
| 15 Years | 134 (100.0%) | 62 (34.3%) |
| 16 and 17 Years | 252 (77.5%) | 293 (95.1%) |
| 18 to 24 Years | 1,172 (97.7%) | 876 (95.0%) |
| 25 to 34 Years | 1,895 (91.4%) | 1,686 (82.3%) |
| 35 to 44 Years | 2,089 (98.8%) | 1,528 (90.2%) |
| 45 to 54 Years | 1,807 (96.4%) | 1,336 (91.8%) |
| 55 to 64 Years | 1,586 (91.7%) | 1,738 (91.5%) |
| 65 to 74 Years | 1,142 (88.7%) | 1,355 (93.8%) |
| 75 Years and over | 645 (94.0%) | 992 (91.8%) |
| Total | 12,809 (90.4%) | 11,677 (89.4%) |
Income Below Poverty Among Married-Couple Families in Milford
The poverty statistics for married-couple families in Milford show that 2.1% or 111 of the total 5,160 families live below the poverty line. Families with 5 or more children have the highest poverty rate of 100.0%, comprising of 19 families. On the other hand, families with 1 or 2 children have the lowest poverty rate of 0.2%, which includes 4 families.
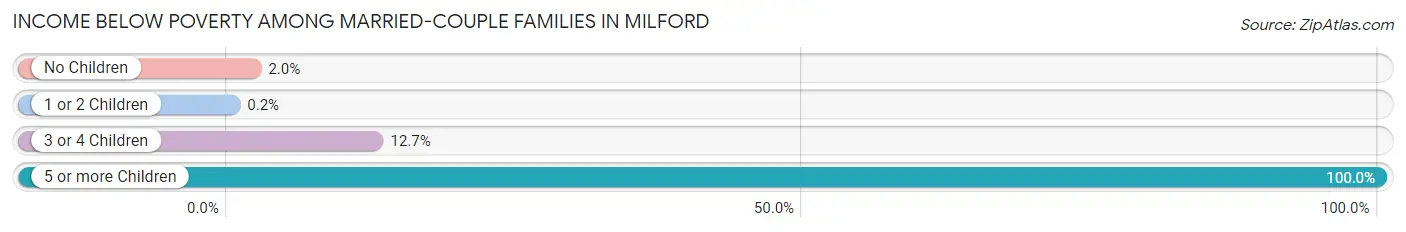
| Children | Above Poverty | Below Poverty |
| No Children | 2,883 (98.0%) | 60 (2.0%) |
| 1 or 2 Children | 1,973 (99.8%) | 4 (0.2%) |
| 3 or 4 Children | 193 (87.3%) | 28 (12.7%) |
| 5 or more Children | 0 (0.0%) | 19 (100.0%) |
| Total | 5,049 (97.9%) | 111 (2.1%) |
Income Below Poverty Among Single-Parent Households in Milford
According to the poverty data in Milford, 1.5% or 8 single-father households and 23.4% or 315 single-mother households are living below the poverty line. Among single-father households, those with no children have the highest poverty rate, with 8 households (2.5%) experiencing poverty. Likewise, among single-mother households, those with 3 or 4 children have the highest poverty rate, with 136 households (100.0%) falling below the poverty line.
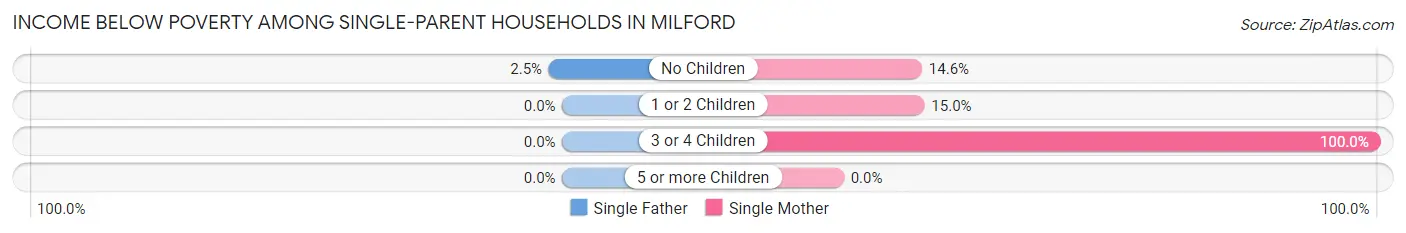
| Children | Single Father | Single Mother |
| No Children | 8 (2.5%) | 96 (14.6%) |
| 1 or 2 Children | 0 (0.0%) | 83 (15.0%) |
| 3 or 4 Children | 0 (0.0%) | 136 (100.0%) |
| 5 or more Children | 0 (0.0%) | 0 (0.0%) |
| Total | 8 (1.5%) | 315 (23.4%) |
Income Below Poverty Among Married-Couple vs Single-Parent Households in Milford
The poverty data for Milford shows that 111 of the married-couple family households (2.1%) and 323 of the single-parent households (17.0%) are living below the poverty level. Within the married-couple family households, those with 5 or more children have the highest poverty rate, with 19 households (100.0%) falling below the poverty line. Among the single-parent households, those with 3 or 4 children have the highest poverty rate, with 136 household (73.9%) living below poverty.
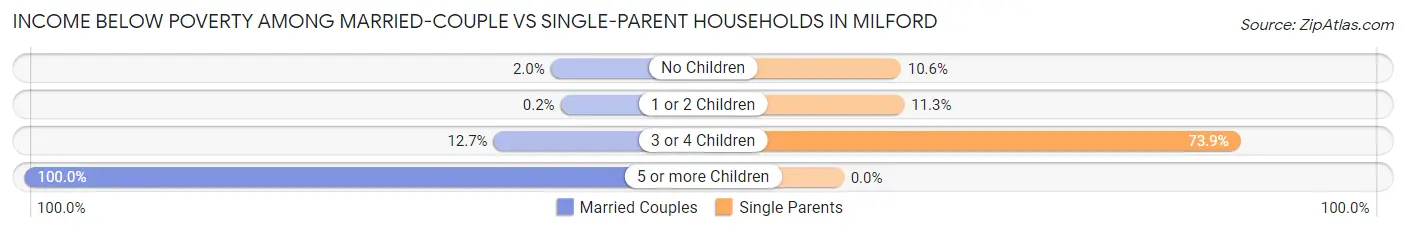
| Children | Married-Couple Families | Single-Parent Households |
| No Children | 60 (2.0%) | 104 (10.6%) |
| 1 or 2 Children | 4 (0.2%) | 83 (11.3%) |
| 3 or 4 Children | 28 (12.7%) | 136 (73.9%) |
| 5 or more Children | 19 (100.0%) | 0 (0.0%) |
| Total | 111 (2.1%) | 323 (17.0%) |
Employment Characteristics in Milford
Employment by Class of Employer in Milford
Among the 14,686 employed individuals in Milford, private company employees (10,644 | 72.5%), self-employed (not incorporated) (1,083 | 7.4%), and local government employees (1,064 | 7.2%) make up the most common classes of employment.
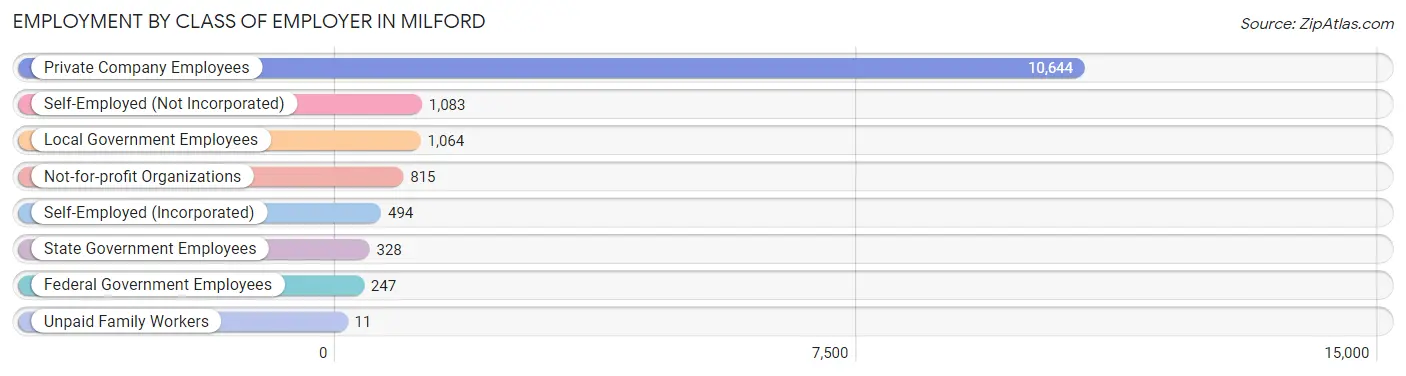
| Employer Class | # Employees | % Employees |
| Private Company Employees | 10,644 | 72.5% |
| Self-Employed (Incorporated) | 494 | 3.4% |
| Self-Employed (Not Incorporated) | 1,083 | 7.4% |
| Not-for-profit Organizations | 815 | 5.6% |
| Local Government Employees | 1,064 | 7.2% |
| State Government Employees | 328 | 2.2% |
| Federal Government Employees | 247 | 1.7% |
| Unpaid Family Workers | 11 | 0.1% |
| Total | 14,686 | 100.0% |
Employment Status by Age in Milford
According to the labor force statistics for Milford, out of the total population over 16 years of age (22,284), 72.1% or 16,067 individuals are in the labor force, with 5.9% or 948 of them unemployed. The age group with the highest labor force participation rate is 35 to 44 years, with 94.7% or 3,606 individuals in the labor force. Within the labor force, the 25 to 29 years age range has the highest percentage of unemployed individuals, with 11.6% or 181 of them being unemployed.
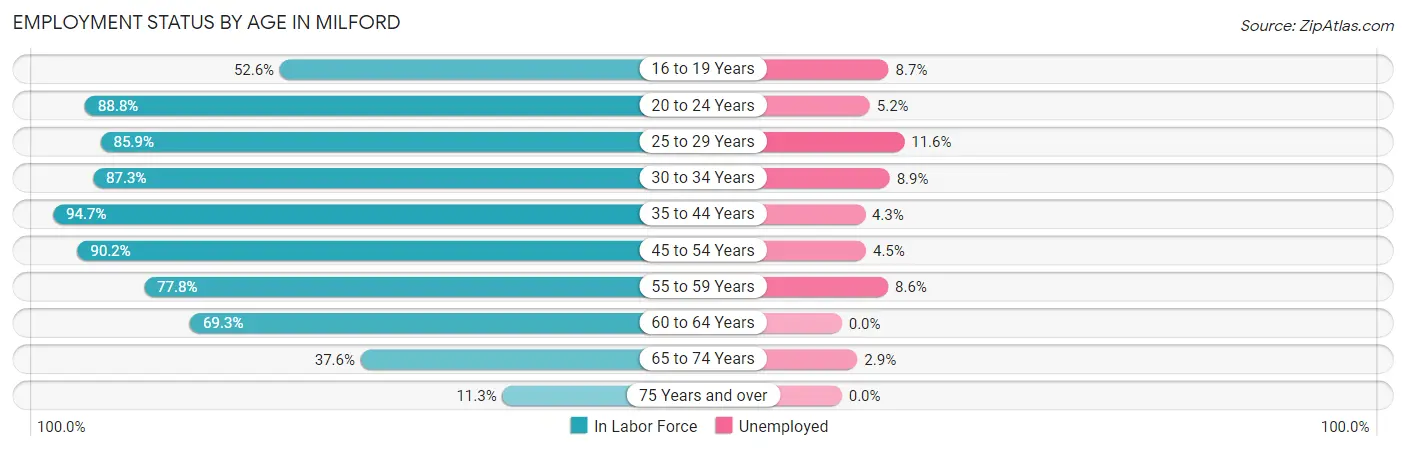
| Age Bracket | In Labor Force | Unemployed |
| 16 to 19 Years | 743 (52.6%) | 65 (8.7%) |
| 20 to 24 Years | 1,193 (88.8%) | 62 (5.2%) |
| 25 to 29 Years | 1,557 (85.9%) | 181 (11.6%) |
| 30 to 34 Years | 2,018 (87.3%) | 180 (8.9%) |
| 35 to 44 Years | 3,606 (94.7%) | 155 (4.3%) |
| 45 to 54 Years | 3,013 (90.2%) | 136 (4.5%) |
| 55 to 59 Years | 1,589 (77.8%) | 137 (8.6%) |
| 60 to 64 Years | 1,099 (69.3%) | 0 (0.0%) |
| 65 to 74 Years | 1,033 (37.6%) | 30 (2.9%) |
| 75 Years and over | 213 (11.3%) | 0 (0.0%) |
| Total | 16,067 (72.1%) | 948 (5.9%) |
Employment Status by Educational Attainment in Milford
According to labor force statistics for Milford, 86.5% of individuals (12,888) out of the total population between 25 and 64 years of age (14,899) are in the labor force, with 6.1% or 786 of them being unemployed. The group with the highest labor force participation rate are those with the educational attainment of bachelor's degree or higher, with 93.1% or 4,756 individuals in the labor force. Within the labor force, individuals with less than high school education have the highest percentage of unemployment, with 13.2% or 185 of them being unemployed.
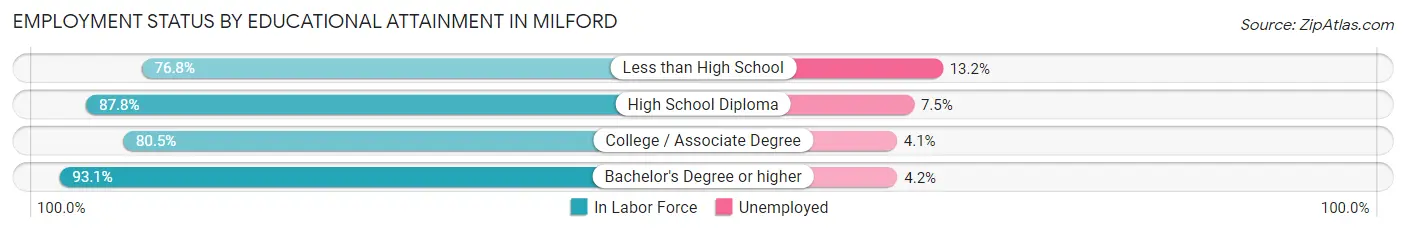
| Educational Attainment | In Labor Force | Unemployed |
| Less than High School | 1,405 (76.8%) | 241 (13.2%) |
| High School Diploma | 3,792 (87.8%) | 324 (7.5%) |
| College / Associate Degree | 2,932 (80.5%) | 149 (4.1%) |
| Bachelor's Degree or higher | 4,756 (93.1%) | 215 (4.2%) |
| Total | 12,888 (86.5%) | 909 (6.1%) |
Employment Occupations by Sex in Milford
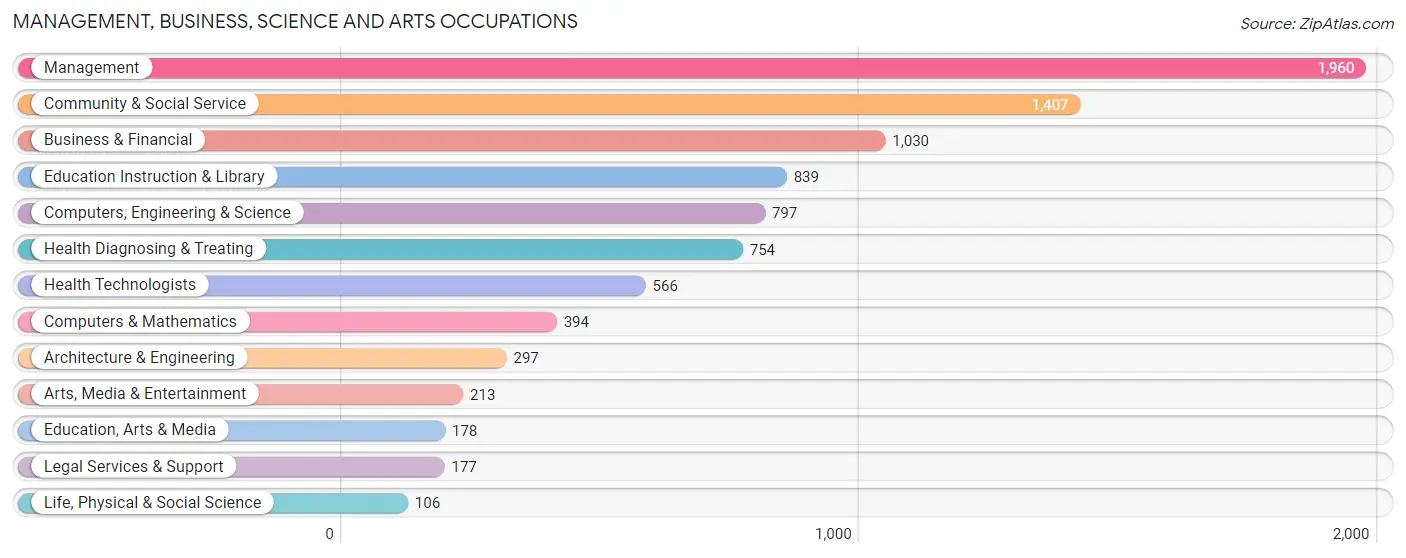
Management, Business, Science and Arts Occupations
The most common Management, Business, Science and Arts occupations in Milford are Management (1,960 | 13.0%), Community & Social Service (1,407 | 9.3%), Business & Financial (1,030 | 6.8%), Education Instruction & Library (839 | 5.6%), and Computers, Engineering & Science (797 | 5.3%).
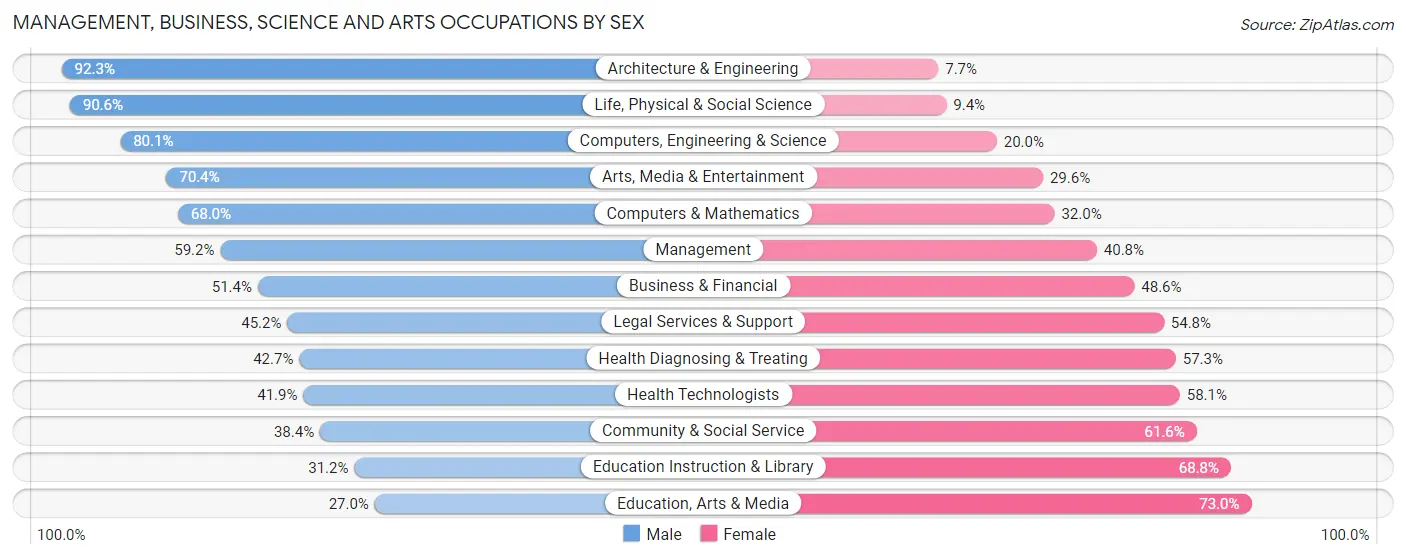
Management, Business, Science and Arts Occupations by Sex
Within the Management, Business, Science and Arts occupations in Milford, the most male-oriented occupations are Architecture & Engineering (92.3%), Life, Physical & Social Science (90.6%), and Computers, Engineering & Science (80.0%), while the most female-oriented occupations are Education, Arts & Media (73.0%), Education Instruction & Library (68.8%), and Community & Social Service (61.6%).
| Occupation | Male | Female |
| Management | 1,160 (59.2%) | 800 (40.8%) |
| Business & Financial | 529 (51.4%) | 501 (48.6%) |
| Computers, Engineering & Science | 638 (80.0%) | 159 (20.0%) |
| Computers & Mathematics | 268 (68.0%) | 126 (32.0%) |
| Architecture & Engineering | 274 (92.3%) | 23 (7.7%) |
| Life, Physical & Social Science | 96 (90.6%) | 10 (9.4%) |
| Community & Social Service | 540 (38.4%) | 867 (61.6%) |
| Education, Arts & Media | 48 (27.0%) | 130 (73.0%) |
| Legal Services & Support | 80 (45.2%) | 97 (54.8%) |
| Education Instruction & Library | 262 (31.2%) | 577 (68.8%) |
| Arts, Media & Entertainment | 150 (70.4%) | 63 (29.6%) |
| Health Diagnosing & Treating | 322 (42.7%) | 432 (57.3%) |
| Health Technologists | 237 (41.9%) | 329 (58.1%) |
| Total (Category) | 3,189 (53.6%) | 2,759 (46.4%) |
| Total (Overall) | 8,313 (55.0%) | 6,790 (45.0%) |
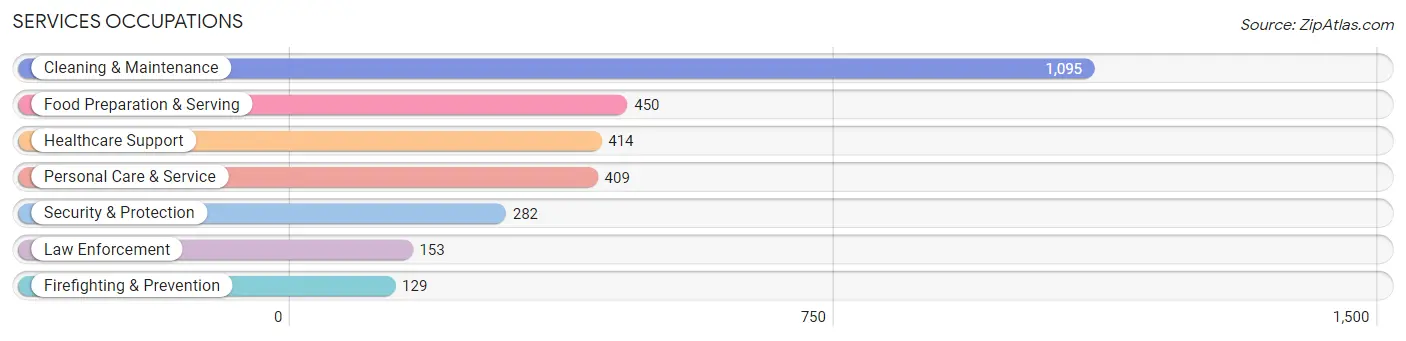
Services Occupations
The most common Services occupations in Milford are Cleaning & Maintenance (1,095 | 7.2%), Food Preparation & Serving (450 | 3.0%), Healthcare Support (414 | 2.7%), Personal Care & Service (409 | 2.7%), and Security & Protection (282 | 1.9%).
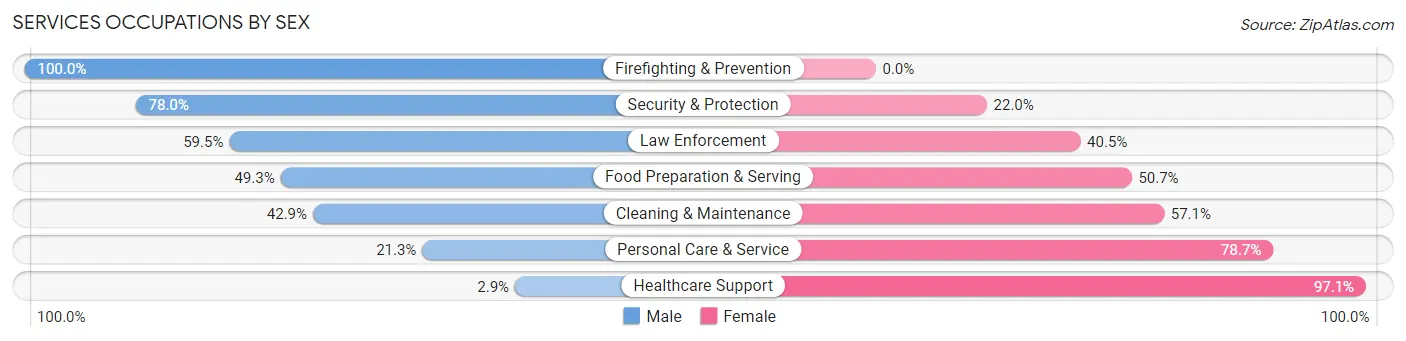
Services Occupations by Sex
Within the Services occupations in Milford, the most male-oriented occupations are Firefighting & Prevention (100.0%), Security & Protection (78.0%), and Law Enforcement (59.5%), while the most female-oriented occupations are Healthcare Support (97.1%), Personal Care & Service (78.7%), and Cleaning & Maintenance (57.1%).
| Occupation | Male | Female |
| Healthcare Support | 12 (2.9%) | 402 (97.1%) |
| Security & Protection | 220 (78.0%) | 62 (22.0%) |
| Firefighting & Prevention | 129 (100.0%) | 0 (0.0%) |
| Law Enforcement | 91 (59.5%) | 62 (40.5%) |
| Food Preparation & Serving | 222 (49.3%) | 228 (50.7%) |
| Cleaning & Maintenance | 470 (42.9%) | 625 (57.1%) |
| Personal Care & Service | 87 (21.3%) | 322 (78.7%) |
| Total (Category) | 1,011 (38.2%) | 1,639 (61.9%) |
| Total (Overall) | 8,313 (55.0%) | 6,790 (45.0%) |
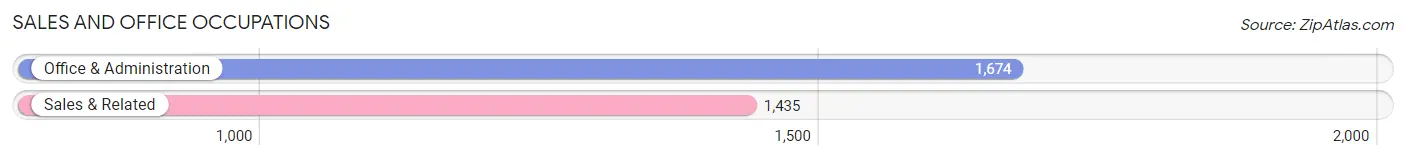
Sales and Office Occupations
The most common Sales and Office occupations in Milford are Office & Administration (1,674 | 11.1%), and Sales & Related (1,435 | 9.5%).
Sales and Office Occupations by Sex
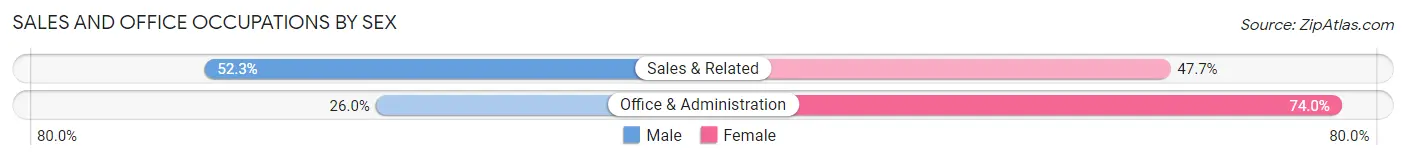
| Occupation | Male | Female |
| Sales & Related | 751 (52.3%) | 684 (47.7%) |
| Office & Administration | 435 (26.0%) | 1,239 (74.0%) |
| Total (Category) | 1,186 (38.2%) | 1,923 (61.9%) |
| Total (Overall) | 8,313 (55.0%) | 6,790 (45.0%) |
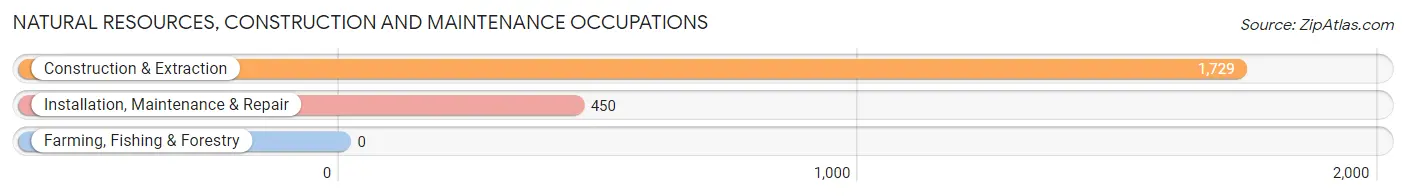
Natural Resources, Construction and Maintenance Occupations
The most common Natural Resources, Construction and Maintenance occupations in Milford are Construction & Extraction (1,729 | 11.5%), and Installation, Maintenance & Repair (450 | 3.0%).
Natural Resources, Construction and Maintenance Occupations by Sex
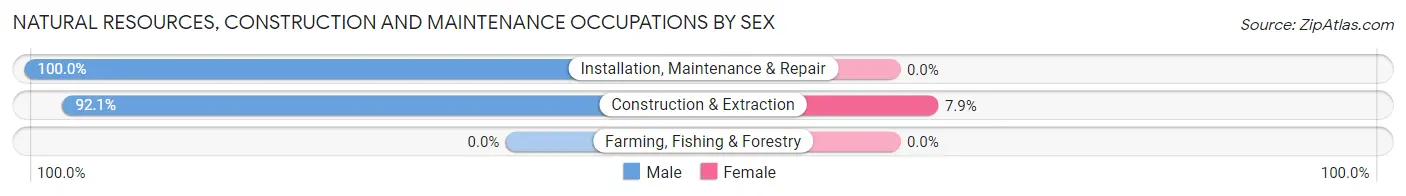
| Occupation | Male | Female |
| Farming, Fishing & Forestry | 0 (0.0%) | 0 (0.0%) |
| Construction & Extraction | 1,592 (92.1%) | 137 (7.9%) |
| Installation, Maintenance & Repair | 450 (100.0%) | 0 (0.0%) |
| Total (Category) | 2,042 (93.7%) | 137 (6.3%) |
| Total (Overall) | 8,313 (55.0%) | 6,790 (45.0%) |
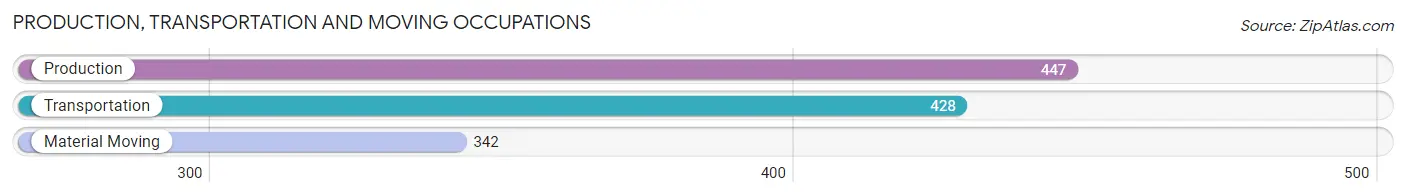
Production, Transportation and Moving Occupations
The most common Production, Transportation and Moving occupations in Milford are Production (447 | 3.0%), Transportation (428 | 2.8%), and Material Moving (342 | 2.3%).
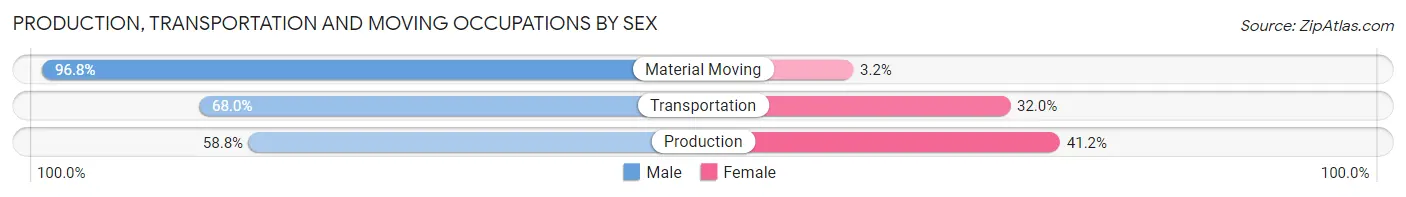
Production, Transportation and Moving Occupations by Sex
| Occupation | Male | Female |
| Production | 263 (58.8%) | 184 (41.2%) |
| Transportation | 291 (68.0%) | 137 (32.0%) |
| Material Moving | 331 (96.8%) | 11 (3.2%) |
| Total (Category) | 885 (72.7%) | 332 (27.3%) |
| Total (Overall) | 8,313 (55.0%) | 6,790 (45.0%) |
Employment Industries by Sex in Milford
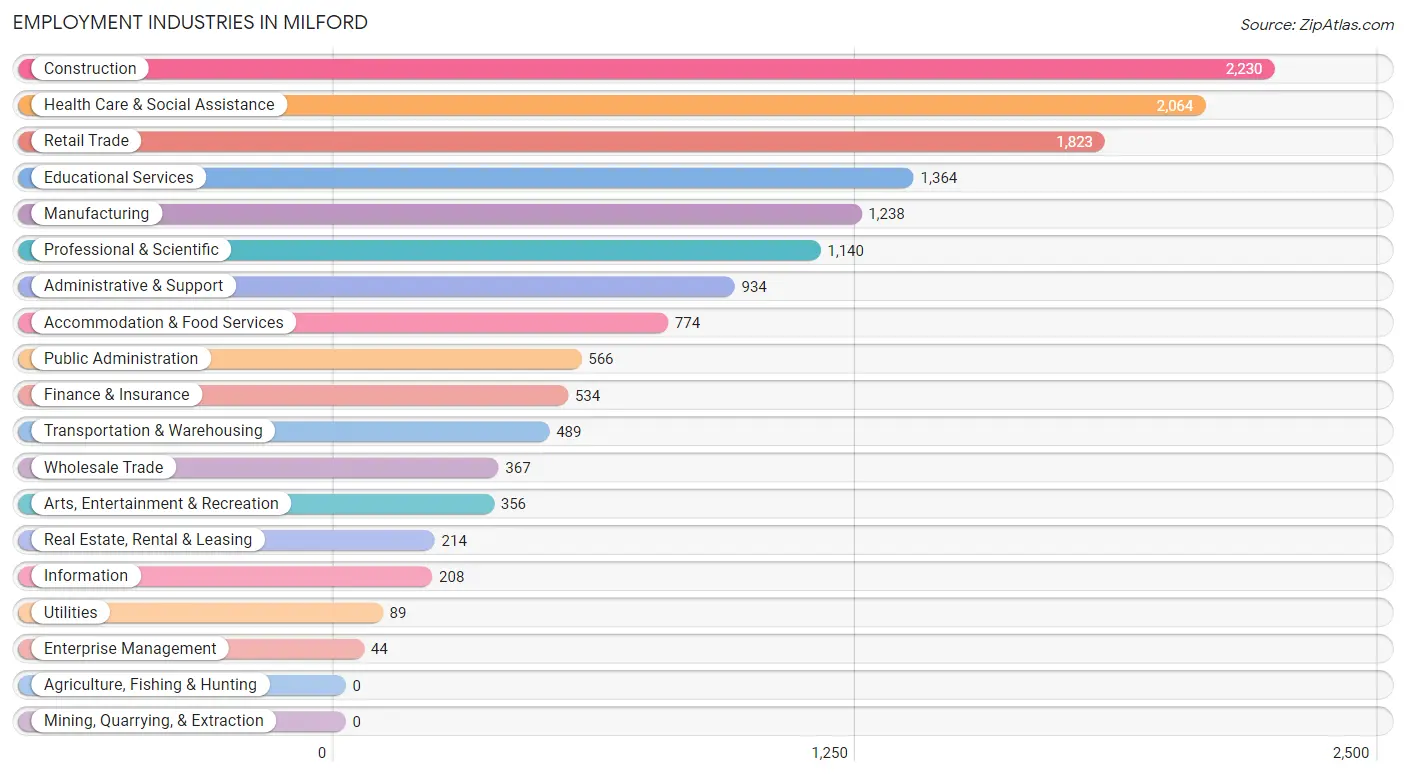
Employment Industries in Milford
The major employment industries in Milford include Construction (2,230 | 14.8%), Health Care & Social Assistance (2,064 | 13.7%), Retail Trade (1,823 | 12.1%), Educational Services (1,364 | 9.0%), and Manufacturing (1,238 | 8.2%).
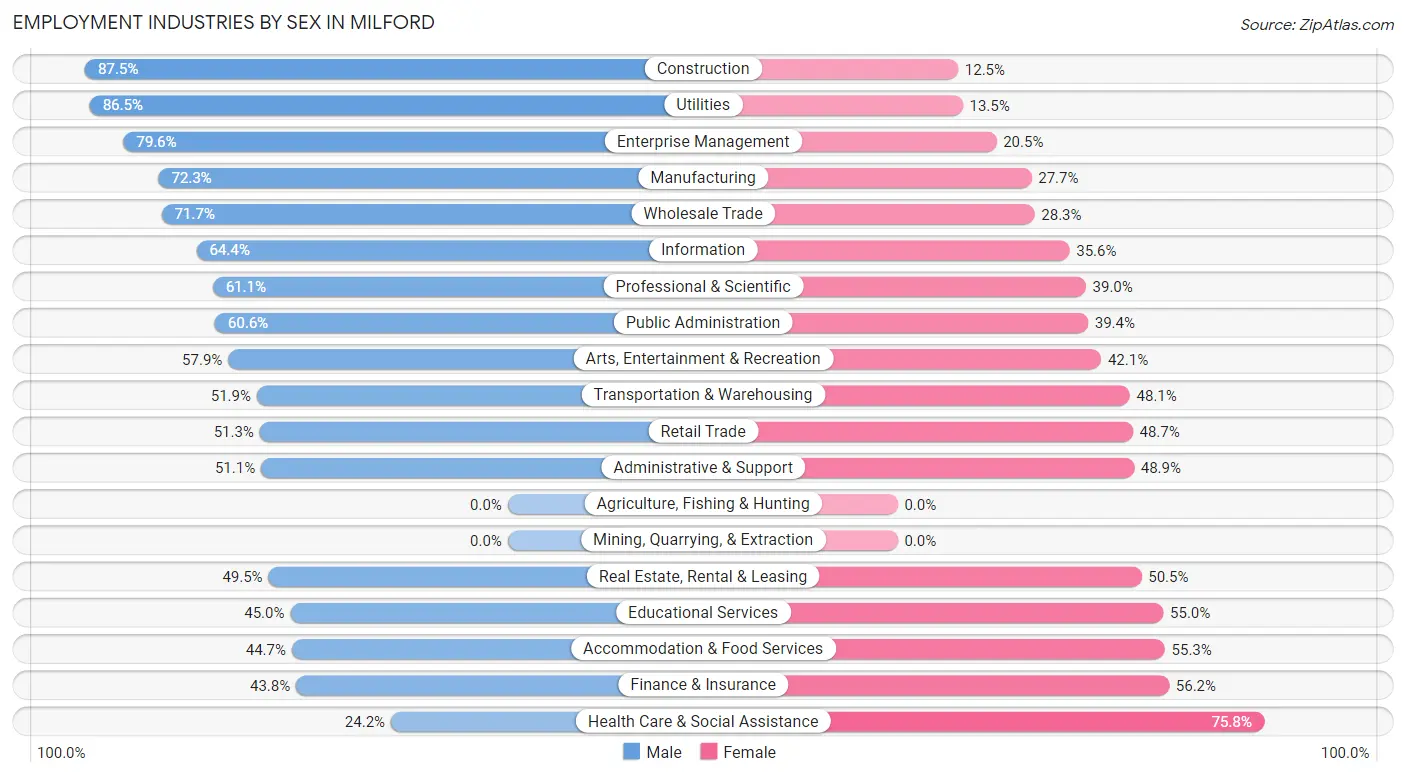
Employment Industries by Sex in Milford
The Milford industries that see more men than women are Construction (87.5%), Utilities (86.5%), and Enterprise Management (79.5%), whereas the industries that tend to have a higher number of women are Health Care & Social Assistance (75.8%), Finance & Insurance (56.2%), and Accommodation & Food Services (55.3%).
| Industry | Male | Female |
| Agriculture, Fishing & Hunting | 0 (0.0%) | 0 (0.0%) |
| Mining, Quarrying, & Extraction | 0 (0.0%) | 0 (0.0%) |
| Construction | 1,951 (87.5%) | 279 (12.5%) |
| Manufacturing | 895 (72.3%) | 343 (27.7%) |
| Wholesale Trade | 263 (71.7%) | 104 (28.3%) |
| Retail Trade | 936 (51.3%) | 887 (48.7%) |
| Transportation & Warehousing | 254 (51.9%) | 235 (48.1%) |
| Utilities | 77 (86.5%) | 12 (13.5%) |
| Information | 134 (64.4%) | 74 (35.6%) |
| Finance & Insurance | 234 (43.8%) | 300 (56.2%) |
| Real Estate, Rental & Leasing | 106 (49.5%) | 108 (50.5%) |
| Professional & Scientific | 696 (61.1%) | 444 (39.0%) |
| Enterprise Management | 35 (79.5%) | 9 (20.4%) |
| Administrative & Support | 477 (51.1%) | 457 (48.9%) |
| Educational Services | 614 (45.0%) | 750 (55.0%) |
| Health Care & Social Assistance | 499 (24.2%) | 1,565 (75.8%) |
| Arts, Entertainment & Recreation | 206 (57.9%) | 150 (42.1%) |
| Accommodation & Food Services | 346 (44.7%) | 428 (55.3%) |
| Public Administration | 343 (60.6%) | 223 (39.4%) |
| Total | 8,313 (55.0%) | 6,790 (45.0%) |
Education in Milford
School Enrollment in Milford
The most common levels of schooling among the 5,952 students in Milford are high school (1,486 | 25.0%), elementary school (1,399 | 23.5%), and middle school (1,094 | 18.4%).
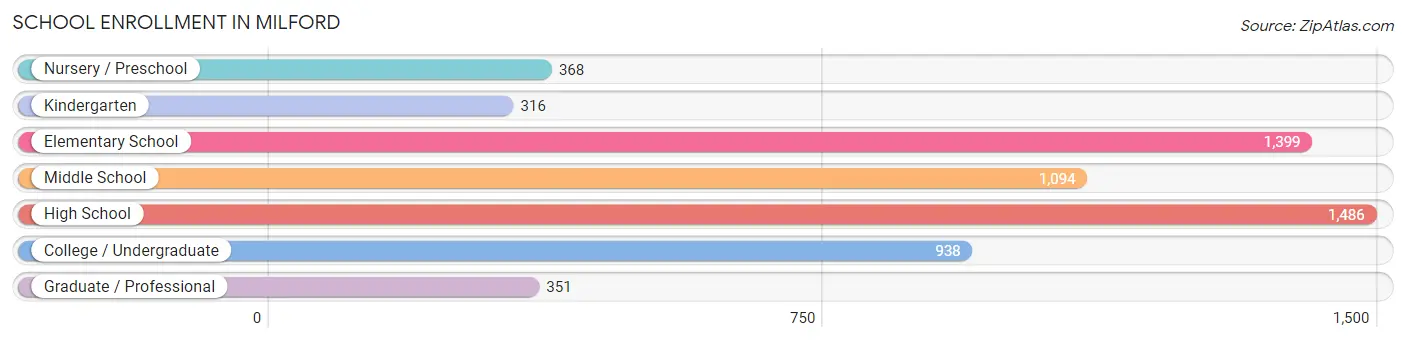
| School Level | # Students | % Students |
| Nursery / Preschool | 368 | 6.2% |
| Kindergarten | 316 | 5.3% |
| Elementary School | 1,399 | 23.5% |
| Middle School | 1,094 | 18.4% |
| High School | 1,486 | 25.0% |
| College / Undergraduate | 938 | 15.8% |
| Graduate / Professional | 351 | 5.9% |
| Total | 5,952 | 100.0% |
School Enrollment by Age by Funding Source in Milford
Out of a total of 5,952 students who are enrolled in schools in Milford, 738 (12.4%) attend a private institution, while the remaining 5,214 (87.6%) are enrolled in public schools. The age group of 3 to 4 year olds has the highest likelihood of being enrolled in private schools, with 198 (60.4% in the age bracket) enrolled. Conversely, the age group of 18 to 19 year olds has the lowest likelihood of being enrolled in a private school, with 489 (97.0% in the age bracket) attending a public institution.
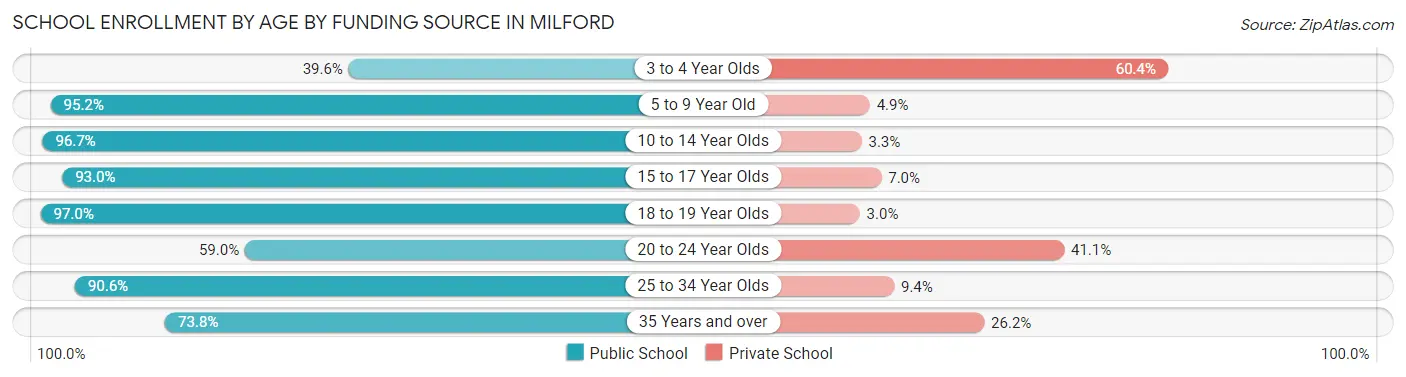
| Age Bracket | Public School | Private School |
| 3 to 4 Year Olds | 130 (39.6%) | 198 (60.4%) |
| 5 to 9 Year Old | 1,509 (95.2%) | 77 (4.9%) |
| 10 to 14 Year Olds | 1,422 (96.7%) | 49 (3.3%) |
| 15 to 17 Year Olds | 849 (93.0%) | 64 (7.0%) |
| 18 to 19 Year Olds | 489 (97.0%) | 15 (3.0%) |
| 20 to 24 Year Olds | 313 (59.0%) | 218 (41.0%) |
| 25 to 34 Year Olds | 232 (90.6%) | 24 (9.4%) |
| 35 Years and over | 268 (73.8%) | 95 (26.2%) |
| Total | 5,214 (87.6%) | 738 (12.4%) |
Educational Attainment by Field of Study in Milford
Business (1,193 | 17.5%), education (742 | 10.9%), engineering (738 | 10.8%), social sciences (679 | 10.0%), and science & technology (522 | 7.7%) are the most common fields of study among 6,812 individuals in Milford who have obtained a bachelor's degree or higher.
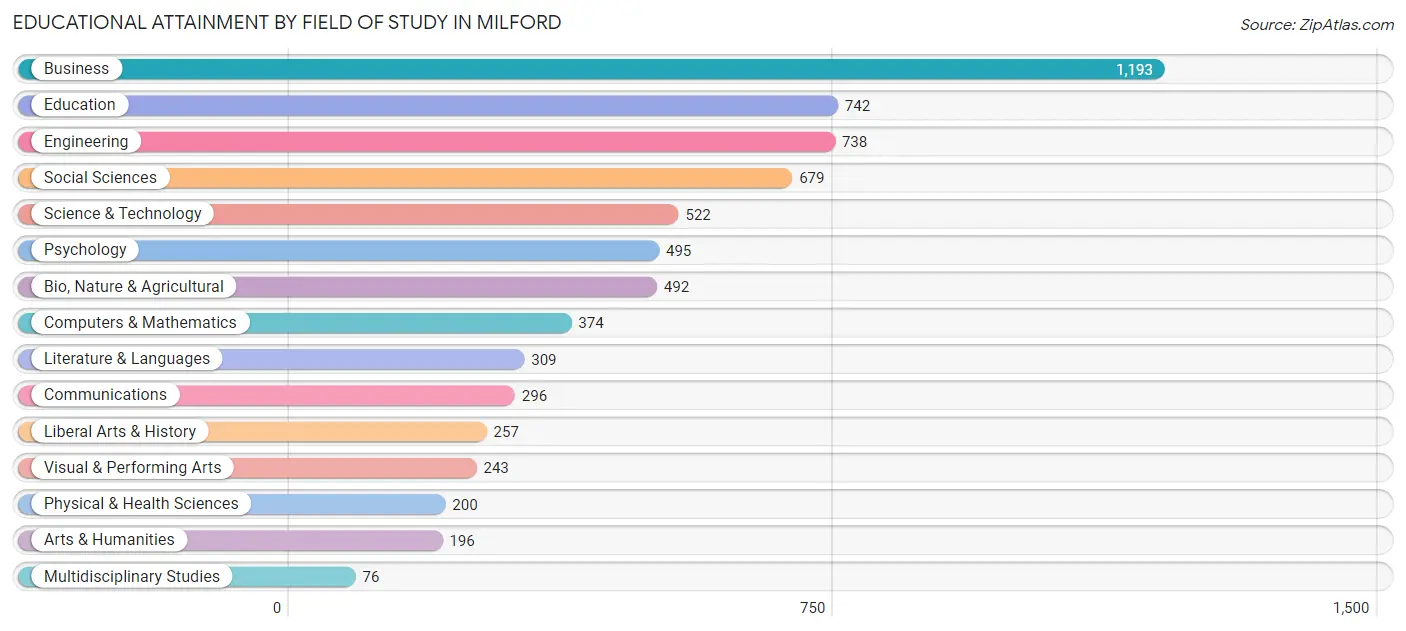
| Field of Study | # Graduates | % Graduates |
| Computers & Mathematics | 374 | 5.5% |
| Bio, Nature & Agricultural | 492 | 7.2% |
| Physical & Health Sciences | 200 | 2.9% |
| Psychology | 495 | 7.3% |
| Social Sciences | 679 | 10.0% |
| Engineering | 738 | 10.8% |
| Multidisciplinary Studies | 76 | 1.1% |
| Science & Technology | 522 | 7.7% |
| Business | 1,193 | 17.5% |
| Education | 742 | 10.9% |
| Literature & Languages | 309 | 4.5% |
| Liberal Arts & History | 257 | 3.8% |
| Visual & Performing Arts | 243 | 3.6% |
| Communications | 296 | 4.3% |
| Arts & Humanities | 196 | 2.9% |
| Total | 6,812 | 100.0% |
Transportation & Commute in Milford
Vehicle Availability by Sex in Milford
The most prevalent vehicle ownership categories in Milford are males with 2 vehicles (3,469, accounting for 43.1%) and females with 2 vehicles (2,710, making up 52.3%).
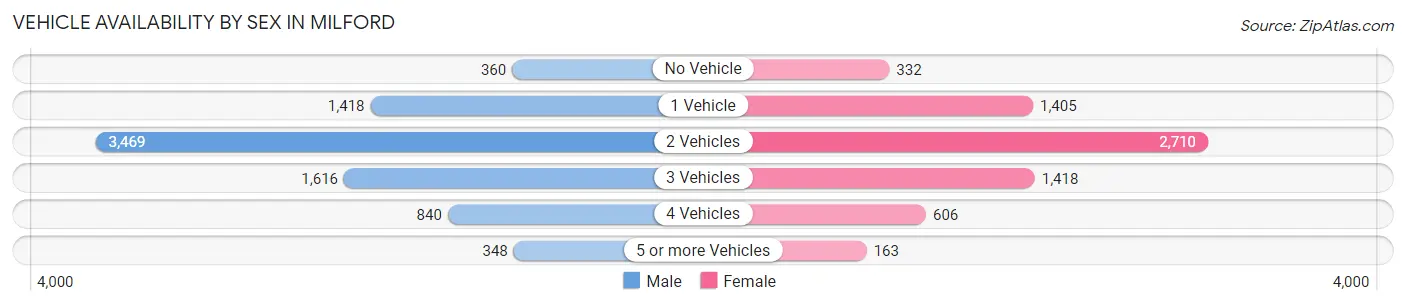
| Vehicles Available | Male | Female |
| No Vehicle | 360 (4.5%) | 332 (5.0%) |
| 1 Vehicle | 1,418 (17.6%) | 1,405 (21.2%) |
| 2 Vehicles | 3,469 (43.1%) | 2,710 (40.8%) |
| 3 Vehicles | 1,616 (20.1%) | 1,418 (21.4%) |
| 4 Vehicles | 840 (10.4%) | 606 (9.1%) |
| 5 or more Vehicles | 348 (4.3%) | 163 (2.5%) |
| Total | 8,051 (100.0%) | 6,634 (100.0%) |
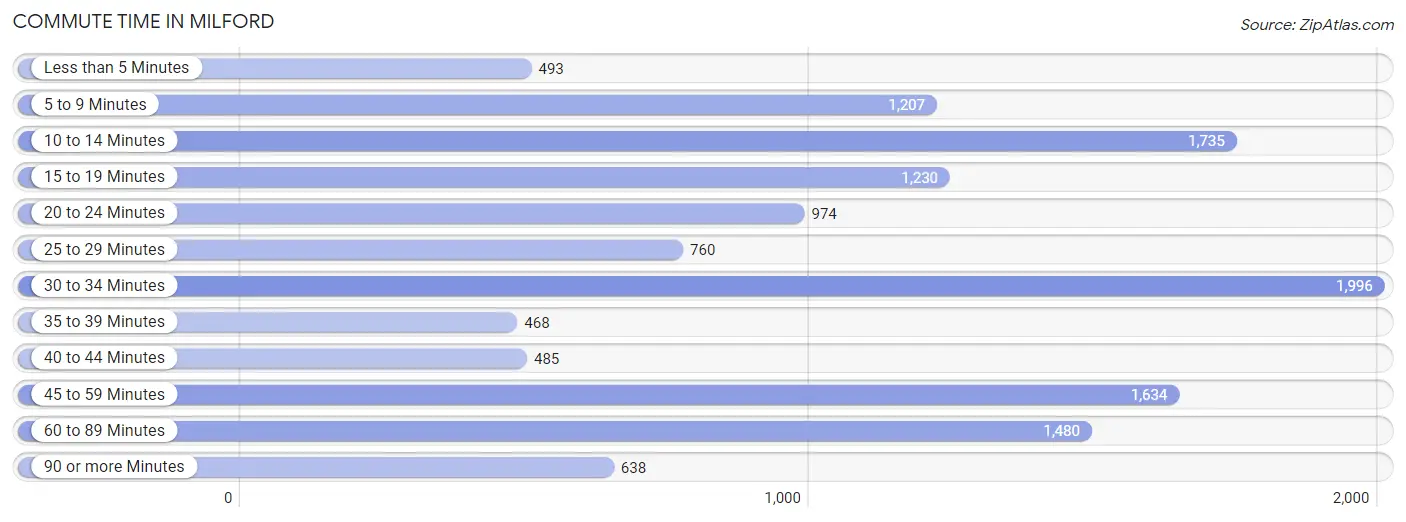
Commute Time in Milford
The most frequently occuring commute durations in Milford are 30 to 34 minutes (1,996 commuters, 15.2%), 10 to 14 minutes (1,735 commuters, 13.2%), and 45 to 59 minutes (1,634 commuters, 12.5%).
| Commute Time | # Commuters | % Commuters |
| Less than 5 Minutes | 493 | 3.8% |
| 5 to 9 Minutes | 1,207 | 9.2% |
| 10 to 14 Minutes | 1,735 | 13.2% |
| 15 to 19 Minutes | 1,230 | 9.4% |
| 20 to 24 Minutes | 974 | 7.4% |
| 25 to 29 Minutes | 760 | 5.8% |
| 30 to 34 Minutes | 1,996 | 15.2% |
| 35 to 39 Minutes | 468 | 3.6% |
| 40 to 44 Minutes | 485 | 3.7% |
| 45 to 59 Minutes | 1,634 | 12.5% |
| 60 to 89 Minutes | 1,480 | 11.3% |
| 90 or more Minutes | 638 | 4.9% |
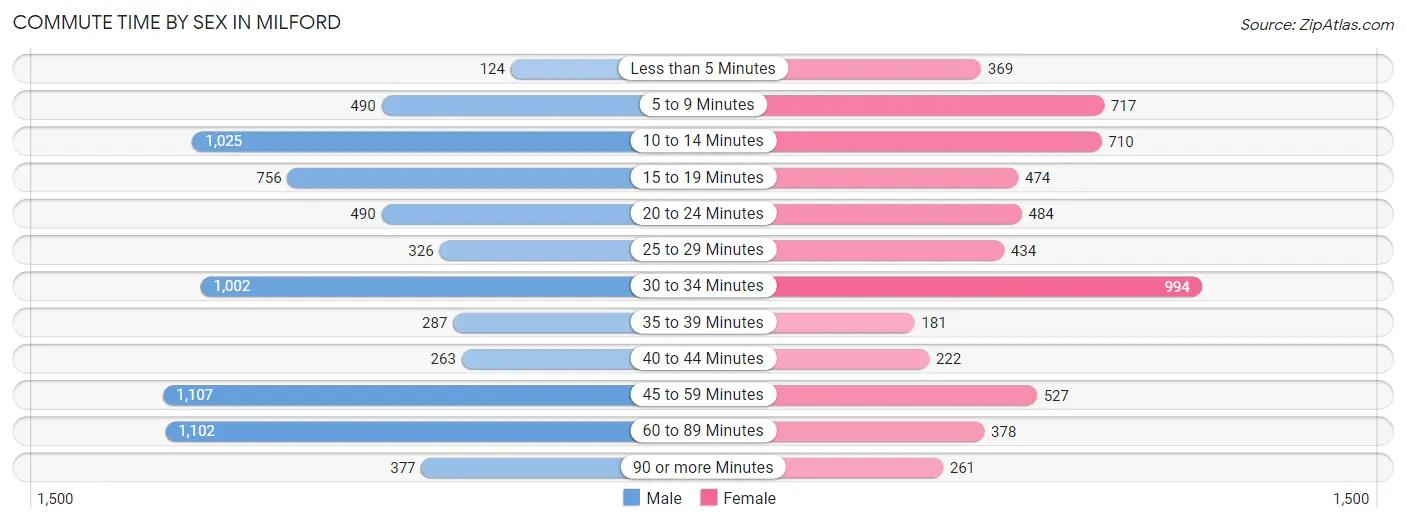
Commute Time by Sex in Milford
The most common commute times in Milford are 45 to 59 minutes (1,107 commuters, 15.1%) for males and 30 to 34 minutes (994 commuters, 17.3%) for females.
| Commute Time | Male | Female |
| Less than 5 Minutes | 124 (1.7%) | 369 (6.4%) |
| 5 to 9 Minutes | 490 (6.7%) | 717 (12.5%) |
| 10 to 14 Minutes | 1,025 (14.0%) | 710 (12.3%) |
| 15 to 19 Minutes | 756 (10.3%) | 474 (8.2%) |
| 20 to 24 Minutes | 490 (6.7%) | 484 (8.4%) |
| 25 to 29 Minutes | 326 (4.4%) | 434 (7.5%) |
| 30 to 34 Minutes | 1,002 (13.6%) | 994 (17.3%) |
| 35 to 39 Minutes | 287 (3.9%) | 181 (3.2%) |
| 40 to 44 Minutes | 263 (3.6%) | 222 (3.9%) |
| 45 to 59 Minutes | 1,107 (15.1%) | 527 (9.2%) |
| 60 to 89 Minutes | 1,102 (15.0%) | 378 (6.6%) |
| 90 or more Minutes | 377 (5.1%) | 261 (4.5%) |
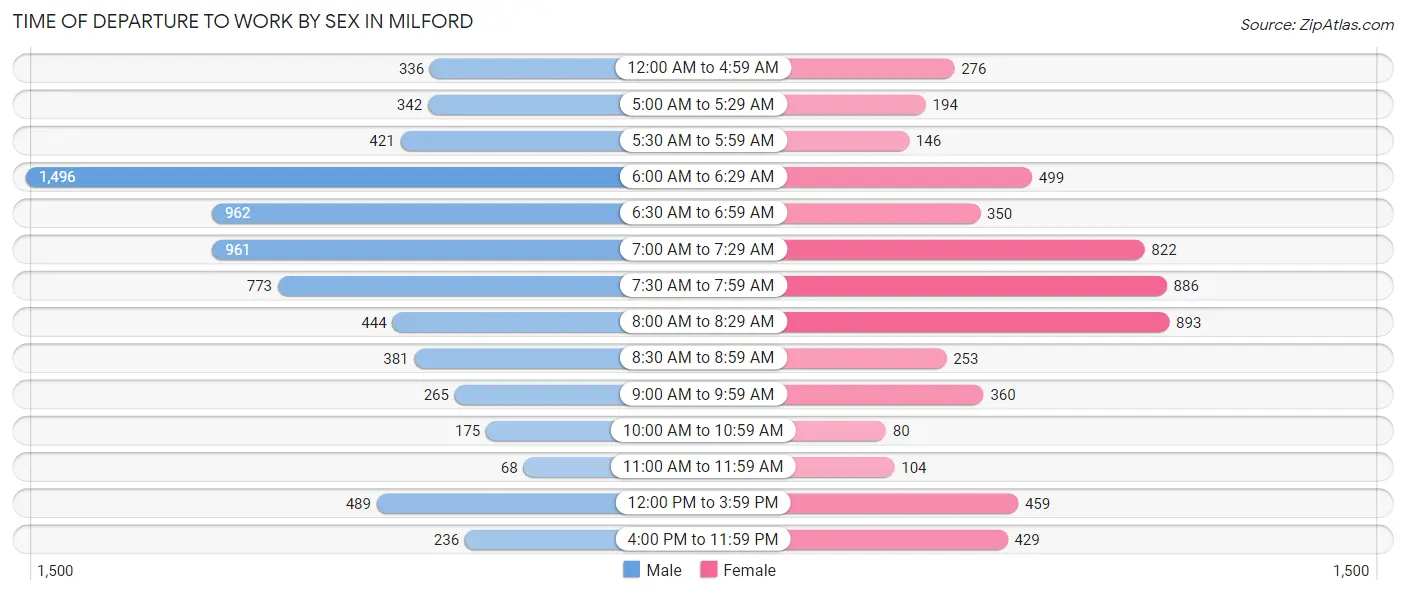
Time of Departure to Work by Sex in Milford
The most frequent times of departure to work in Milford are 6:00 AM to 6:29 AM (1,496, 20.4%) for males and 8:00 AM to 8:29 AM (893, 15.5%) for females.
| Time of Departure | Male | Female |
| 12:00 AM to 4:59 AM | 336 (4.6%) | 276 (4.8%) |
| 5:00 AM to 5:29 AM | 342 (4.6%) | 194 (3.4%) |
| 5:30 AM to 5:59 AM | 421 (5.7%) | 146 (2.5%) |
| 6:00 AM to 6:29 AM | 1,496 (20.4%) | 499 (8.7%) |
| 6:30 AM to 6:59 AM | 962 (13.1%) | 350 (6.1%) |
| 7:00 AM to 7:29 AM | 961 (13.1%) | 822 (14.3%) |
| 7:30 AM to 7:59 AM | 773 (10.5%) | 886 (15.4%) |
| 8:00 AM to 8:29 AM | 444 (6.0%) | 893 (15.5%) |
| 8:30 AM to 8:59 AM | 381 (5.2%) | 253 (4.4%) |
| 9:00 AM to 9:59 AM | 265 (3.6%) | 360 (6.3%) |
| 10:00 AM to 10:59 AM | 175 (2.4%) | 80 (1.4%) |
| 11:00 AM to 11:59 AM | 68 (0.9%) | 104 (1.8%) |
| 12:00 PM to 3:59 PM | 489 (6.7%) | 459 (8.0%) |
| 4:00 PM to 11:59 PM | 236 (3.2%) | 429 (7.5%) |
| Total | 7,349 (100.0%) | 5,751 (100.0%) |
Housing Occupancy in Milford
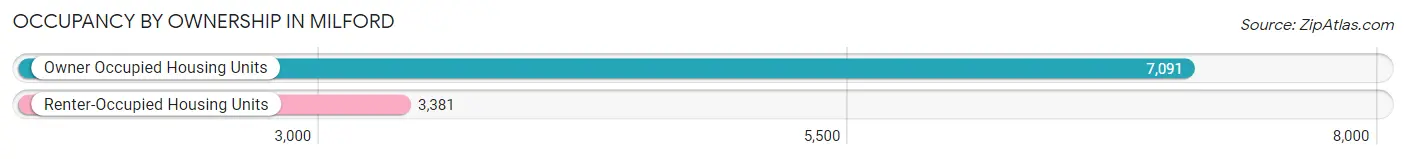
Occupancy by Ownership in Milford
Of the total 10,472 dwellings in Milford, owner-occupied units account for 7,091 (67.7%), while renter-occupied units make up 3,381 (32.3%).
| Occupancy | # Housing Units | % Housing Units |
| Owner Occupied Housing Units | 7,091 | 67.7% |
| Renter-Occupied Housing Units | 3,381 | 32.3% |
| Total Occupied Housing Units | 10,472 | 100.0% |
Occupancy by Household Size in Milford
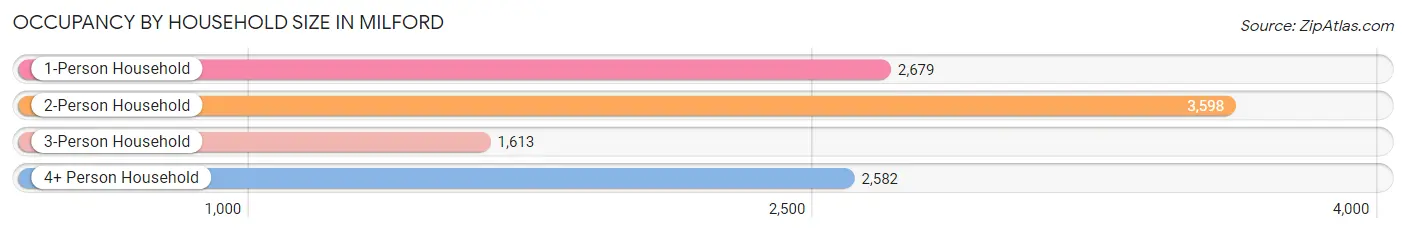
| Household Size | # Housing Units | % Housing Units |
| 1-Person Household | 2,679 | 25.6% |
| 2-Person Household | 3,598 | 34.4% |
| 3-Person Household | 1,613 | 15.4% |
| 4+ Person Household | 2,582 | 24.7% |
| Total Housing Units | 10,472 | 100.0% |
Occupancy by Ownership by Household Size in Milford
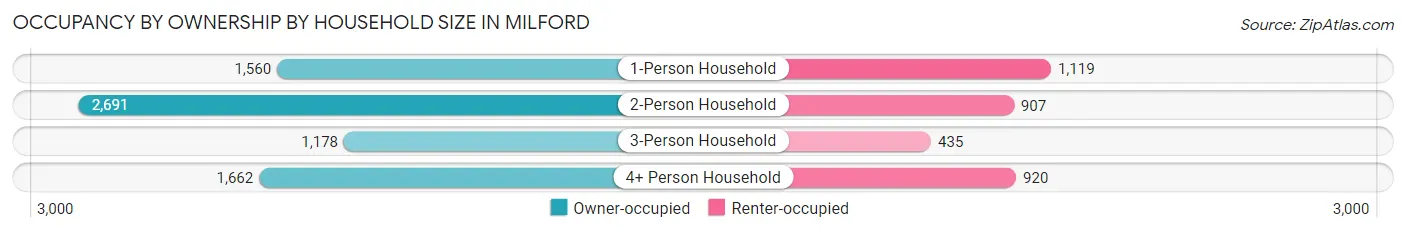
| Household Size | Owner-occupied | Renter-occupied |
| 1-Person Household | 1,560 (58.2%) | 1,119 (41.8%) |
| 2-Person Household | 2,691 (74.8%) | 907 (25.2%) |
| 3-Person Household | 1,178 (73.0%) | 435 (27.0%) |
| 4+ Person Household | 1,662 (64.4%) | 920 (35.6%) |
| Total Housing Units | 7,091 (67.7%) | 3,381 (32.3%) |
Occupancy by Educational Attainment in Milford
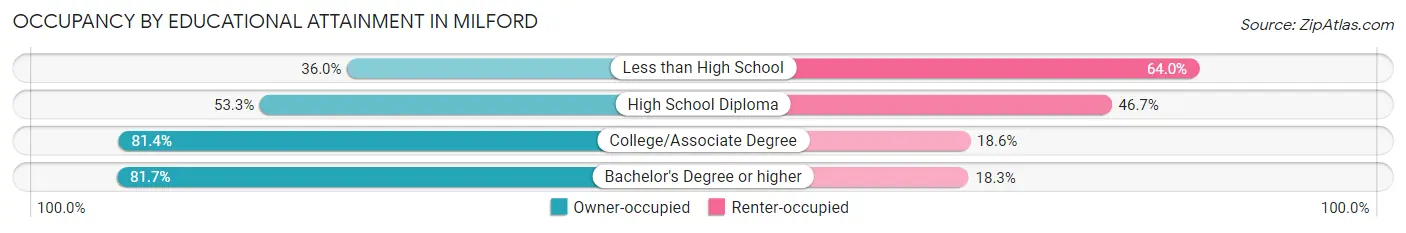
| Household Size | Owner-occupied | Renter-occupied |
| Less than High School | 467 (36.0%) | 830 (64.0%) |
| High School Diploma | 1,621 (53.3%) | 1,419 (46.7%) |
| College/Associate Degree | 2,053 (81.4%) | 470 (18.6%) |
| Bachelor's Degree or higher | 2,950 (81.7%) | 662 (18.3%) |
Occupancy by Age of Householder in Milford
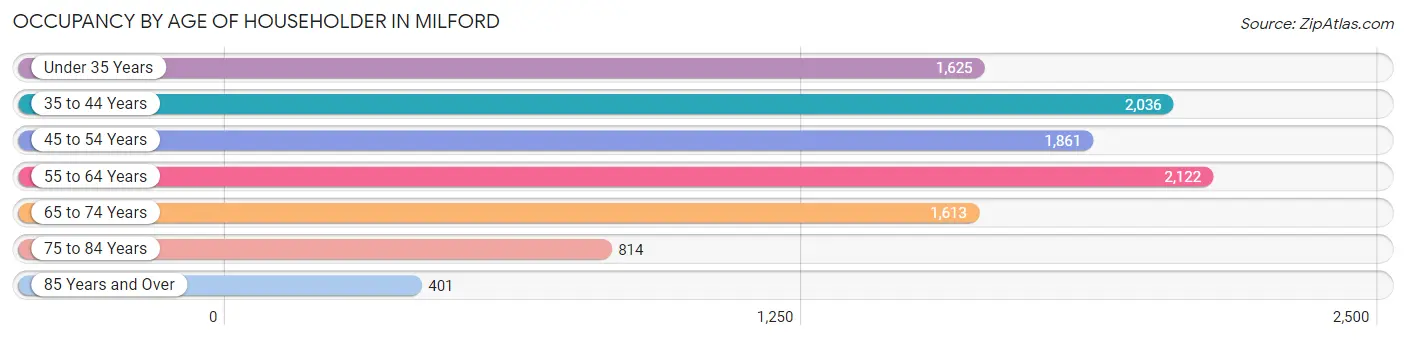
| Age Bracket | # Households | % Households |
| Under 35 Years | 1,625 | 15.5% |
| 35 to 44 Years | 2,036 | 19.4% |
| 45 to 54 Years | 1,861 | 17.8% |
| 55 to 64 Years | 2,122 | 20.3% |
| 65 to 74 Years | 1,613 | 15.4% |
| 75 to 84 Years | 814 | 7.8% |
| 85 Years and Over | 401 | 3.8% |
| Total | 10,472 | 100.0% |
Housing Finances in Milford
Median Income by Occupancy in Milford
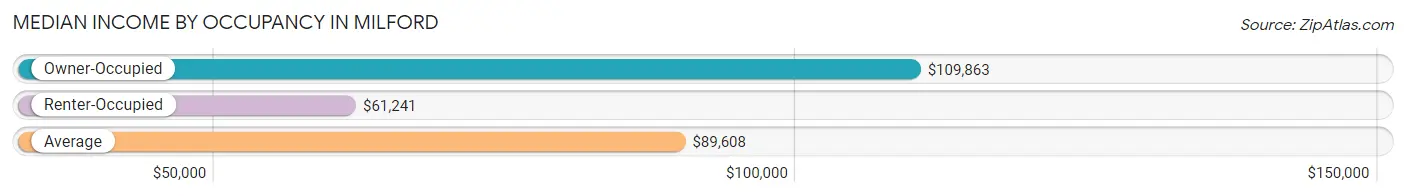
| Occupancy Type | # Households | Median Income |
| Owner-Occupied | 7,091 (67.7%) | $109,863 |
| Renter-Occupied | 3,381 (32.3%) | $61,241 |
| Average | 10,472 (100.0%) | $89,608 |
Occupancy by Householder Income Bracket in Milford
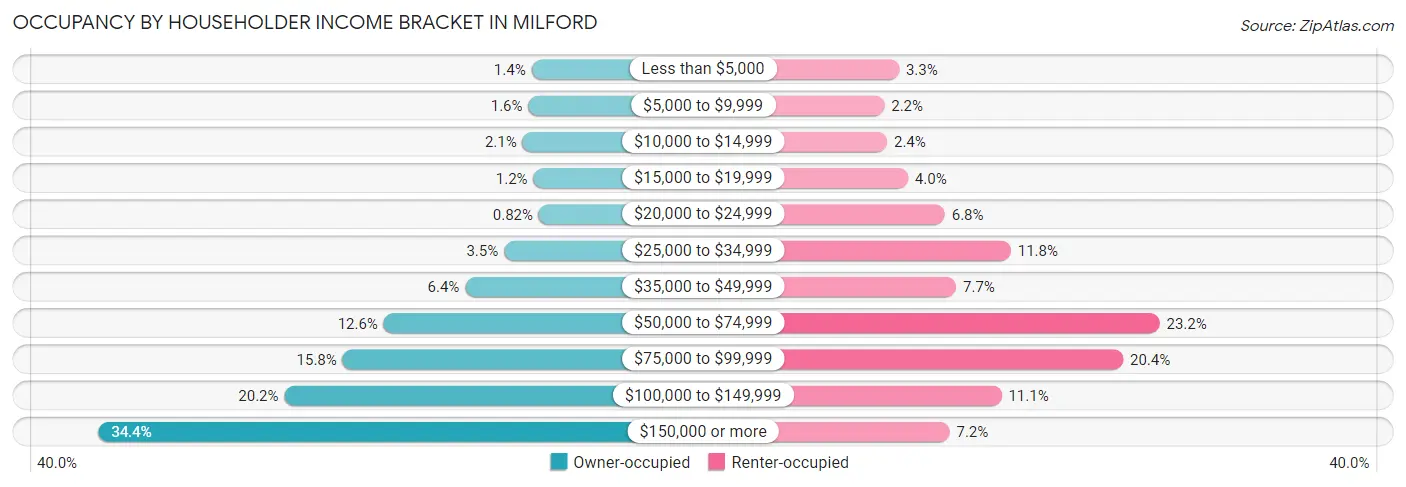
| Income Bracket | Owner-occupied | Renter-occupied |
| Less than $5,000 | 98 (1.4%) | 112 (3.3%) |
| $5,000 to $9,999 | 115 (1.6%) | 74 (2.2%) |
| $10,000 to $14,999 | 146 (2.1%) | 81 (2.4%) |
| $15,000 to $19,999 | 87 (1.2%) | 135 (4.0%) |
| $20,000 to $24,999 | 58 (0.8%) | 230 (6.8%) |
| $25,000 to $34,999 | 246 (3.5%) | 400 (11.8%) |
| $35,000 to $49,999 | 456 (6.4%) | 259 (7.7%) |
| $50,000 to $74,999 | 896 (12.6%) | 783 (23.2%) |
| $75,000 to $99,999 | 1,118 (15.8%) | 689 (20.4%) |
| $100,000 to $149,999 | 1,433 (20.2%) | 376 (11.1%) |
| $150,000 or more | 2,438 (34.4%) | 242 (7.2%) |
| Total | 7,091 (100.0%) | 3,381 (100.0%) |
Monthly Housing Cost Tiers in Milford
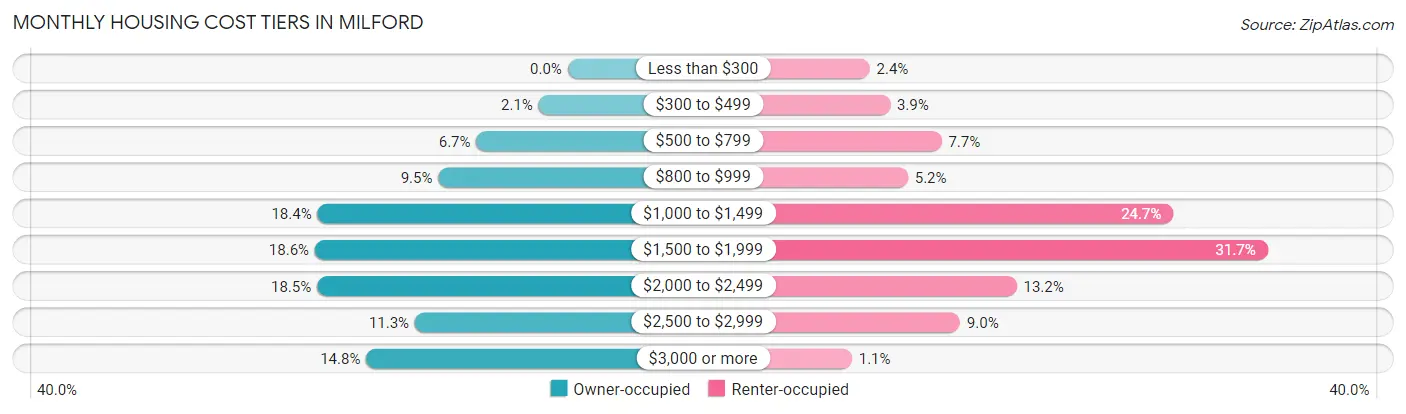
| Monthly Cost | Owner-occupied | Renter-occupied |
| Less than $300 | 0 (0.0%) | 80 (2.4%) |
| $300 to $499 | 152 (2.1%) | 131 (3.9%) |
| $500 to $799 | 477 (6.7%) | 259 (7.7%) |
| $800 to $999 | 676 (9.5%) | 175 (5.2%) |
| $1,000 to $1,499 | 1,307 (18.4%) | 836 (24.7%) |
| $1,500 to $1,999 | 1,320 (18.6%) | 1,071 (31.7%) |
| $2,000 to $2,499 | 1,309 (18.5%) | 446 (13.2%) |
| $2,500 to $2,999 | 798 (11.3%) | 305 (9.0%) |
| $3,000 or more | 1,052 (14.8%) | 36 (1.1%) |
| Total | 7,091 (100.0%) | 3,381 (100.0%) |
Physical Housing Characteristics in Milford
Housing Structures in Milford
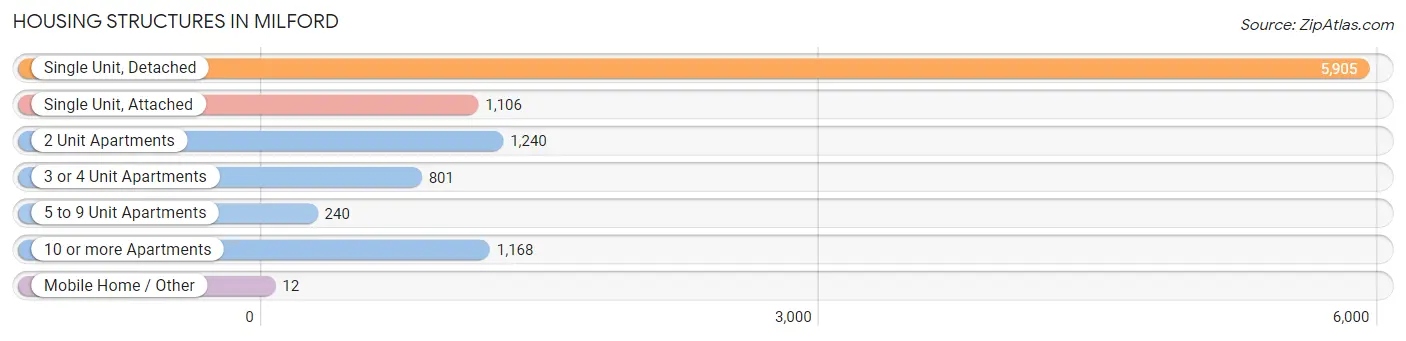
| Structure Type | # Housing Units | % Housing Units |
| Single Unit, Detached | 5,905 | 56.4% |
| Single Unit, Attached | 1,106 | 10.6% |
| 2 Unit Apartments | 1,240 | 11.8% |
| 3 or 4 Unit Apartments | 801 | 7.6% |
| 5 to 9 Unit Apartments | 240 | 2.3% |
| 10 or more Apartments | 1,168 | 11.2% |
| Mobile Home / Other | 12 | 0.1% |
| Total | 10,472 | 100.0% |
Housing Structures by Occupancy in Milford
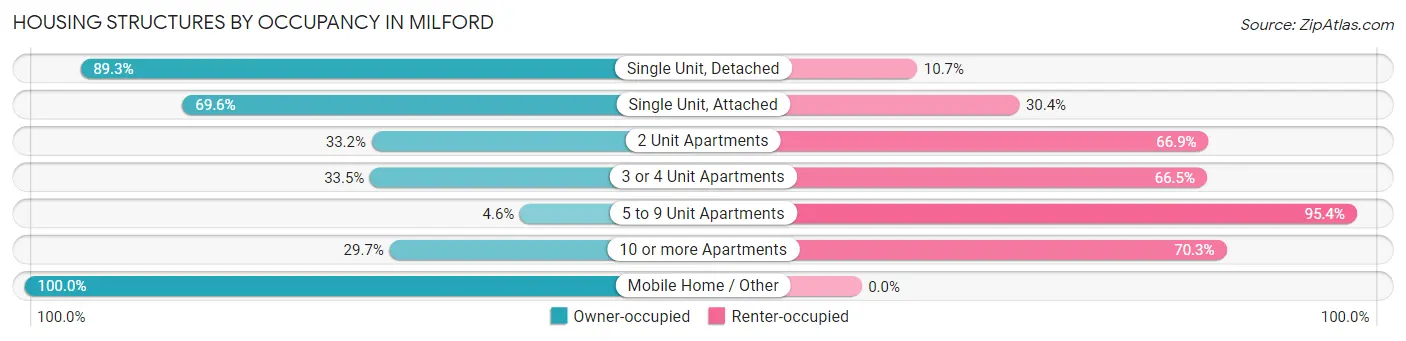
| Structure Type | Owner-occupied | Renter-occupied |
| Single Unit, Detached | 5,272 (89.3%) | 633 (10.7%) |
| Single Unit, Attached | 770 (69.6%) | 336 (30.4%) |
| 2 Unit Apartments | 411 (33.2%) | 829 (66.8%) |
| 3 or 4 Unit Apartments | 268 (33.5%) | 533 (66.5%) |
| 5 to 9 Unit Apartments | 11 (4.6%) | 229 (95.4%) |
| 10 or more Apartments | 347 (29.7%) | 821 (70.3%) |
| Mobile Home / Other | 12 (100.0%) | 0 (0.0%) |
| Total | 7,091 (67.7%) | 3,381 (32.3%) |
Housing Structures by Number of Rooms in Milford
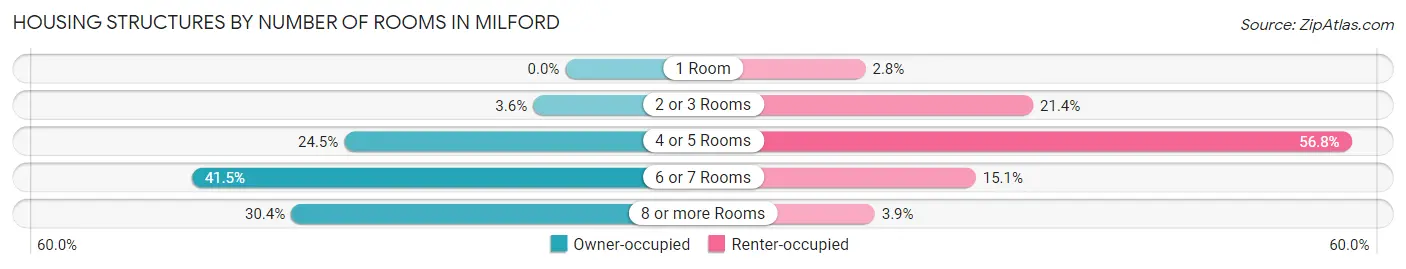
| Number of Rooms | Owner-occupied | Renter-occupied |
| 1 Room | 0 (0.0%) | 96 (2.8%) |
| 2 or 3 Rooms | 254 (3.6%) | 725 (21.4%) |
| 4 or 5 Rooms | 1,740 (24.5%) | 1,919 (56.8%) |
| 6 or 7 Rooms | 2,939 (41.4%) | 510 (15.1%) |
| 8 or more Rooms | 2,158 (30.4%) | 131 (3.9%) |
| Total | 7,091 (100.0%) | 3,381 (100.0%) |
Housing Structure by Heating Type in Milford
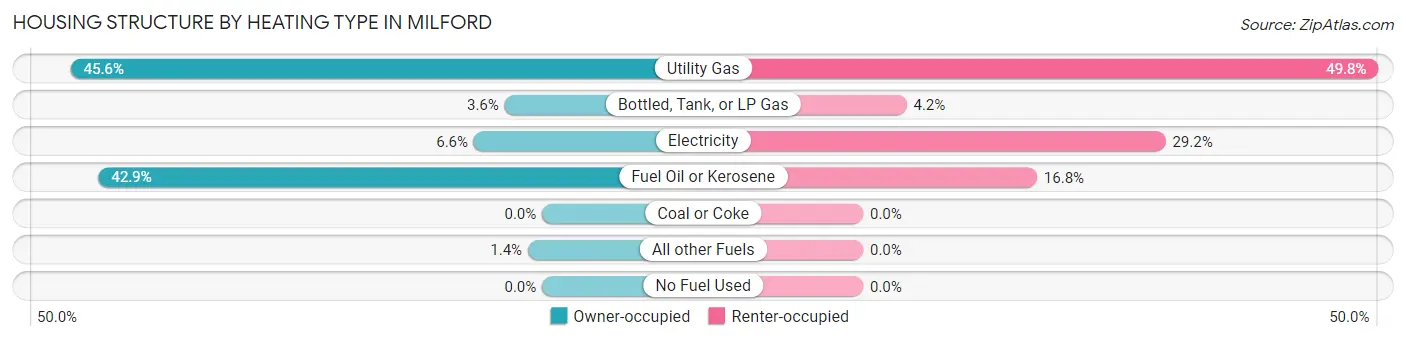
| Heating Type | Owner-occupied | Renter-occupied |
| Utility Gas | 3,230 (45.6%) | 1,683 (49.8%) |
| Bottled, Tank, or LP Gas | 257 (3.6%) | 142 (4.2%) |
| Electricity | 467 (6.6%) | 988 (29.2%) |
| Fuel Oil or Kerosene | 3,040 (42.9%) | 568 (16.8%) |
| Coal or Coke | 0 (0.0%) | 0 (0.0%) |
| All other Fuels | 97 (1.4%) | 0 (0.0%) |
| No Fuel Used | 0 (0.0%) | 0 (0.0%) |
| Total | 7,091 (100.0%) | 3,381 (100.0%) |
Household Vehicle Usage in Milford
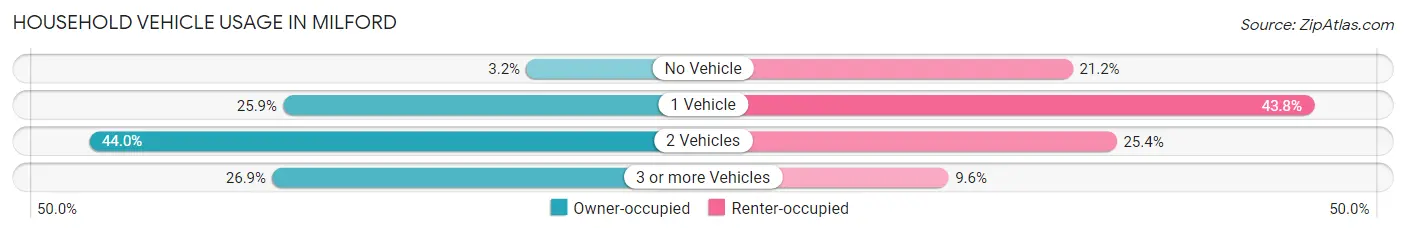
| Vehicles per Household | Owner-occupied | Renter-occupied |
| No Vehicle | 227 (3.2%) | 718 (21.2%) |
| 1 Vehicle | 1,836 (25.9%) | 1,480 (43.8%) |
| 2 Vehicles | 3,119 (44.0%) | 857 (25.4%) |
| 3 or more Vehicles | 1,909 (26.9%) | 326 (9.6%) |
| Total | 7,091 (100.0%) | 3,381 (100.0%) |
Real Estate & Mortgages in Milford
Real Estate and Mortgage Overview in Milford
| Characteristic | Without Mortgage | With Mortgage |
| Housing Units | 2,045 | 5,046 |
| Median Property Value | $398,900 | $385,800 |
| Median Household Income | $65,694 | $2,079 |
| Monthly Housing Costs | $916 | $1,052 |
| Real Estate Taxes | $5,630 | $75 |
Property Value by Mortgage Status in Milford
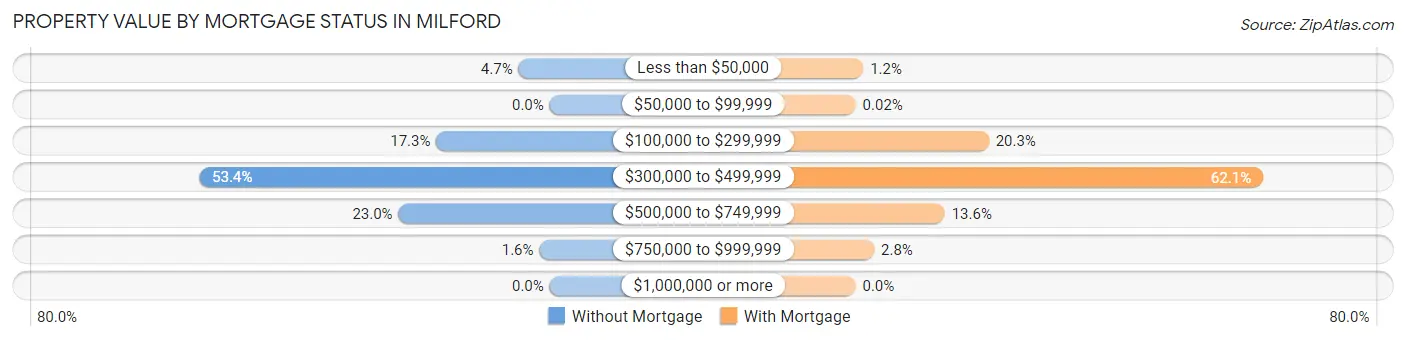
| Property Value | Without Mortgage | With Mortgage |
| Less than $50,000 | 97 (4.7%) | 59 (1.2%) |
| $50,000 to $99,999 | 0 (0.0%) | 1 (0.0%) |
| $100,000 to $299,999 | 353 (17.3%) | 1,024 (20.3%) |
| $300,000 to $499,999 | 1,092 (53.4%) | 3,133 (62.1%) |
| $500,000 to $749,999 | 471 (23.0%) | 686 (13.6%) |
| $750,000 to $999,999 | 32 (1.6%) | 143 (2.8%) |
| $1,000,000 or more | 0 (0.0%) | 0 (0.0%) |
| Total | 2,045 (100.0%) | 5,046 (100.0%) |
Household Income by Mortgage Status in Milford
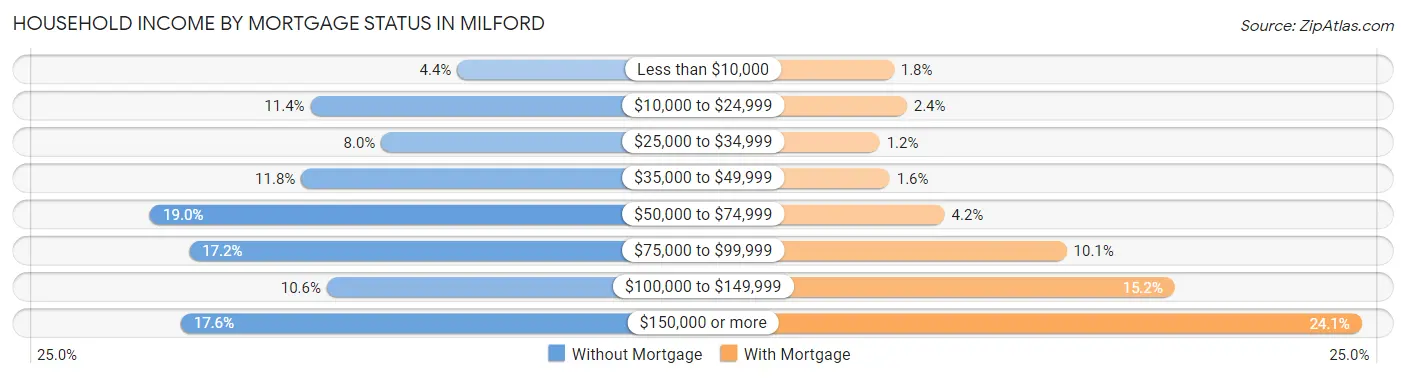
| Household Income | Without Mortgage | With Mortgage |
| Less than $10,000 | 90 (4.4%) | 92 (1.8%) |
| $10,000 to $24,999 | 233 (11.4%) | 123 (2.4%) |
| $25,000 to $34,999 | 164 (8.0%) | 58 (1.1%) |
| $35,000 to $49,999 | 242 (11.8%) | 82 (1.6%) |
| $50,000 to $74,999 | 389 (19.0%) | 214 (4.2%) |
| $75,000 to $99,999 | 351 (17.2%) | 507 (10.1%) |
| $100,000 to $149,999 | 217 (10.6%) | 767 (15.2%) |
| $150,000 or more | 359 (17.6%) | 1,216 (24.1%) |
| Total | 2,045 (100.0%) | 5,046 (100.0%) |
Property Value to Household Income Ratio in Milford
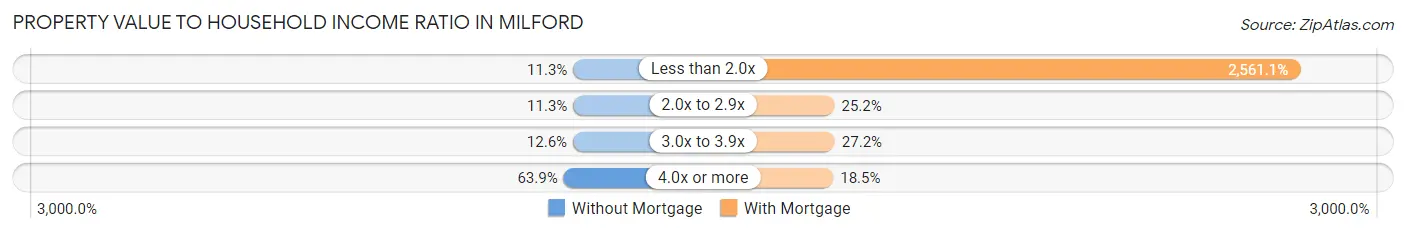
| Value-to-Income Ratio | Without Mortgage | With Mortgage |
| Less than 2.0x | 230 (11.3%) | 129,231 (2,561.1%) |
| 2.0x to 2.9x | 230 (11.3%) | 1,271 (25.2%) |
| 3.0x to 3.9x | 257 (12.6%) | 1,370 (27.2%) |
| 4.0x or more | 1,306 (63.9%) | 933 (18.5%) |
| Total | 2,045 (100.0%) | 5,046 (100.0%) |
Real Estate Taxes by Mortgage Status in Milford
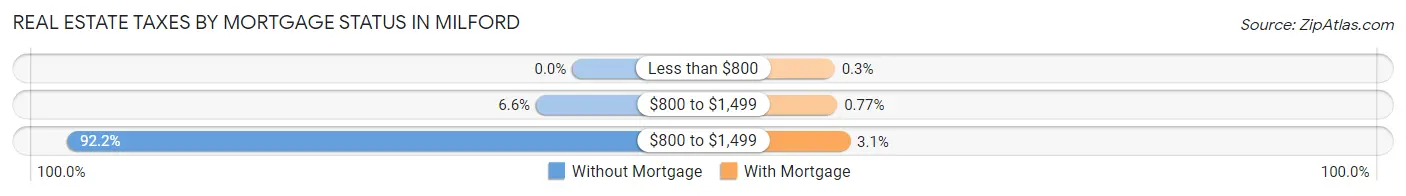
| Property Taxes | Without Mortgage | With Mortgage |
| Less than $800 | 0 (0.0%) | 15 (0.3%) |
| $800 to $1,499 | 135 (6.6%) | 39 (0.8%) |
| $800 to $1,499 | 1,886 (92.2%) | 157 (3.1%) |
| Total | 2,045 (100.0%) | 5,046 (100.0%) |
Health & Disability in Milford
Health Insurance Coverage by Age in Milford
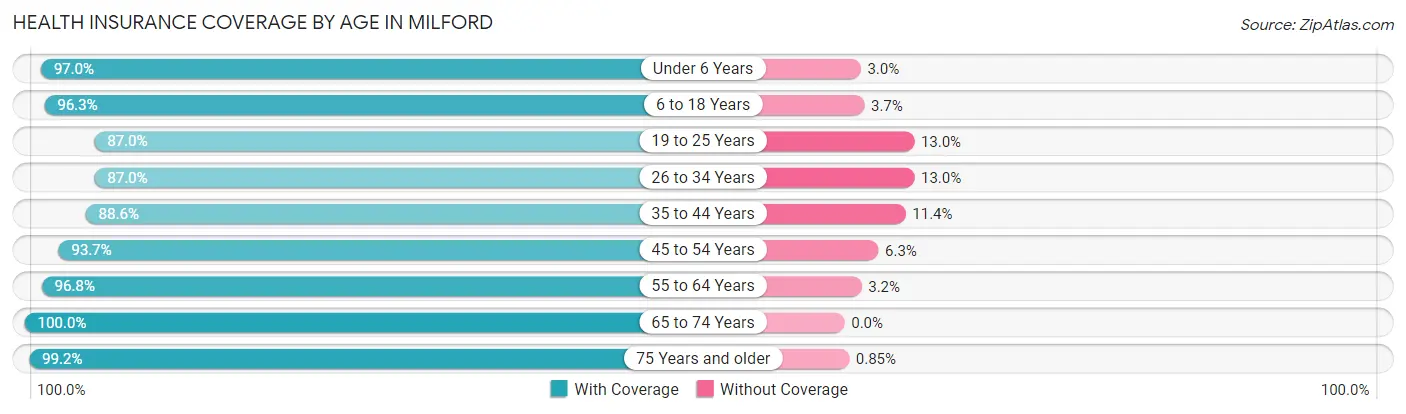
| Age Bracket | With Coverage | Without Coverage |
| Under 6 Years | 2,156 (97.0%) | 67 (3.0%) |
| 6 to 18 Years | 3,949 (96.3%) | 151 (3.7%) |
| 19 to 25 Years | 1,755 (87.0%) | 262 (13.0%) |
| 26 to 34 Years | 3,309 (87.0%) | 495 (13.0%) |
| 35 to 44 Years | 3,360 (88.6%) | 432 (11.4%) |
| 45 to 54 Years | 3,121 (93.7%) | 210 (6.3%) |
| 55 to 64 Years | 3,513 (96.8%) | 115 (3.2%) |
| 65 to 74 Years | 2,732 (100.0%) | 0 (0.0%) |
| 75 Years and older | 1,751 (99.2%) | 15 (0.9%) |
| Total | 25,646 (93.6%) | 1,747 (6.4%) |
Health Insurance Coverage by Citizenship Status in Milford
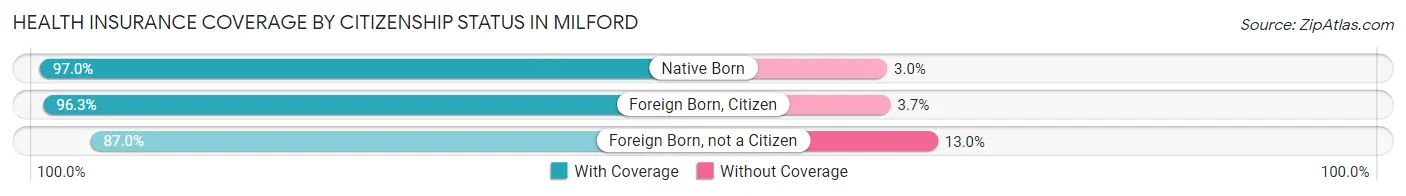
| Citizenship Status | With Coverage | Without Coverage |
| Native Born | 2,156 (97.0%) | 67 (3.0%) |
| Foreign Born, Citizen | 3,949 (96.3%) | 151 (3.7%) |
| Foreign Born, not a Citizen | 1,755 (87.0%) | 262 (13.0%) |
Health Insurance Coverage by Household Income in Milford
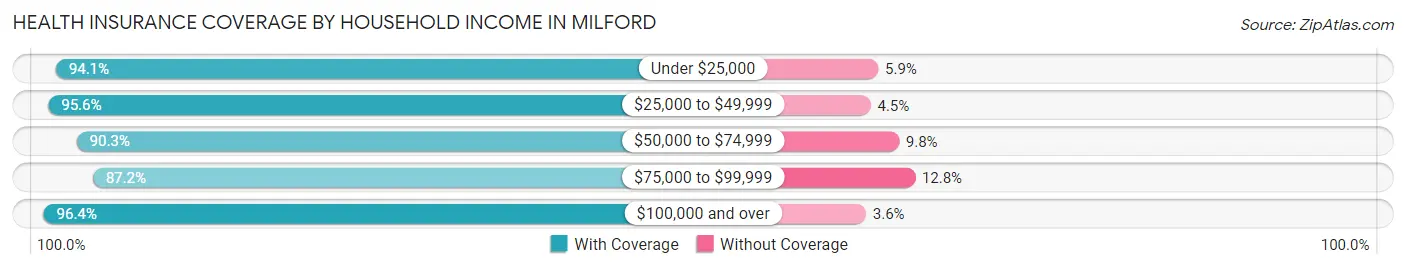
| Household Income | With Coverage | Without Coverage |
| Under $25,000 | 1,911 (94.1%) | 119 (5.9%) |
| $25,000 to $49,999 | 2,687 (95.6%) | 125 (4.4%) |
| $50,000 to $74,999 | 3,333 (90.2%) | 360 (9.8%) |
| $75,000 to $99,999 | 4,448 (87.2%) | 651 (12.8%) |
| $100,000 and over | 13,198 (96.4%) | 489 (3.6%) |
Public vs Private Health Insurance Coverage by Age in Milford
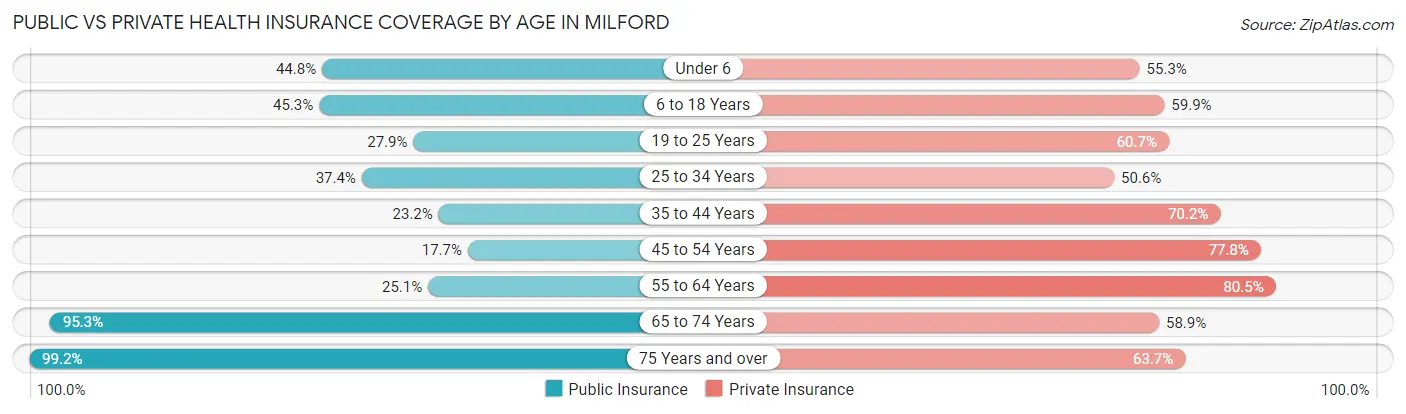
| Age Bracket | Public Insurance | Private Insurance |
| Under 6 | 996 (44.8%) | 1,229 (55.3%) |
| 6 to 18 Years | 1,859 (45.3%) | 2,455 (59.9%) |
| 19 to 25 Years | 562 (27.9%) | 1,224 (60.7%) |
| 25 to 34 Years | 1,424 (37.4%) | 1,923 (50.5%) |
| 35 to 44 Years | 878 (23.2%) | 2,663 (70.2%) |
| 45 to 54 Years | 591 (17.7%) | 2,590 (77.7%) |
| 55 to 64 Years | 911 (25.1%) | 2,920 (80.5%) |
| 65 to 74 Years | 2,604 (95.3%) | 1,609 (58.9%) |
| 75 Years and over | 1,751 (99.2%) | 1,125 (63.7%) |
| Total | 11,576 (42.3%) | 17,738 (64.7%) |
Disability Status by Sex by Age in Milford
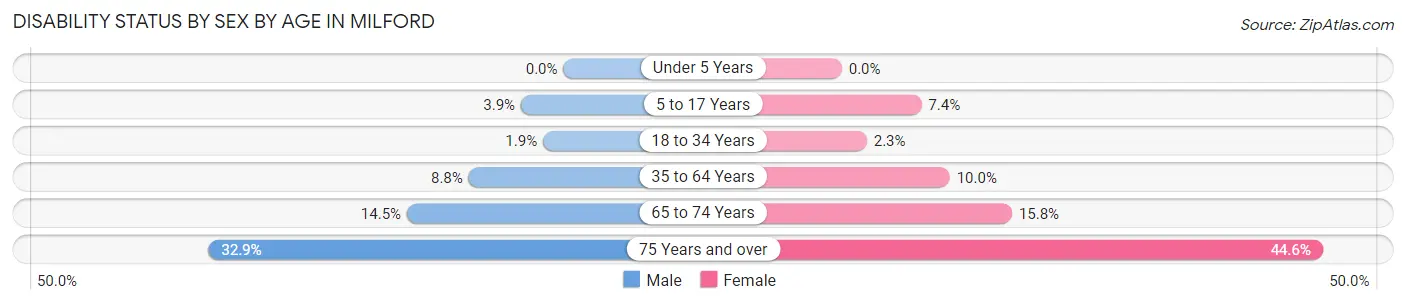
| Age Bracket | Male | Female |
| Under 5 Years | 0 (0.0%) | 0 (0.0%) |
| 5 to 17 Years | 96 (3.9%) | 122 (7.4%) |
| 18 to 34 Years | 62 (1.9%) | 69 (2.3%) |
| 35 to 64 Years | 501 (8.8%) | 506 (10.0%) |
| 65 to 74 Years | 187 (14.5%) | 228 (15.8%) |
| 75 Years and over | 226 (32.9%) | 482 (44.6%) |
Disability Class by Sex by Age in Milford
Disability Class: Hearing Difficulty
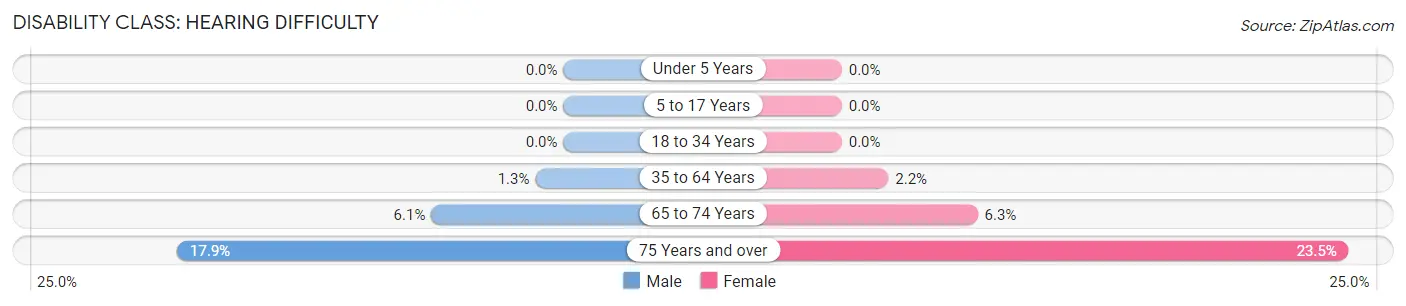
| Age Bracket | Male | Female |
| Under 5 Years | 0 (0.0%) | 0 (0.0%) |
| 5 to 17 Years | 0 (0.0%) | 0 (0.0%) |
| 18 to 34 Years | 0 (0.0%) | 0 (0.0%) |
| 35 to 64 Years | 74 (1.3%) | 109 (2.2%) |
| 65 to 74 Years | 79 (6.1%) | 91 (6.3%) |
| 75 Years and over | 123 (17.9%) | 254 (23.5%) |
Disability Class: Vision Difficulty
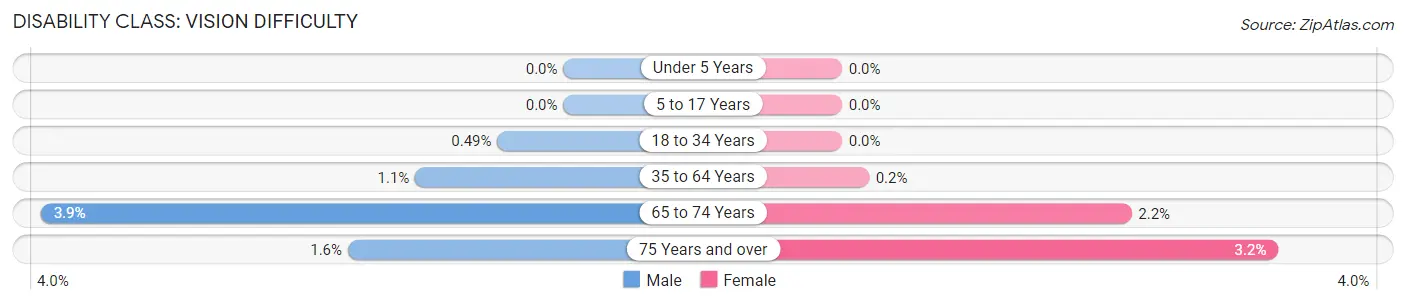
| Age Bracket | Male | Female |
| Under 5 Years | 0 (0.0%) | 0 (0.0%) |
| 5 to 17 Years | 0 (0.0%) | 0 (0.0%) |
| 18 to 34 Years | 16 (0.5%) | 0 (0.0%) |
| 35 to 64 Years | 63 (1.1%) | 10 (0.2%) |
| 65 to 74 Years | 50 (3.9%) | 31 (2.1%) |
| 75 Years and over | 11 (1.6%) | 35 (3.2%) |
Disability Class: Cognitive Difficulty
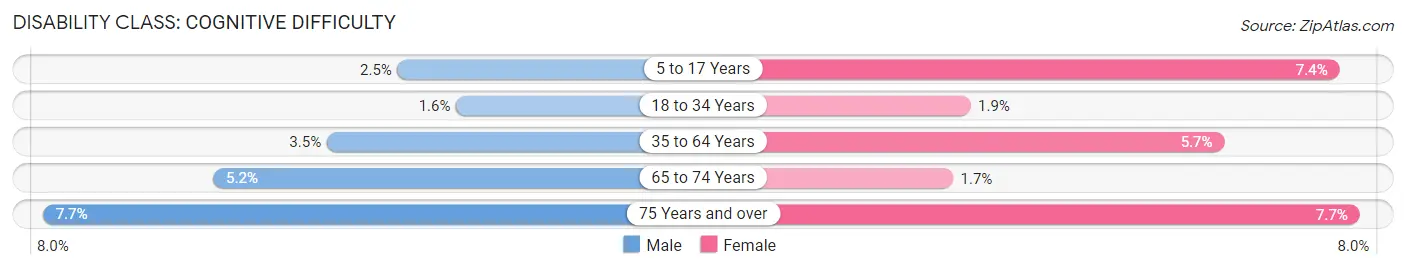
| Age Bracket | Male | Female |
| 5 to 17 Years | 60 (2.5%) | 122 (7.4%) |
| 18 to 34 Years | 52 (1.6%) | 57 (1.9%) |
| 35 to 64 Years | 200 (3.5%) | 287 (5.7%) |
| 65 to 74 Years | 67 (5.2%) | 24 (1.7%) |
| 75 Years and over | 53 (7.7%) | 83 (7.7%) |
Disability Class: Ambulatory Difficulty
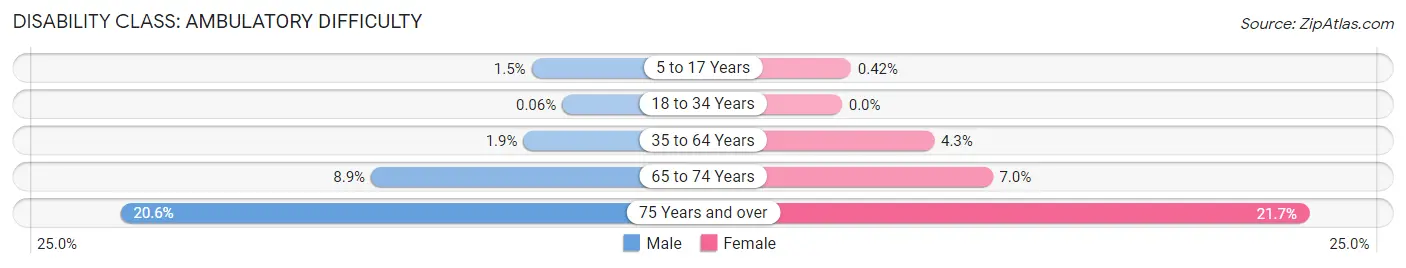
| Age Bracket | Male | Female |
| 5 to 17 Years | 36 (1.5%) | 7 (0.4%) |
| 18 to 34 Years | 2 (0.1%) | 0 (0.0%) |
| 35 to 64 Years | 106 (1.9%) | 216 (4.3%) |
| 65 to 74 Years | 115 (8.9%) | 101 (7.0%) |
| 75 Years and over | 141 (20.5%) | 234 (21.7%) |
Disability Class: Self-Care Difficulty
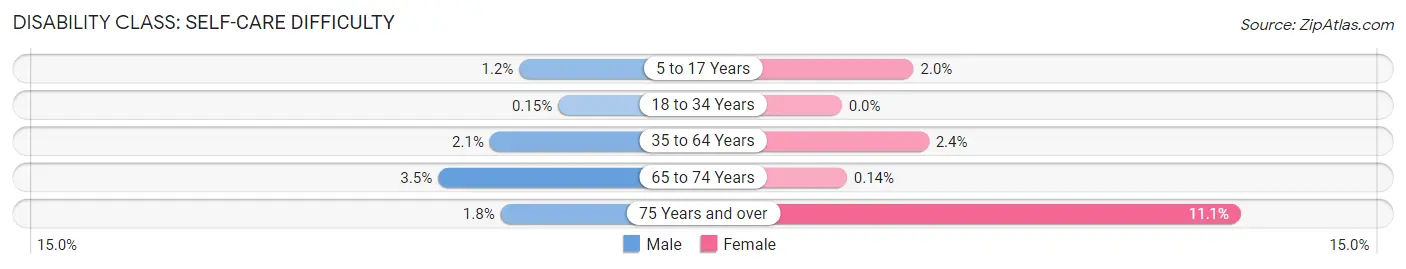
| Age Bracket | Male | Female |
| 5 to 17 Years | 30 (1.2%) | 33 (2.0%) |
| 18 to 34 Years | 5 (0.2%) | 0 (0.0%) |
| 35 to 64 Years | 117 (2.1%) | 122 (2.4%) |
| 65 to 74 Years | 45 (3.5%) | 2 (0.1%) |
| 75 Years and over | 12 (1.8%) | 120 (11.1%) |
Technology Access in Milford
Computing Device Access in Milford
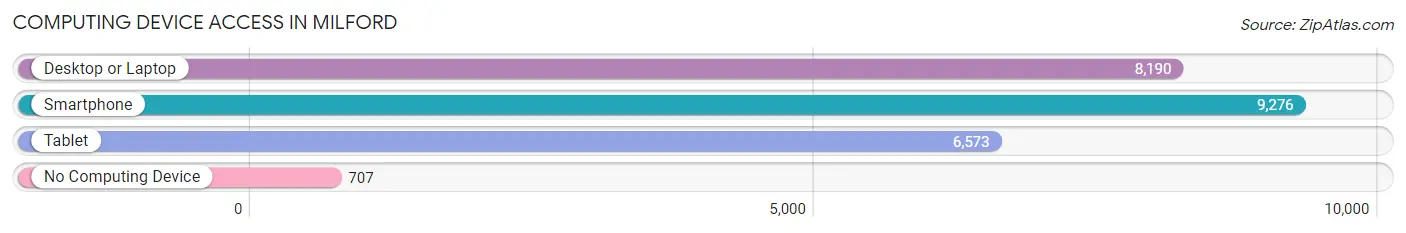
| Device Type | # Households | % Households |
| Desktop or Laptop | 8,190 | 78.2% |
| Smartphone | 9,276 | 88.6% |
| Tablet | 6,573 | 62.8% |
| No Computing Device | 707 | 6.8% |
| Total | 10,472 | 100.0% |
Internet Access in Milford
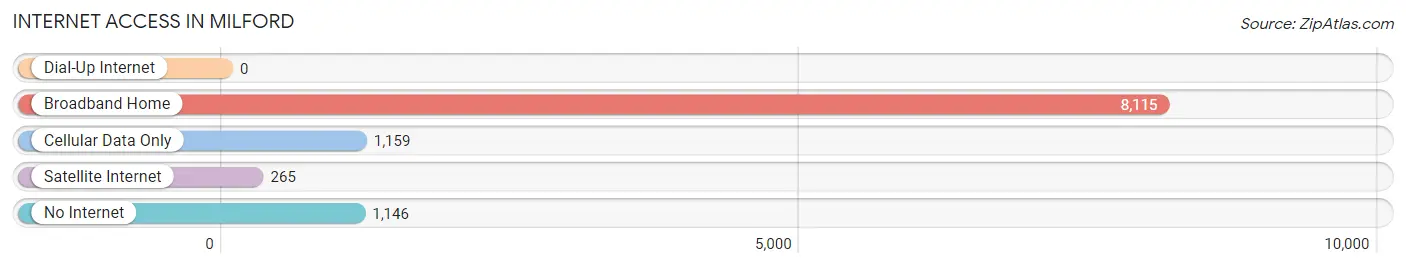
| Internet Type | # Households | % Households |
| Dial-Up Internet | 0 | 0.0% |
| Broadband Home | 8,115 | 77.5% |
| Cellular Data Only | 1,159 | 11.1% |
| Satellite Internet | 265 | 2.5% |
| No Internet | 1,146 | 10.9% |
| Total | 10,472 | 100.0% |
Milford Summary
Milford, Massachusetts is a town located in Worcester County, Massachusetts, United States. It is situated approximately 25 miles southwest of Boston and is part of the Greater Boston metropolitan area. As of the 2010 census, the town had a population of 27,999.
History
The area that is now Milford was first settled in 1662 by English settlers. The town was officially incorporated in 1780 and was named after Milford Haven in Wales. The town was originally a farming community, but it soon developed into a manufacturing center. In the 19th century, Milford was home to several mills, including a paper mill, a cotton mill, and a woolen mill.
In the early 20th century, Milford became a popular summer resort destination. The town was home to several large hotels, including the Milford Hotel, which was built in 1891. The Milford Hotel was a popular destination for wealthy Bostonians, who would come to the town to escape the summer heat.
Geography
Milford is located in central Massachusetts, approximately 25 miles southwest of Boston. The town is situated on the Charles River, which forms the town's western border. The town is bordered by Hopkinton to the north, Holliston to the east, Medway to the south, and Hopedale to the west.
The town has a total area of 16.3 square miles, of which 15.9 square miles is land and 0.4 square miles is water. The town is located in the Charles River Valley, which is characterized by rolling hills and valleys.
Economy
Milford's economy is largely based on manufacturing and retail. The town is home to several large manufacturing companies, including Milford Plastics, which produces plastic products, and Milford Metal, which produces metal products. The town is also home to several retail stores, including a Walmart Supercenter and a Target.
The town is also home to several medical facilities, including Milford Regional Medical Center and Milford Hospital. The town is also home to several educational institutions, including Milford High School and Milford Academy.
Demographics
As of the 2010 census, there were 27,999 people, 10,845 households, and 7,541 families residing in the town. The population density was 1,743.3 people per square mile. The racial makeup of the town was 92.2% White, 2.7% African American, 0.3% Native American, 1.9% Asian, 0.1% Pacific Islander, 1.3% from other races, and 2.5% from two or more races. Hispanic or Latino of any race were 4.2% of the population.
The median income for a household in the town was $71,837, and the median income for a family was $87,837. The per capita income for the town was $32,945. About 4.2% of families and 5.7% of the population were below the poverty line, including 6.7% of those under age 18 and 5.2% of those age 65 or over.
Common Questions
What is the Total Population of Milford?
Total Population of Milford is 27,569.
What is the Total Male Population of Milford?
Total Male Population of Milford is 14,379.
What is the Total Female Population of Milford?
Total Female Population of Milford is 13,190.
What is the Ratio of Males per 100 Females in Milford?
There are 109.01 Males per 100 Females in Milford.
What is the Ratio of Females per 100 Males in Milford?
There are 91.73 Females per 100 Males in Milford.
What is the Median Population Age in Milford?
Median Population Age in Milford is 39.3 Years.
What is the Average Family Size in Milford
Average Family Size in Milford is 3.2 People.
What is the Average Household Size in Milford
Average Household Size in Milford is 2.6 People.
What is Per Capita Income in Milford?
Per Capita income in Milford is $42,761.
What is the Median Family Income in Milford?
Median Family Income in Milford is $106,629.
What is the Median Household income in Milford?
Median Household Income in Milford is $89,608.
What is Income or Wage Gap in Milford?
Income or Wage Gap in Milford is 40.6%.
Women in Milford earn 59.4 cents for every dollar earned by a man.
What is Inequality or Gini Index in Milford?
Inequality or Gini Index in Milford is 0.41.
How Large is the Labor Force in Milford?
There are 16,067 People in the Labor Forcein in Milford.
What is the Percentage of People in the Labor Force in Milford?
72.1% of People are in the Labor Force in Milford.
What is the Unemployment Rate in Milford?
Unemployment Rate in Milford is 5.9%.