Saugus, MA
Saugus Map
Saugus Overview
28,566
TOTAL POPULATION
14,013
MALE POPULATION
14,553
FEMALE POPULATION
96.29
MALES / 100 FEMALES
103.85
FEMALES / 100 MALES
44.4
MEDIAN AGE
3.1
AVG FAMILY SIZE
2.6
AVG HOUSEHOLD SIZE
$46,357
PER CAPITA INCOME
$110,597
AVG FAMILY INCOME
$96,064
AVG HOUSEHOLD INCOME
16.8%
WAGE / INCOME GAP [ % ]
83.2¢/ $1
WAGE / INCOME GAP [ $ ]
0.44
INEQUALITY / GINI INDEX
15,879
LABOR FORCE [ PEOPLE ]
64.8%
PERCENT IN LABOR FORCE
3.4%
UNEMPLOYMENT RATE
Saugus Zip Codes
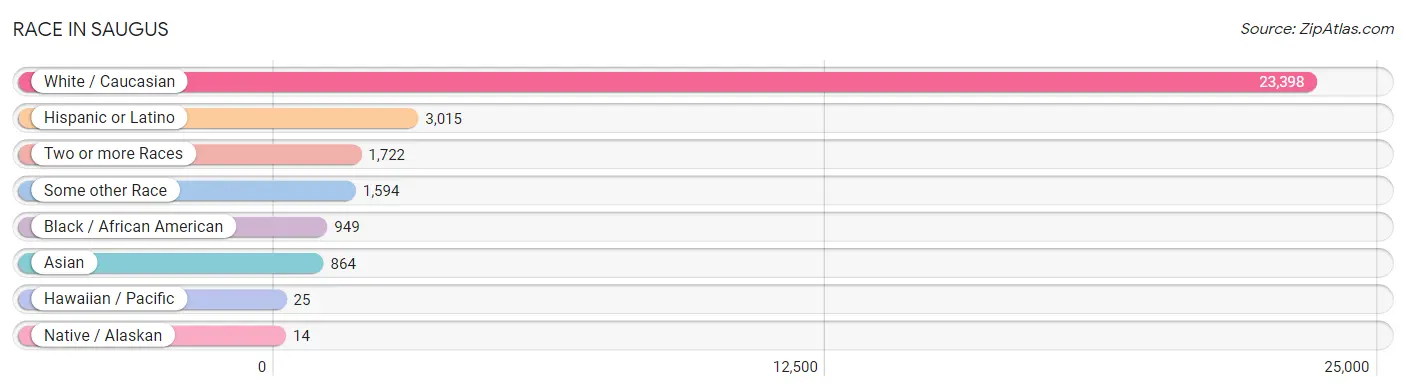
Race in Saugus
The most populous races in Saugus are White / Caucasian (23,398 | 81.9%), Hispanic or Latino (3,015 | 10.5%), and Two or more Races (1,722 | 6.0%).
| Race | # Population | % Population |
| Asian | 864 | 3.0% |
| Black / African American | 949 | 3.3% |
| Hawaiian / Pacific | 25 | 0.1% |
| Hispanic or Latino | 3,015 | 10.5% |
| Native / Alaskan | 14 | 0.1% |
| White / Caucasian | 23,398 | 81.9% |
| Two or more Races | 1,722 | 6.0% |
| Some other Race | 1,594 | 5.6% |
| Total | 28,566 | 100.0% |
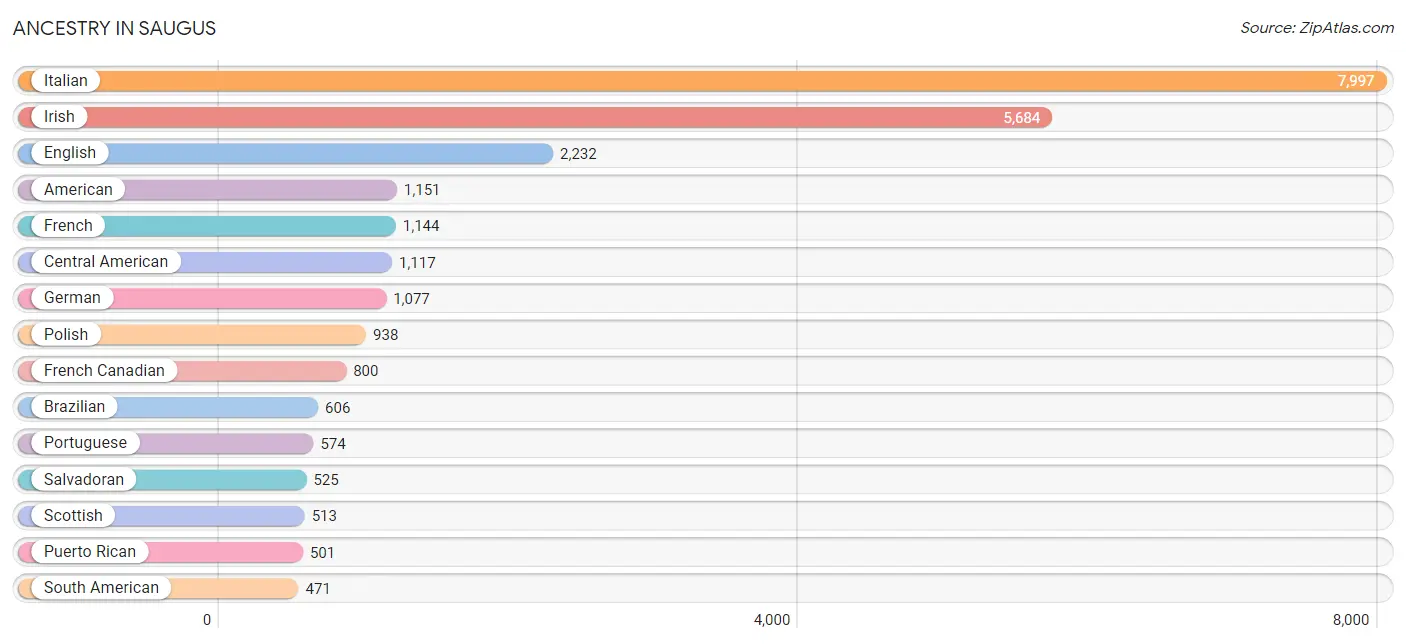
Ancestry in Saugus
The most populous ancestries reported in Saugus are Italian (7,997 | 28.0%), Irish (5,684 | 19.9%), English (2,232 | 7.8%), American (1,151 | 4.0%), and French (1,144 | 4.0%), together accounting for 63.7% of all Saugus residents.
| Ancestry | # Population | % Population |
| African | 72 | 0.3% |
| Albanian | 201 | 0.7% |
| American | 1,151 | 4.0% |
| Arab | 445 | 1.6% |
| Argentinean | 21 | 0.1% |
| Armenian | 157 | 0.5% |
| Austrian | 25 | 0.1% |
| Belgian | 25 | 0.1% |
| Blackfeet | 14 | 0.1% |
| Brazilian | 606 | 2.1% |
| British | 14 | 0.1% |
| Burmese | 107 | 0.4% |
| Cajun | 26 | 0.1% |
| Canadian | 129 | 0.4% |
| Cape Verdean | 81 | 0.3% |
| Celtic | 14 | 0.1% |
| Central American | 1,117 | 3.9% |
| Cherokee | 30 | 0.1% |
| Colombian | 375 | 1.3% |
| Czechoslovakian | 11 | 0.0% |
| Danish | 150 | 0.5% |
| Dominican | 80 | 0.3% |
| Dutch | 89 | 0.3% |
| Eastern European | 4 | 0.0% |
| English | 2,232 | 7.8% |
| European | 64 | 0.2% |
| Finnish | 63 | 0.2% |
| French | 1,144 | 4.0% |
| French Canadian | 800 | 2.8% |
| German | 1,077 | 3.8% |
| Greek | 407 | 1.4% |
| Guatemalan | 417 | 1.5% |
| Haitian | 427 | 1.5% |
| Honduran | 175 | 0.6% |
| Icelander | 26 | 0.1% |
| Indian (Asian) | 453 | 1.6% |
| Irish | 5,684 | 19.9% |
| Italian | 7,997 | 28.0% |
| Jamaican | 79 | 0.3% |
| Japanese | 82 | 0.3% |
| Jordanian | 20 | 0.1% |
| Korean | 148 | 0.5% |
| Lebanese | 66 | 0.2% |
| Lithuanian | 63 | 0.2% |
| Mexican | 89 | 0.3% |
| Moroccan | 150 | 0.5% |
| Northern European | 3 | 0.0% |
| Norwegian | 90 | 0.3% |
| Pakistani | 14 | 0.1% |
| Peruvian | 75 | 0.3% |
| Polish | 938 | 3.3% |
| Portuguese | 574 | 2.0% |
| Puerto Rican | 501 | 1.8% |
| Romanian | 119 | 0.4% |
| Russian | 189 | 0.7% |
| Salvadoran | 525 | 1.8% |
| Scotch-Irish | 98 | 0.3% |
| Scottish | 513 | 1.8% |
| South American | 471 | 1.7% |
| South American Indian | 6 | 0.0% |
| Spaniard | 99 | 0.4% |
| Spanish | 20 | 0.1% |
| Sri Lankan | 89 | 0.3% |
| Subsaharan African | 222 | 0.8% |
| Swedish | 258 | 0.9% |
| Syrian | 181 | 0.6% |
| Thai | 55 | 0.2% |
| Ukrainian | 110 | 0.4% |
| Welsh | 23 | 0.1% | View All 69 Rows |
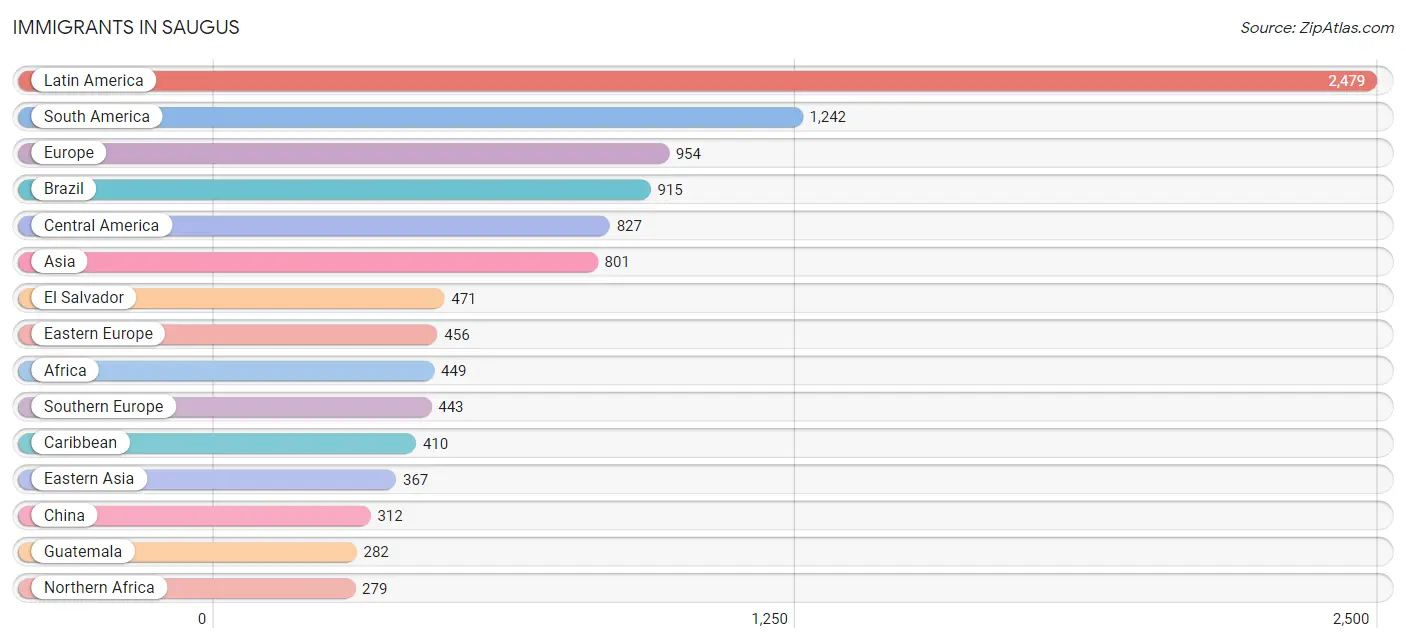
Immigrants in Saugus
The most numerous immigrant groups reported in Saugus came from Latin America (2,479 | 8.7%), South America (1,242 | 4.3%), Europe (954 | 3.3%), Brazil (915 | 3.2%), and Central America (827 | 2.9%), together accounting for 22.5% of all Saugus residents.
| Immigration Origin | # Population | % Population |
| Africa | 449 | 1.6% |
| Albania | 111 | 0.4% |
| Asia | 801 | 2.8% |
| Azores | 43 | 0.2% |
| Brazil | 915 | 3.2% |
| Cabo Verde | 93 | 0.3% |
| Cambodia | 24 | 0.1% |
| Cameroon | 29 | 0.1% |
| Canada | 158 | 0.5% |
| Caribbean | 410 | 1.4% |
| Central America | 827 | 2.9% |
| China | 312 | 1.1% |
| Colombia | 237 | 0.8% |
| Dominican Republic | 141 | 0.5% |
| Eastern Asia | 367 | 1.3% |
| Eastern Europe | 456 | 1.6% |
| Egypt | 21 | 0.1% |
| El Salvador | 471 | 1.7% |
| Europe | 954 | 3.3% |
| Germany | 18 | 0.1% |
| Greece | 34 | 0.1% |
| Guatemala | 282 | 1.0% |
| Haiti | 251 | 0.9% |
| Honduras | 74 | 0.3% |
| Hong Kong | 18 | 0.1% |
| India | 55 | 0.2% |
| Italy | 275 | 1.0% |
| Jamaica | 18 | 0.1% |
| Jordan | 20 | 0.1% |
| Korea | 55 | 0.2% |
| Latin America | 2,479 | 8.7% |
| Lebanon | 18 | 0.1% |
| Middle Africa | 41 | 0.1% |
| Morocco | 249 | 0.9% |
| Nepal | 39 | 0.1% |
| Northern Africa | 279 | 1.0% |
| Northern Europe | 37 | 0.1% |
| Norway | 12 | 0.0% |
| Pakistan | 2 | 0.0% |
| Peru | 90 | 0.3% |
| Philippines | 34 | 0.1% |
| Poland | 143 | 0.5% |
| Portugal | 71 | 0.3% |
| Russia | 67 | 0.2% |
| South America | 1,242 | 4.3% |
| South Central Asia | 130 | 0.5% |
| South Eastern Asia | 98 | 0.3% |
| Southern Europe | 443 | 1.5% |
| Spain | 63 | 0.2% |
| Sri Lanka | 34 | 0.1% |
| Sweden | 10 | 0.0% |
| Syria | 168 | 0.6% |
| Thailand | 14 | 0.1% |
| Ukraine | 8 | 0.0% |
| Vietnam | 26 | 0.1% |
| Western Africa | 129 | 0.4% |
| Western Asia | 206 | 0.7% |
| Western Europe | 18 | 0.1% | View All 58 Rows |
Sex and Age in Saugus
Sex and Age in Saugus
The most populous age groups in Saugus are 35 to 39 Years (1,057 | 7.5%) for men and 30 to 34 Years (1,266 | 8.7%) for women.
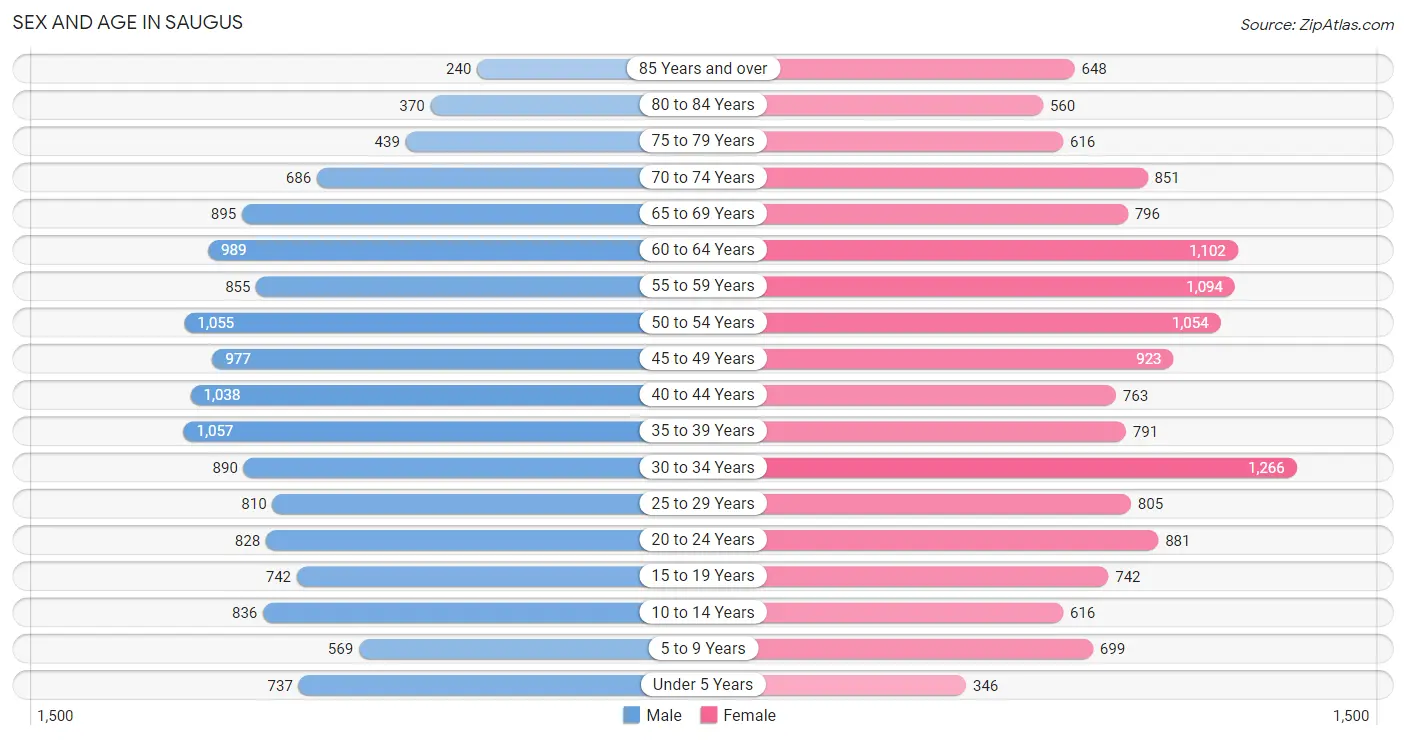
| Age Bracket | Male | Female |
| Under 5 Years | 737 (5.3%) | 346 (2.4%) |
| 5 to 9 Years | 569 (4.1%) | 699 (4.8%) |
| 10 to 14 Years | 836 (6.0%) | 616 (4.2%) |
| 15 to 19 Years | 742 (5.3%) | 742 (5.1%) |
| 20 to 24 Years | 828 (5.9%) | 881 (6.0%) |
| 25 to 29 Years | 810 (5.8%) | 805 (5.5%) |
| 30 to 34 Years | 890 (6.4%) | 1,266 (8.7%) |
| 35 to 39 Years | 1,057 (7.5%) | 791 (5.4%) |
| 40 to 44 Years | 1,038 (7.4%) | 763 (5.2%) |
| 45 to 49 Years | 977 (7.0%) | 923 (6.3%) |
| 50 to 54 Years | 1,055 (7.5%) | 1,054 (7.2%) |
| 55 to 59 Years | 855 (6.1%) | 1,094 (7.5%) |
| 60 to 64 Years | 989 (7.1%) | 1,102 (7.6%) |
| 65 to 69 Years | 895 (6.4%) | 796 (5.5%) |
| 70 to 74 Years | 686 (4.9%) | 851 (5.9%) |
| 75 to 79 Years | 439 (3.1%) | 616 (4.2%) |
| 80 to 84 Years | 370 (2.6%) | 560 (3.8%) |
| 85 Years and over | 240 (1.7%) | 648 (4.4%) |
| Total | 14,013 (100.0%) | 14,553 (100.0%) |
Families and Households in Saugus
Median Family Size in Saugus
The median family size in Saugus is 3.09 persons per family, with married-couple families (5,911 | 78.6%) accounting for the largest median family size of 3.2 persons per family. On the other hand, single female/mother families (1,009 | 13.4%) represent the smallest median family size with 2.66 persons per family.
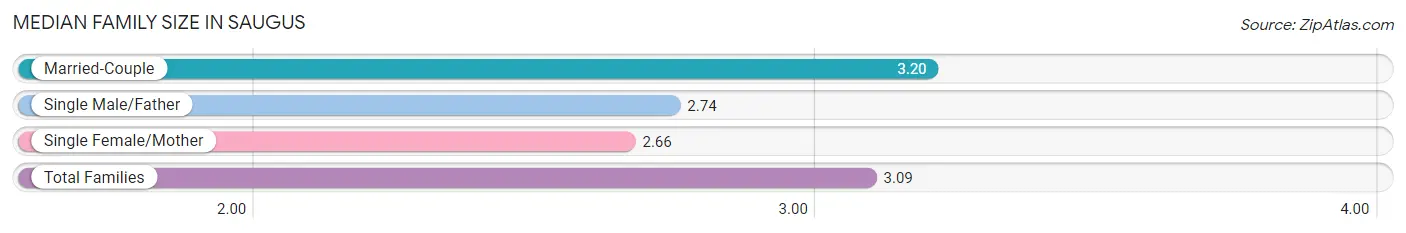
| Family Type | # Families | Family Size |
| Married-Couple | 5,911 (78.6%) | 3.20 |
| Single Male/Father | 603 (8.0%) | 2.74 |
| Single Female/Mother | 1,009 (13.4%) | 2.66 |
| Total Families | 7,523 (100.0%) | 3.09 |
Median Household Size in Saugus
The median household size in Saugus is 2.62 persons per household, with married-couple households (5,911 | 54.9%) accounting for the largest median household size of 3.27 persons per household. non-family households (3,245 | 30.1%) represent the smallest median household size with 1.26 persons per household.
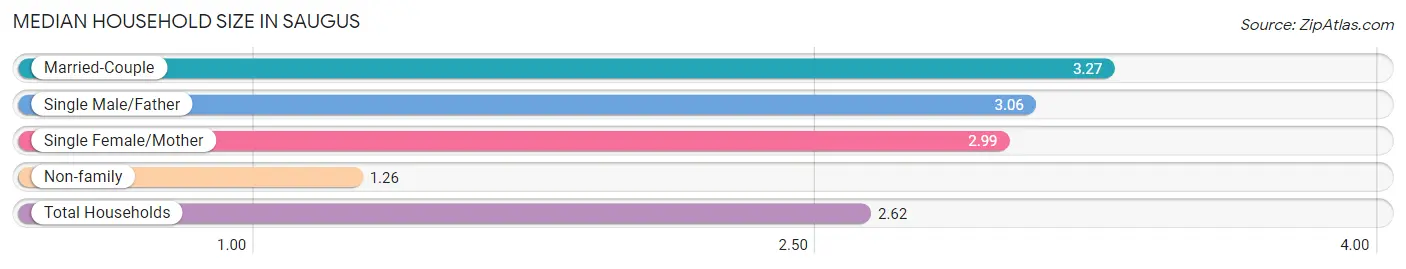
| Household Type | # Households | Household Size |
| Married-Couple | 5,911 (54.9%) | 3.27 |
| Single Male/Father | 603 (5.6%) | 3.06 |
| Single Female/Mother | 1,009 (9.4%) | 2.99 |
| Non-family | 3,245 (30.1%) | 1.26 |
| Total Households | 10,768 (100.0%) | 2.62 |
Household Size by Marriage Status in Saugus
Out of a total of 10,768 households in Saugus, 7,523 (69.9%) are family households, while 3,245 (30.1%) are nonfamily households. The most numerous type of family households are 2-person households, comprising 3,045, and the most common type of nonfamily households are 1-person households, comprising 2,592.
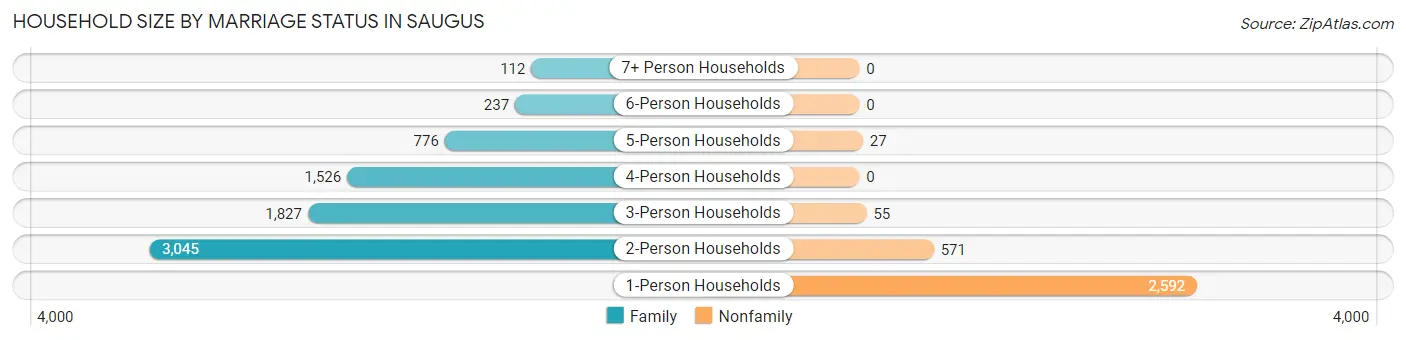
| Household Size | Family Households | Nonfamily Households |
| 1-Person Households | - | 2,592 (24.1%) |
| 2-Person Households | 3,045 (28.3%) | 571 (5.3%) |
| 3-Person Households | 1,827 (17.0%) | 55 (0.5%) |
| 4-Person Households | 1,526 (14.2%) | 0 (0.0%) |
| 5-Person Households | 776 (7.2%) | 27 (0.3%) |
| 6-Person Households | 237 (2.2%) | 0 (0.0%) |
| 7+ Person Households | 112 (1.0%) | 0 (0.0%) |
| Total | 7,523 (69.9%) | 3,245 (30.1%) |
Female Fertility in Saugus
Fertility by Age in Saugus
Average fertility rate in Saugus is 33.0 births per 1,000 women. Women in the age bracket of 20 to 34 years have the highest fertility rate with 44.0 births per 1,000 women. Women in the age bracket of 20 to 34 years acount for 62.1% of all women with births.
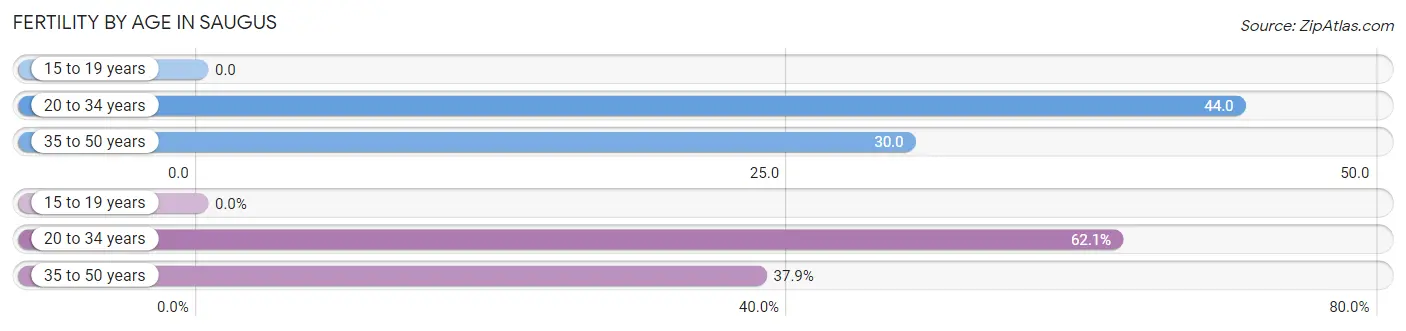
| Age Bracket | Women with Births | Births / 1,000 Women |
| 15 to 19 years | 0 (0.0%) | 0.0 |
| 20 to 34 years | 131 (62.1%) | 44.0 |
| 35 to 50 years | 80 (37.9%) | 30.0 |
| Total | 211 (100.0%) | 33.0 |
Fertility by Age by Marriage Status in Saugus
63.0% of women with births (211) in Saugus are married. The highest percentage of unmarried women with births falls into 20 to 34 years age bracket with 59.5% of them unmarried at the time of birth, while the lowest percentage of unmarried women with births belong to 35 to 50 years age bracket with 0.0% of them unmarried.
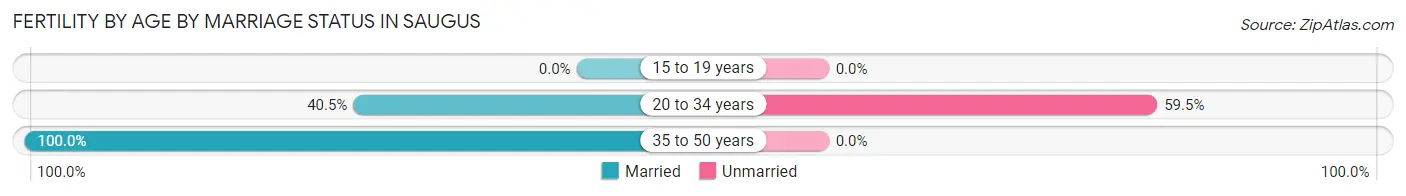
| Age Bracket | Married | Unmarried |
| 15 to 19 years | 0 (0.0%) | 0 (0.0%) |
| 20 to 34 years | 53 (40.5%) | 78 (59.5%) |
| 35 to 50 years | 80 (100.0%) | 0 (0.0%) |
| Total | 133 (63.0%) | 78 (37.0%) |
Fertility by Education in Saugus
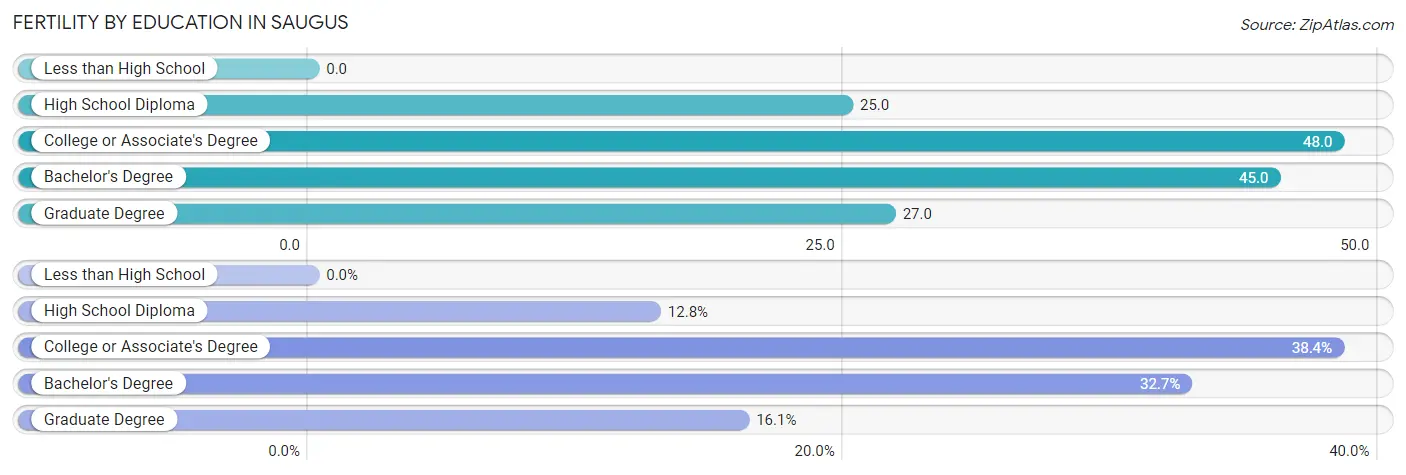
| Educational Attainment | Women with Births | Births / 1,000 Women |
| Less than High School | 0 (0.0%) | 0.0 |
| High School Diploma | 27 (12.8%) | 25.0 |
| College or Associate's Degree | 81 (38.4%) | 48.0 |
| Bachelor's Degree | 69 (32.7%) | 45.0 |
| Graduate Degree | 34 (16.1%) | 27.0 |
| Total | 211 (100.0%) | 33.0 |
Fertility by Education by Marriage Status in Saugus
37.0% of women with births in Saugus are unmarried. Women with the educational attainment of graduate degree are most likely to be married with 100.0% of them married at childbirth, while women with the educational attainment of college or associate's degree are least likely to be married with 58.0% of them unmarried at childbirth.
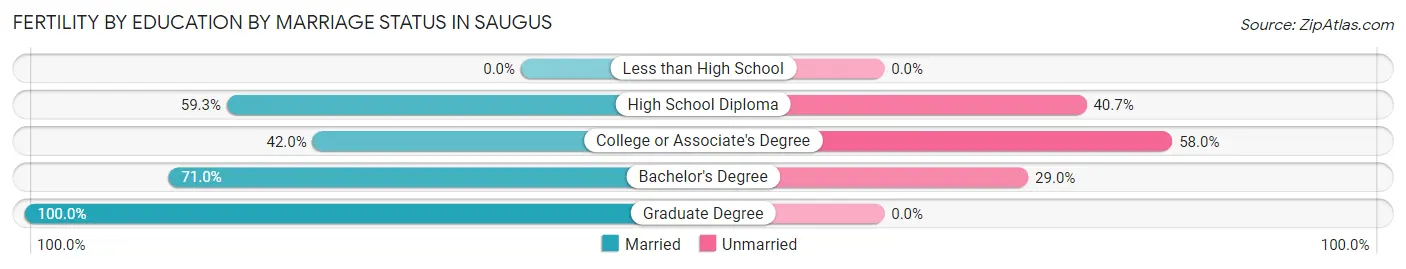
| Educational Attainment | Married | Unmarried |
| Less than High School | 0 (0.0%) | 0 (0.0%) |
| High School Diploma | 16 (59.3%) | 11 (40.7%) |
| College or Associate's Degree | 34 (42.0%) | 47 (58.0%) |
| Bachelor's Degree | 49 (71.0%) | 20 (29.0%) |
| Graduate Degree | 34 (100.0%) | 0 (0.0%) |
| Total | 133 (63.0%) | 78 (37.0%) |
Income in Saugus
Income Overview in Saugus
Per Capita Income in Saugus is $46,357, while median incomes of families and households are $110,597 and $96,064 respectively.
| Characteristic | Number | Measure |
| Per Capita Income | 28,566 | $46,357 |
| Median Family Income | 7,523 | $110,597 |
| Mean Family Income | 7,523 | $135,623 |
| Median Household Income | 10,768 | $96,064 |
| Mean Household Income | 10,768 | $118,431 |
| Income Deficit | 7,523 | $0 |
| Wage / Income Gap (%) | 28,566 | 16.80% |
| Wage / Income Gap ($) | 28,566 | 83.20¢ per $1 |
| Gini / Inequality Index | 28,566 | 0.44 |
Earnings by Sex in Saugus
Average Earnings in Saugus are $51,468, $56,879 for men and $47,325 for women, a difference of 16.8%.
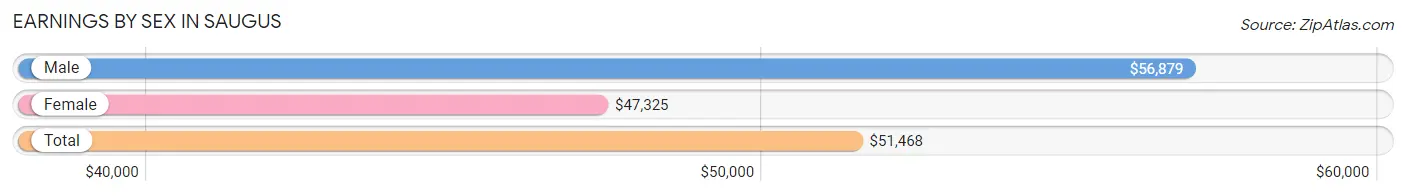
| Sex | Number | Average Earnings |
| Male | 8,369 (50.7%) | $56,879 |
| Female | 8,139 (49.3%) | $47,325 |
| Total | 16,508 (100.0%) | $51,468 |
Earnings by Sex by Income Bracket in Saugus
The most common earnings brackets in Saugus are $100,000+ for men (1,734 | 20.7%) and $100,000+ for women (1,018 | 12.5%).
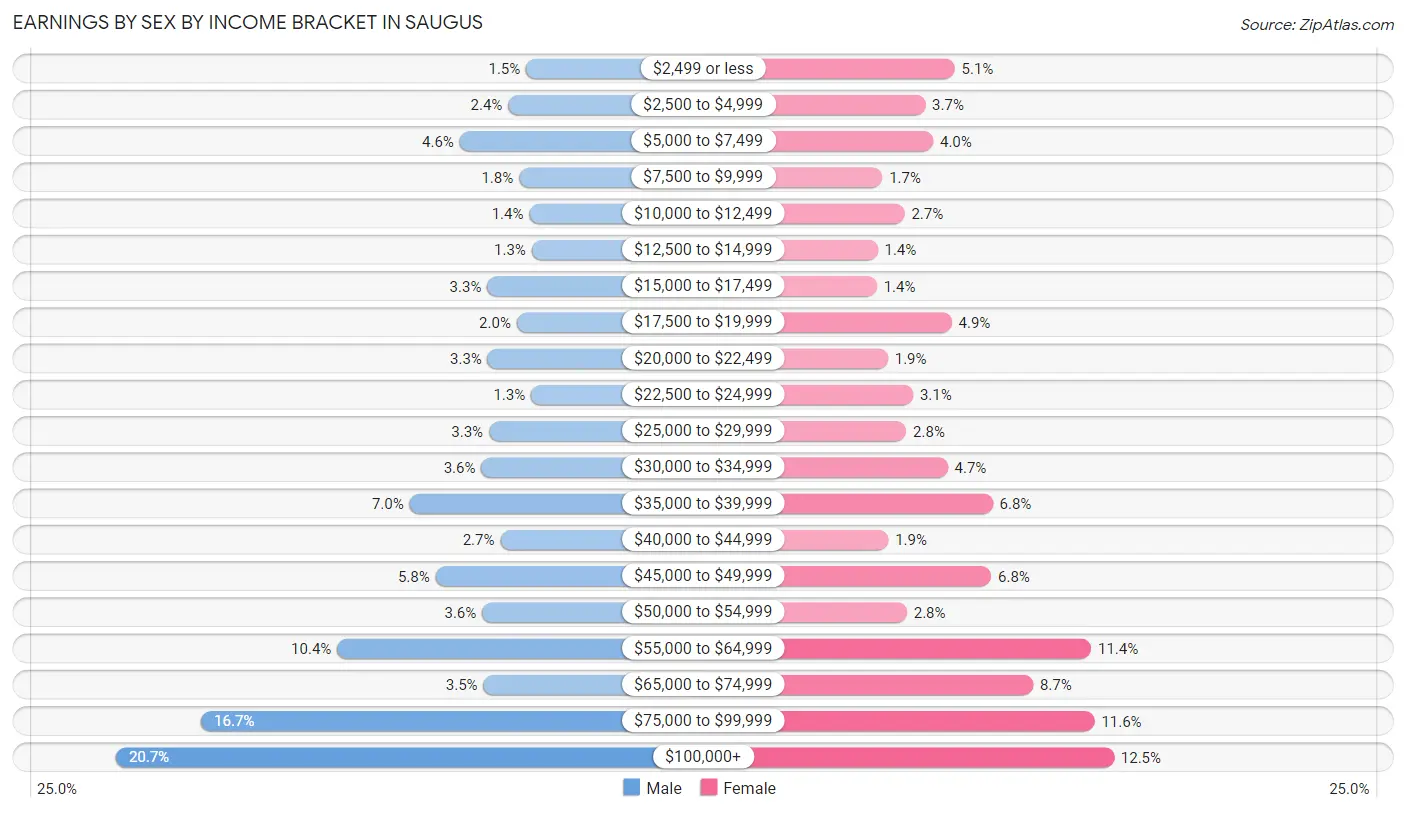
| Income | Male | Female |
| $2,499 or less | 126 (1.5%) | 411 (5.1%) |
| $2,500 to $4,999 | 197 (2.4%) | 299 (3.7%) |
| $5,000 to $7,499 | 387 (4.6%) | 329 (4.0%) |
| $7,500 to $9,999 | 154 (1.8%) | 135 (1.7%) |
| $10,000 to $12,499 | 114 (1.4%) | 220 (2.7%) |
| $12,500 to $14,999 | 105 (1.3%) | 117 (1.4%) |
| $15,000 to $17,499 | 279 (3.3%) | 114 (1.4%) |
| $17,500 to $19,999 | 163 (1.9%) | 400 (4.9%) |
| $20,000 to $22,499 | 277 (3.3%) | 156 (1.9%) |
| $22,500 to $24,999 | 107 (1.3%) | 252 (3.1%) |
| $25,000 to $29,999 | 272 (3.3%) | 226 (2.8%) |
| $30,000 to $34,999 | 302 (3.6%) | 384 (4.7%) |
| $35,000 to $39,999 | 583 (7.0%) | 556 (6.8%) |
| $40,000 to $44,999 | 228 (2.7%) | 158 (1.9%) |
| $45,000 to $49,999 | 481 (5.8%) | 550 (6.8%) |
| $50,000 to $54,999 | 299 (3.6%) | 229 (2.8%) |
| $55,000 to $64,999 | 867 (10.4%) | 931 (11.4%) |
| $65,000 to $74,999 | 294 (3.5%) | 710 (8.7%) |
| $75,000 to $99,999 | 1,400 (16.7%) | 944 (11.6%) |
| $100,000+ | 1,734 (20.7%) | 1,018 (12.5%) |
| Total | 8,369 (100.0%) | 8,139 (100.0%) |
Earnings by Sex by Educational Attainment in Saugus
Average earnings in Saugus are $62,445 for men and $55,205 for women, a difference of 11.6%. Men with an educational attainment of graduate degree enjoy the highest average annual earnings of $106,719, while those with less than high school education earn the least with $49,032. Women with an educational attainment of graduate degree earn the most with the average annual earnings of $77,411, while those with less than high school education have the smallest earnings of $30,096.
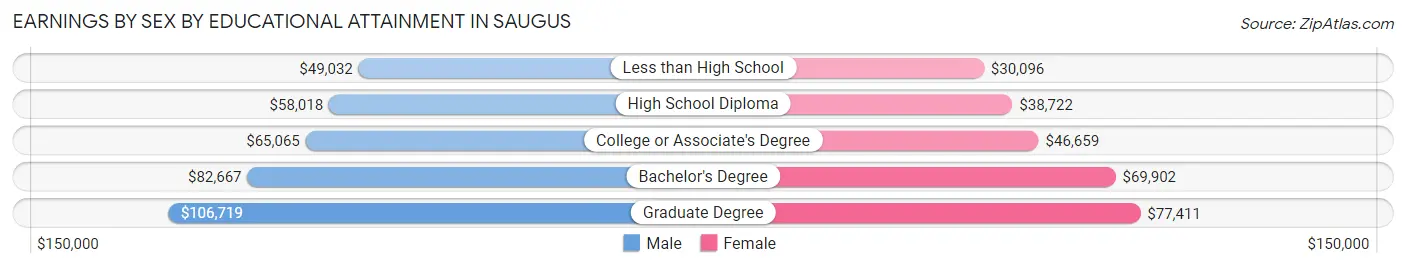
| Educational Attainment | Male Income | Female Income |
| Less than High School | $49,032 | $30,096 |
| High School Diploma | $58,018 | $38,722 |
| College or Associate's Degree | $65,065 | $46,659 |
| Bachelor's Degree | $82,667 | $69,902 |
| Graduate Degree | $106,719 | $77,411 |
| Total | $62,445 | $55,205 |
Family Income in Saugus
Family Income Brackets in Saugus
According to the Saugus family income data, there are 2,091 families falling into the $100,000 to $149,999 income range, which is the most common income bracket and makes up 27.8% of all families. Conversely, the $10,000 to $14,999 income bracket is the least frequent group with only 53 families (0.7%) belonging to this category.
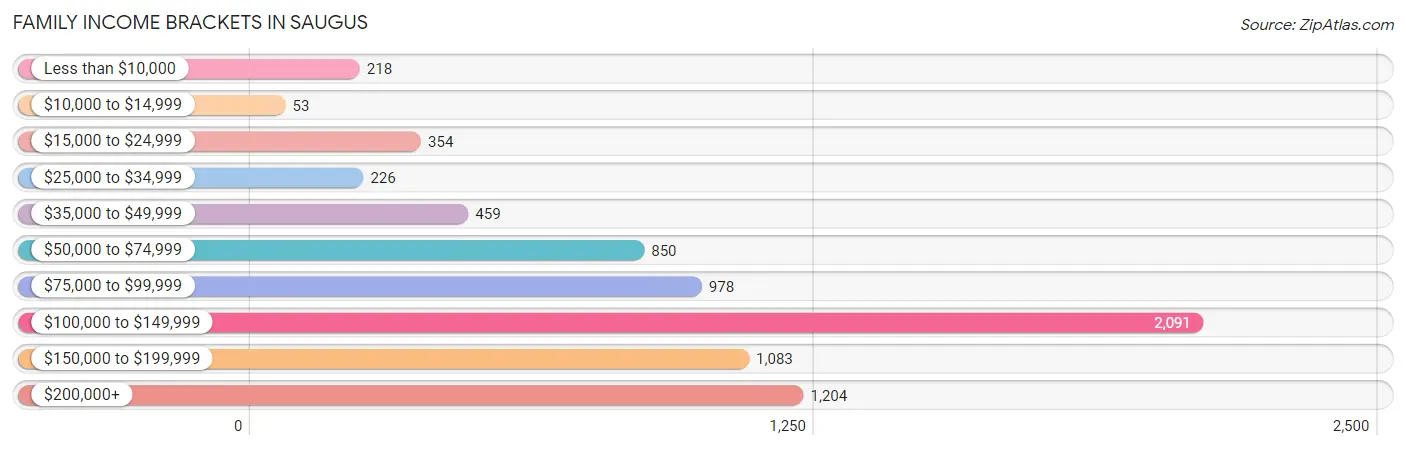
| Income Bracket | # Families | % Families |
| Less than $10,000 | 218 | 2.9% |
| $10,000 to $14,999 | 53 | 0.7% |
| $15,000 to $24,999 | 354 | 4.7% |
| $25,000 to $34,999 | 226 | 3.0% |
| $35,000 to $49,999 | 459 | 6.1% |
| $50,000 to $74,999 | 850 | 11.3% |
| $75,000 to $99,999 | 978 | 13.0% |
| $100,000 to $149,999 | 2,091 | 27.8% |
| $150,000 to $199,999 | 1,083 | 14.4% |
| $200,000+ | 1,204 | 16.0% |
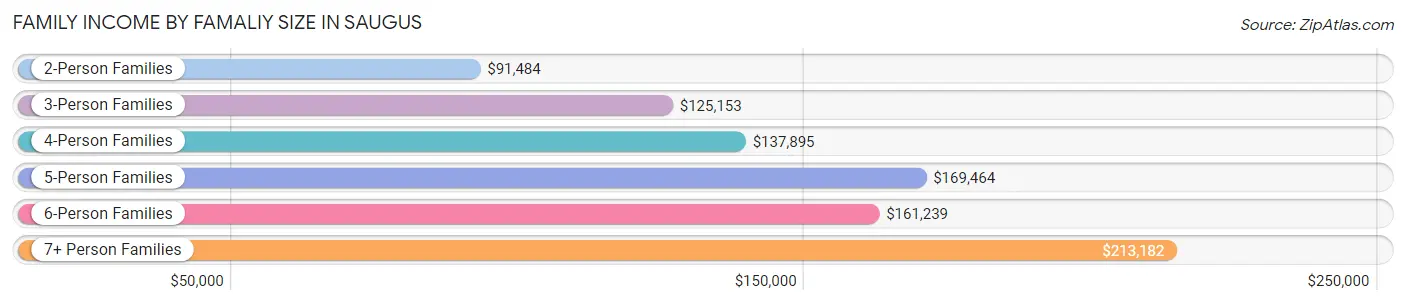
Family Income by Famaliy Size in Saugus
7+ person families (112 | 1.5%) account for the highest median family income in Saugus with $213,182 per family, while 2-person families (3,447 | 45.8%) have the highest median income of $45,742 per family member.
| Income Bracket | # Families | Median Income |
| 2-Person Families | 3,447 (45.8%) | $91,484 |
| 3-Person Families | 1,730 (23.0%) | $125,153 |
| 4-Person Families | 1,440 (19.1%) | $137,895 |
| 5-Person Families | 582 (7.7%) | $169,464 |
| 6-Person Families | 212 (2.8%) | $161,239 |
| 7+ Person Families | 112 (1.5%) | $213,182 |
| Total | 7,523 (100.0%) | $110,597 |
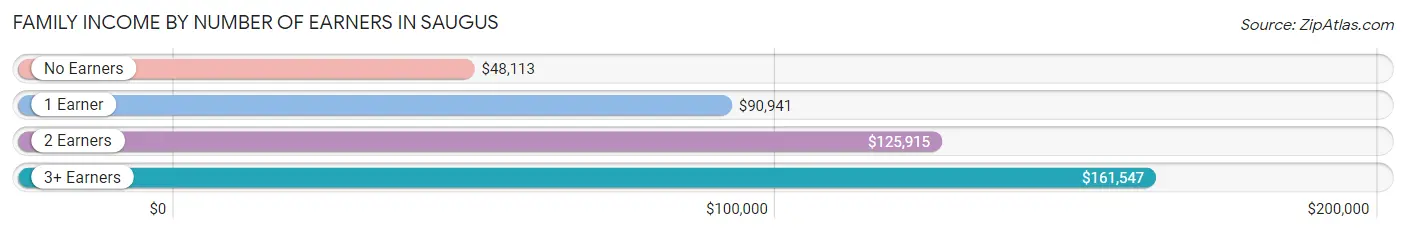
Family Income by Number of Earners in Saugus
The median family income in Saugus is $110,597, with families comprising 3+ earners (1,488) having the highest median family income of $161,547, while families with no earners (1,216) have the lowest median family income of $48,113, accounting for 19.8% and 16.2% of families, respectively.
| Number of Earners | # Families | Median Income |
| No Earners | 1,216 (16.2%) | $48,113 |
| 1 Earner | 1,648 (21.9%) | $90,941 |
| 2 Earners | 3,171 (42.1%) | $125,915 |
| 3+ Earners | 1,488 (19.8%) | $161,547 |
| Total | 7,523 (100.0%) | $110,597 |
Household Income in Saugus
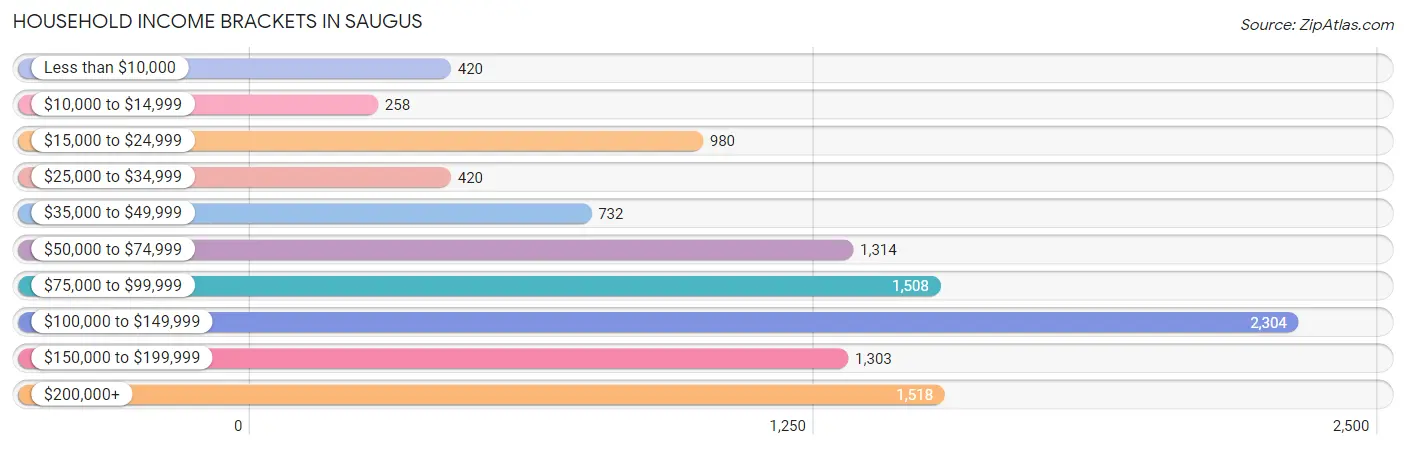
Household Income Brackets in Saugus
With 2,304 households falling in the category, the $100,000 to $149,999 income range is the most frequent in Saugus, accounting for 21.4% of all households. In contrast, only 258 households (2.4%) fall into the $10,000 to $14,999 income bracket, making it the least populous group.
| Income Bracket | # Households | % Households |
| Less than $10,000 | 420 | 3.9% |
| $10,000 to $14,999 | 258 | 2.4% |
| $15,000 to $24,999 | 980 | 9.1% |
| $25,000 to $34,999 | 420 | 3.9% |
| $35,000 to $49,999 | 732 | 6.8% |
| $50,000 to $74,999 | 1,314 | 12.2% |
| $75,000 to $99,999 | 1,508 | 14.0% |
| $100,000 to $149,999 | 2,304 | 21.4% |
| $150,000 to $199,999 | 1,303 | 12.1% |
| $200,000+ | 1,518 | 14.1% |
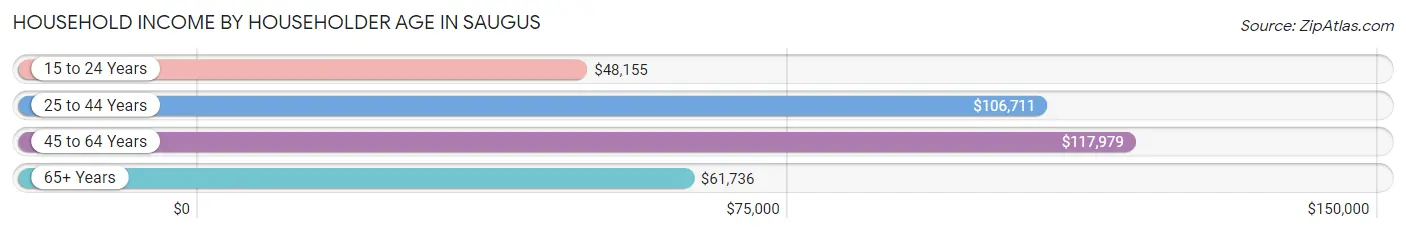
Household Income by Householder Age in Saugus
The median household income in Saugus is $96,064, with the highest median household income of $117,979 found in the 45 to 64 years age bracket for the primary householder. A total of 3,999 households (37.1%) fall into this category. Meanwhile, the 15 to 24 years age bracket for the primary householder has the lowest median household income of $48,155, with 185 households (1.7%) in this group.
| Income Bracket | # Households | Median Income |
| 15 to 24 Years | 185 (1.7%) | $48,155 |
| 25 to 44 Years | 3,034 (28.2%) | $106,711 |
| 45 to 64 Years | 3,999 (37.1%) | $117,979 |
| 65+ Years | 3,550 (33.0%) | $61,736 |
| Total | 10,768 (100.0%) | $96,064 |
Poverty in Saugus
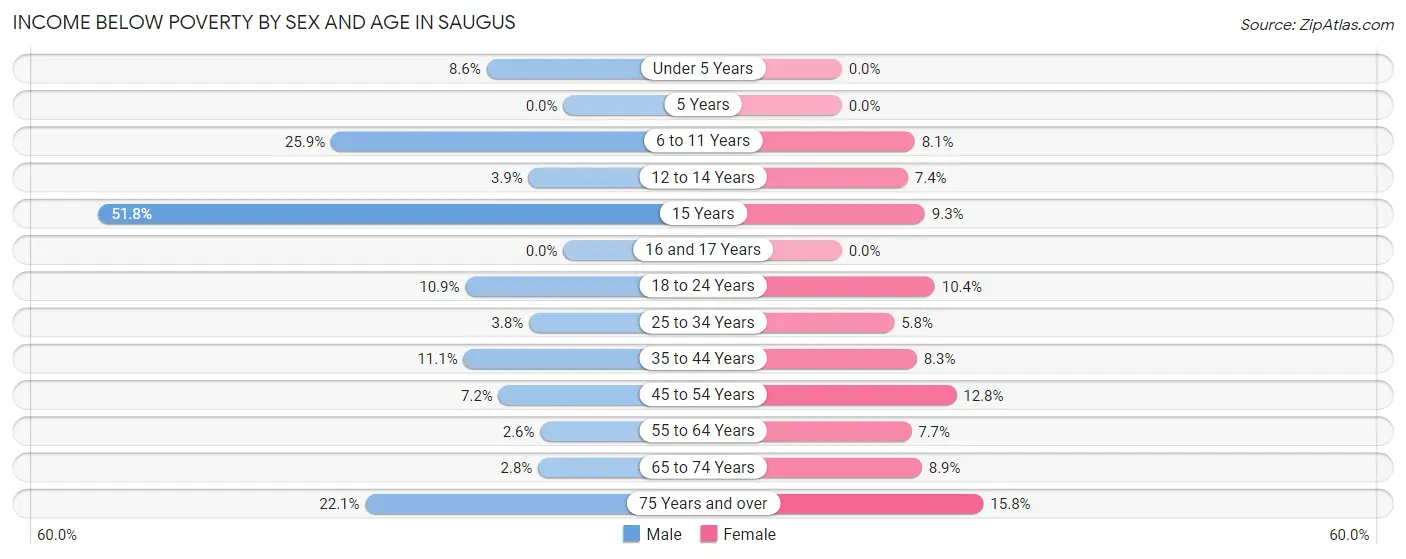
Income Below Poverty by Sex and Age in Saugus
With 8.3% poverty level for males and 9.2% for females among the residents of Saugus, 15 year old males and 75 year old and over females are the most vulnerable to poverty, with 44 males (51.8%) and 277 females (15.8%) in their respective age groups living below the poverty level.
| Age Bracket | Male | Female |
| Under 5 Years | 63 (8.6%) | 0 (0.0%) |
| 5 Years | 0 (0.0%) | 0 (0.0%) |
| 6 to 11 Years | 148 (25.9%) | 55 (8.1%) |
| 12 to 14 Years | 25 (3.9%) | 29 (7.4%) |
| 15 Years | 44 (51.8%) | 16 (9.2%) |
| 16 and 17 Years | 0 (0.0%) | 0 (0.0%) |
| 18 to 24 Years | 121 (10.9%) | 116 (10.4%) |
| 25 to 34 Years | 65 (3.8%) | 121 (5.8%) |
| 35 to 44 Years | 233 (11.1%) | 129 (8.3%) |
| 45 to 54 Years | 146 (7.2%) | 252 (12.8%) |
| 55 to 64 Years | 47 (2.6%) | 170 (7.7%) |
| 65 to 74 Years | 44 (2.8%) | 145 (8.9%) |
| 75 Years and over | 226 (22.1%) | 277 (15.8%) |
| Total | 1,162 (8.3%) | 1,310 (9.2%) |
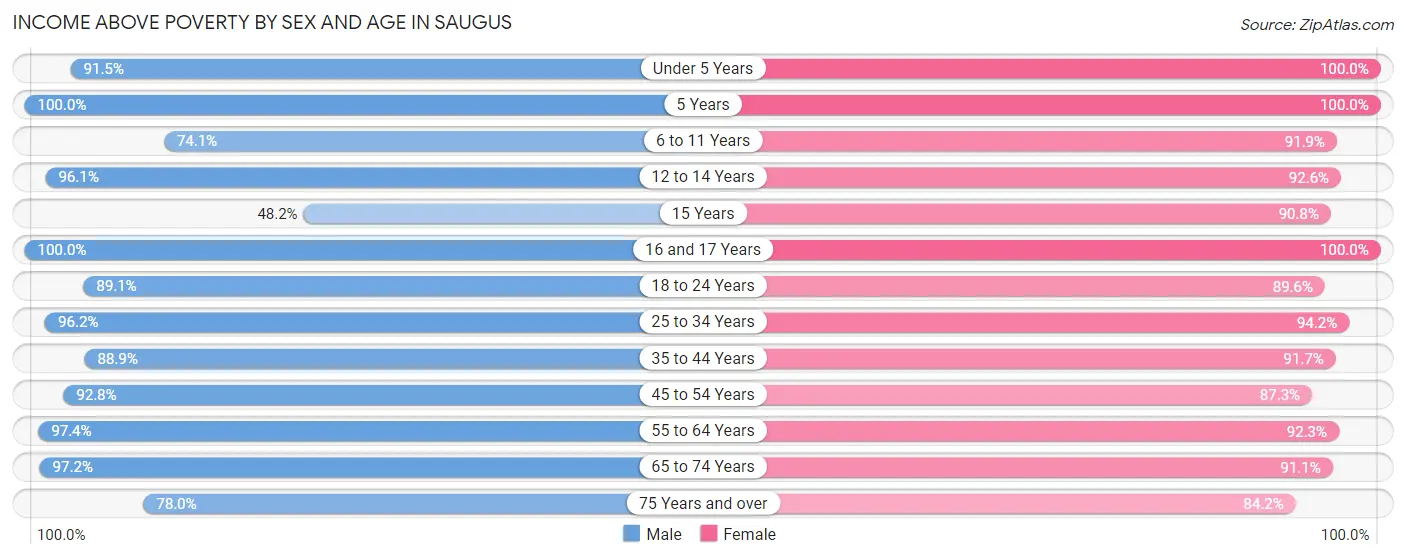
Income Above Poverty by Sex and Age in Saugus
According to the poverty statistics in Saugus, males aged 5 years and females aged under 5 years are the age groups that are most secure financially, with 100.0% of males and 100.0% of females in these age groups living above the poverty line.
| Age Bracket | Male | Female |
| Under 5 Years | 674 (91.4%) | 264 (100.0%) |
| 5 Years | 188 (100.0%) | 104 (100.0%) |
| 6 to 11 Years | 424 (74.1%) | 622 (91.9%) |
| 12 to 14 Years | 620 (96.1%) | 365 (92.6%) |
| 15 Years | 41 (48.2%) | 157 (90.7%) |
| 16 and 17 Years | 377 (100.0%) | 330 (100.0%) |
| 18 to 24 Years | 987 (89.1%) | 1,004 (89.6%) |
| 25 to 34 Years | 1,635 (96.2%) | 1,950 (94.2%) |
| 35 to 44 Years | 1,862 (88.9%) | 1,417 (91.7%) |
| 45 to 54 Years | 1,881 (92.8%) | 1,725 (87.3%) |
| 55 to 64 Years | 1,788 (97.4%) | 2,026 (92.3%) |
| 65 to 74 Years | 1,527 (97.2%) | 1,482 (91.1%) |
| 75 Years and over | 799 (77.9%) | 1,479 (84.2%) |
| Total | 12,803 (91.7%) | 12,925 (90.8%) |
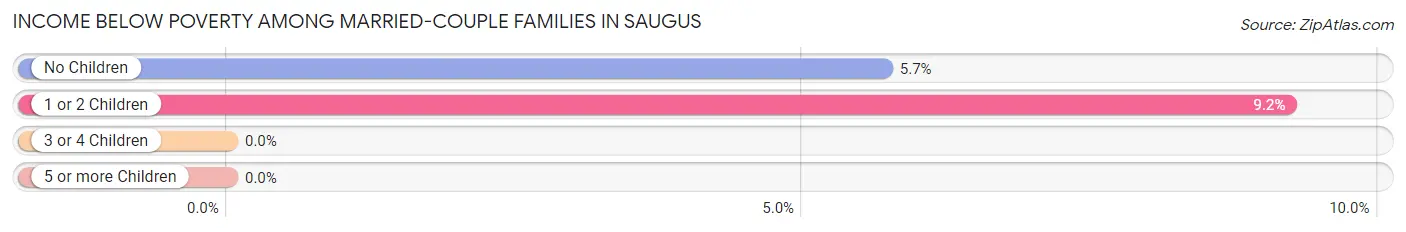
Income Below Poverty Among Married-Couple Families in Saugus
The poverty statistics for married-couple families in Saugus show that 6.3% or 375 of the total 5,911 families live below the poverty line. Families with 1 or 2 children have the highest poverty rate of 9.2%, comprising of 155 families. On the other hand, families with 3 or 4 children have the lowest poverty rate of 0.0%, which includes 0 families.
| Children | Above Poverty | Below Poverty |
| No Children | 3,639 (94.3%) | 220 (5.7%) |
| 1 or 2 Children | 1,527 (90.8%) | 155 (9.2%) |
| 3 or 4 Children | 370 (100.0%) | 0 (0.0%) |
| 5 or more Children | 0 (0.0%) | 0 (0.0%) |
| Total | 5,536 (93.7%) | 375 (6.3%) |
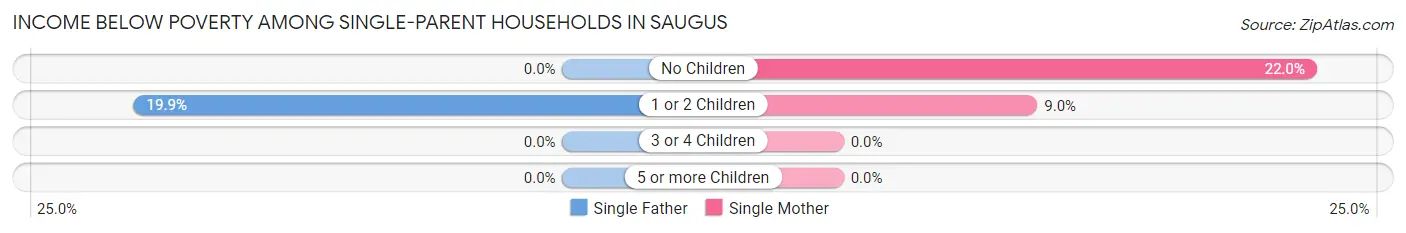
Income Below Poverty Among Single-Parent Households in Saugus
According to the poverty data in Saugus, 8.3% or 50 single-father households and 16.5% or 166 single-mother households are living below the poverty line. Among single-father households, those with 1 or 2 children have the highest poverty rate, with 50 households (19.9%) experiencing poverty. Likewise, among single-mother households, those with no children have the highest poverty rate, with 130 households (22.0%) falling below the poverty line.
| Children | Single Father | Single Mother |
| No Children | 0 (0.0%) | 130 (22.0%) |
| 1 or 2 Children | 50 (19.9%) | 36 (9.0%) |
| 3 or 4 Children | 0 (0.0%) | 0 (0.0%) |
| 5 or more Children | 0 (0.0%) | 0 (0.0%) |
| Total | 50 (8.3%) | 166 (16.5%) |
Income Below Poverty Among Married-Couple vs Single-Parent Households in Saugus
The poverty data for Saugus shows that 375 of the married-couple family households (6.3%) and 216 of the single-parent households (13.4%) are living below the poverty level. Within the married-couple family households, those with 1 or 2 children have the highest poverty rate, with 155 households (9.2%) falling below the poverty line. Among the single-parent households, those with no children have the highest poverty rate, with 130 household (13.8%) living below poverty.
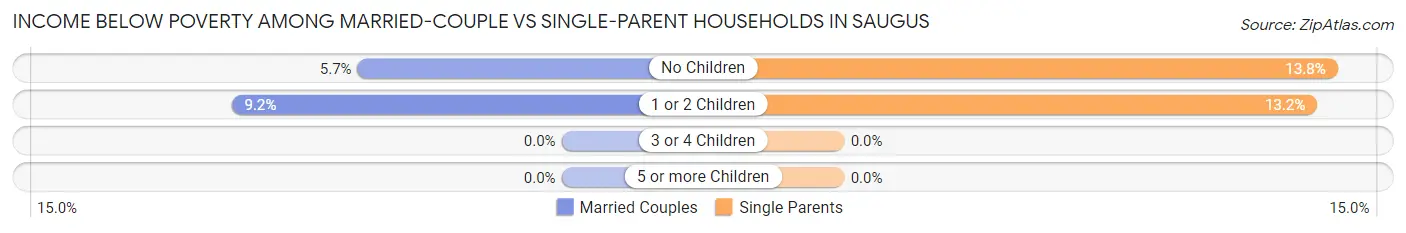
| Children | Married-Couple Families | Single-Parent Households |
| No Children | 220 (5.7%) | 130 (13.8%) |
| 1 or 2 Children | 155 (9.2%) | 86 (13.2%) |
| 3 or 4 Children | 0 (0.0%) | 0 (0.0%) |
| 5 or more Children | 0 (0.0%) | 0 (0.0%) |
| Total | 375 (6.3%) | 216 (13.4%) |
Employment Characteristics in Saugus
Employment by Class of Employer in Saugus
Among the 14,682 employed individuals in Saugus, private company employees (9,941 | 67.7%), not-for-profit organizations (1,428 | 9.7%), and local government employees (940 | 6.4%) make up the most common classes of employment.
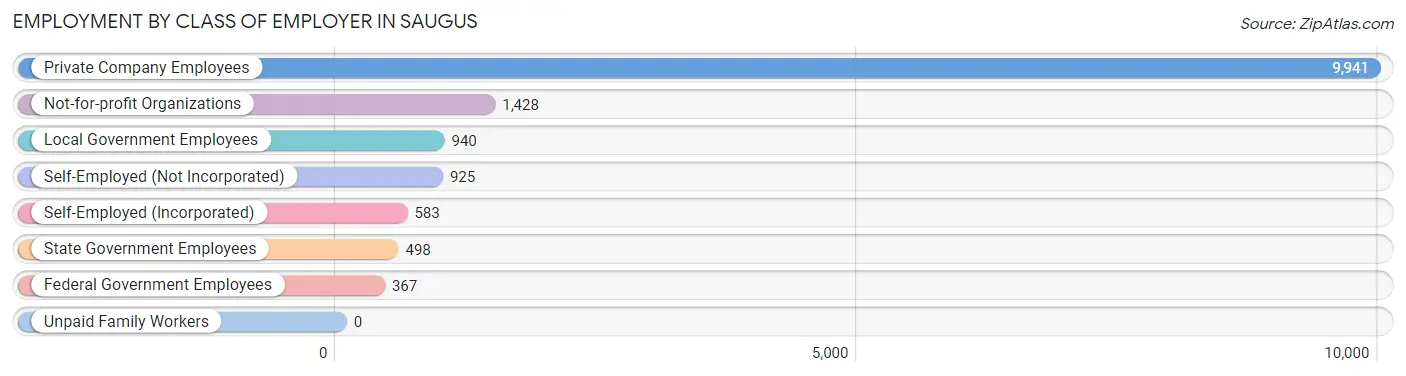
| Employer Class | # Employees | % Employees |
| Private Company Employees | 9,941 | 67.7% |
| Self-Employed (Incorporated) | 583 | 4.0% |
| Self-Employed (Not Incorporated) | 925 | 6.3% |
| Not-for-profit Organizations | 1,428 | 9.7% |
| Local Government Employees | 940 | 6.4% |
| State Government Employees | 498 | 3.4% |
| Federal Government Employees | 367 | 2.5% |
| Unpaid Family Workers | 0 | 0.0% |
| Total | 14,682 | 100.0% |
Employment Status by Age in Saugus
According to the labor force statistics for Saugus, out of the total population over 16 years of age (24,505), 64.8% or 15,879 individuals are in the labor force, with 3.4% or 540 of them unemployed. The age group with the highest labor force participation rate is 45 to 54 years, with 88.4% or 3,544 individuals in the labor force. Within the labor force, the 16 to 19 years age range has the highest percentage of unemployed individuals, with 8.0% or 48 of them being unemployed.
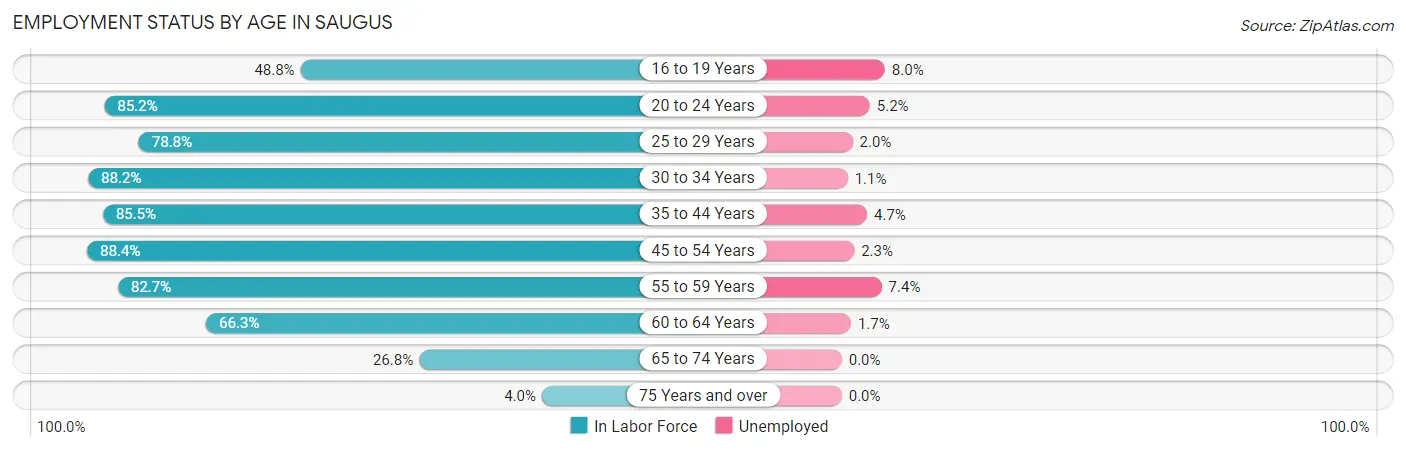
| Age Bracket | In Labor Force | Unemployed |
| 16 to 19 Years | 598 (48.8%) | 48 (8.0%) |
| 20 to 24 Years | 1,456 (85.2%) | 76 (5.2%) |
| 25 to 29 Years | 1,273 (78.8%) | 25 (2.0%) |
| 30 to 34 Years | 1,902 (88.2%) | 21 (1.1%) |
| 35 to 44 Years | 3,120 (85.5%) | 147 (4.7%) |
| 45 to 54 Years | 3,544 (88.4%) | 82 (2.3%) |
| 55 to 59 Years | 1,612 (82.7%) | 119 (7.4%) |
| 60 to 64 Years | 1,386 (66.3%) | 24 (1.7%) |
| 65 to 74 Years | 865 (26.8%) | 0 (0.0%) |
| 75 Years and over | 115 (4.0%) | 0 (0.0%) |
| Total | 15,879 (64.8%) | 540 (3.4%) |
Employment Status by Educational Attainment in Saugus
According to labor force statistics for Saugus, 83.0% of individuals (12,839) out of the total population between 25 and 64 years of age (15,469) are in the labor force, with 3.2% or 411 of them being unemployed. The group with the highest labor force participation rate are those with the educational attainment of bachelor's degree or higher, with 90.5% or 4,874 individuals in the labor force. Within the labor force, individuals with high school diploma education have the highest percentage of unemployment, with 4.0% or 155 of them being unemployed.
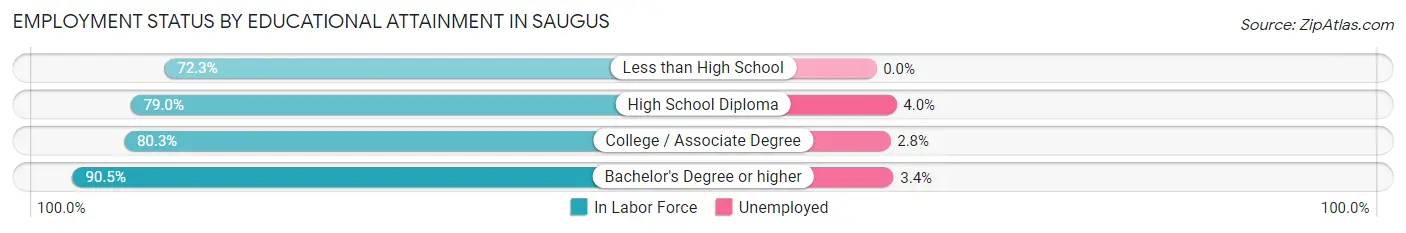
| Educational Attainment | In Labor Force | Unemployed |
| Less than High School | 661 (72.3%) | 0 (0.0%) |
| High School Diploma | 3,866 (79.0%) | 196 (4.0%) |
| College / Associate Degree | 3,433 (80.3%) | 120 (2.8%) |
| Bachelor's Degree or higher | 4,874 (90.5%) | 183 (3.4%) |
| Total | 12,839 (83.0%) | 495 (3.2%) |
Employment Occupations by Sex in Saugus
Management, Business, Science and Arts Occupations
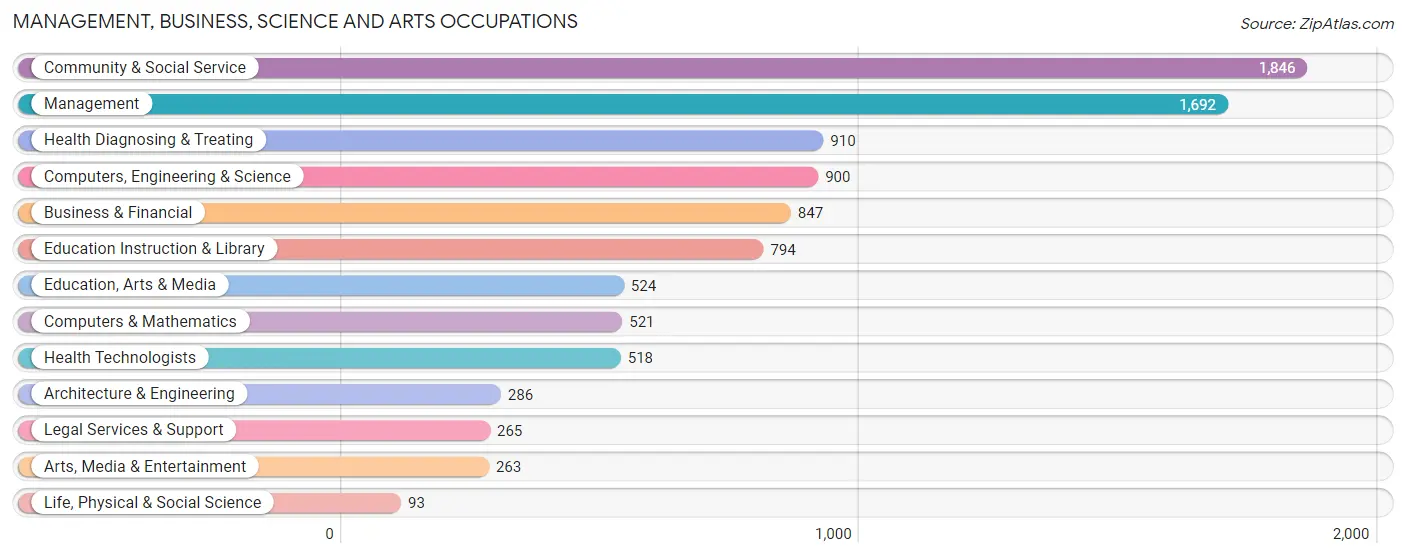
The most common Management, Business, Science and Arts occupations in Saugus are Community & Social Service (1,846 | 12.0%), Management (1,692 | 11.1%), Health Diagnosing & Treating (910 | 5.9%), Computers, Engineering & Science (900 | 5.9%), and Business & Financial (847 | 5.5%).
Management, Business, Science and Arts Occupations by Sex
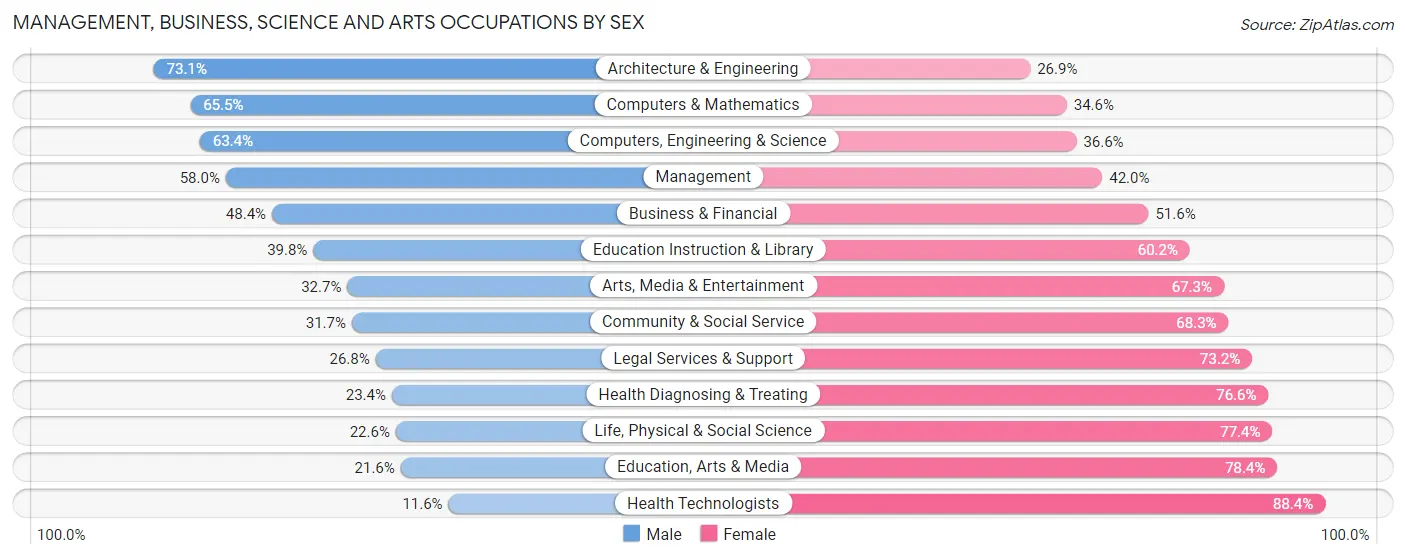
Within the Management, Business, Science and Arts occupations in Saugus, the most male-oriented occupations are Architecture & Engineering (73.1%), Computers & Mathematics (65.4%), and Computers, Engineering & Science (63.4%), while the most female-oriented occupations are Health Technologists (88.4%), Education, Arts & Media (78.4%), and Life, Physical & Social Science (77.4%).
| Occupation | Male | Female |
| Management | 982 (58.0%) | 710 (42.0%) |
| Business & Financial | 410 (48.4%) | 437 (51.6%) |
| Computers, Engineering & Science | 571 (63.4%) | 329 (36.6%) |
| Computers & Mathematics | 341 (65.4%) | 180 (34.5%) |
| Architecture & Engineering | 209 (73.1%) | 77 (26.9%) |
| Life, Physical & Social Science | 21 (22.6%) | 72 (77.4%) |
| Community & Social Service | 586 (31.7%) | 1,260 (68.3%) |
| Education, Arts & Media | 113 (21.6%) | 411 (78.4%) |
| Legal Services & Support | 71 (26.8%) | 194 (73.2%) |
| Education Instruction & Library | 316 (39.8%) | 478 (60.2%) |
| Arts, Media & Entertainment | 86 (32.7%) | 177 (67.3%) |
| Health Diagnosing & Treating | 213 (23.4%) | 697 (76.6%) |
| Health Technologists | 60 (11.6%) | 458 (88.4%) |
| Total (Category) | 2,762 (44.6%) | 3,433 (55.4%) |
| Total (Overall) | 7,800 (50.9%) | 7,514 (49.1%) |
Services Occupations
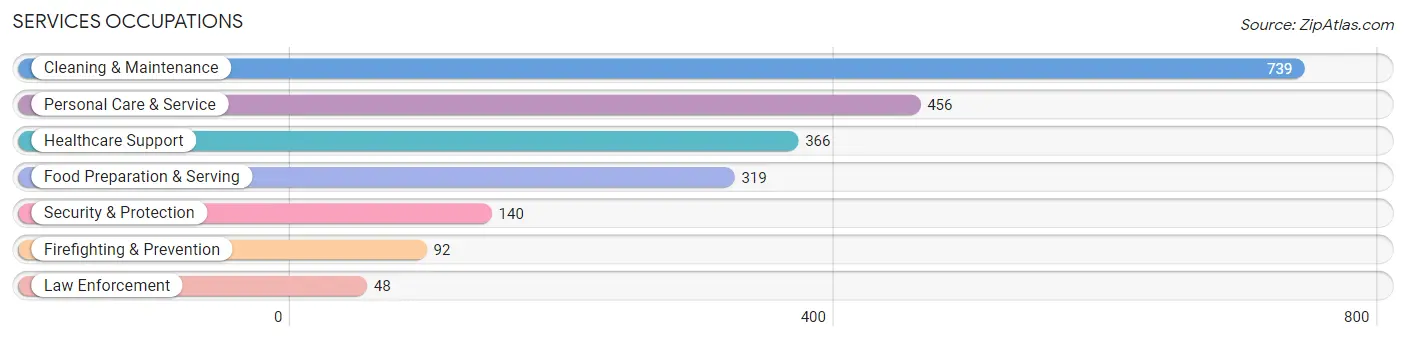
The most common Services occupations in Saugus are Cleaning & Maintenance (739 | 4.8%), Personal Care & Service (456 | 3.0%), Healthcare Support (366 | 2.4%), Food Preparation & Serving (319 | 2.1%), and Security & Protection (140 | 0.9%).
Services Occupations by Sex
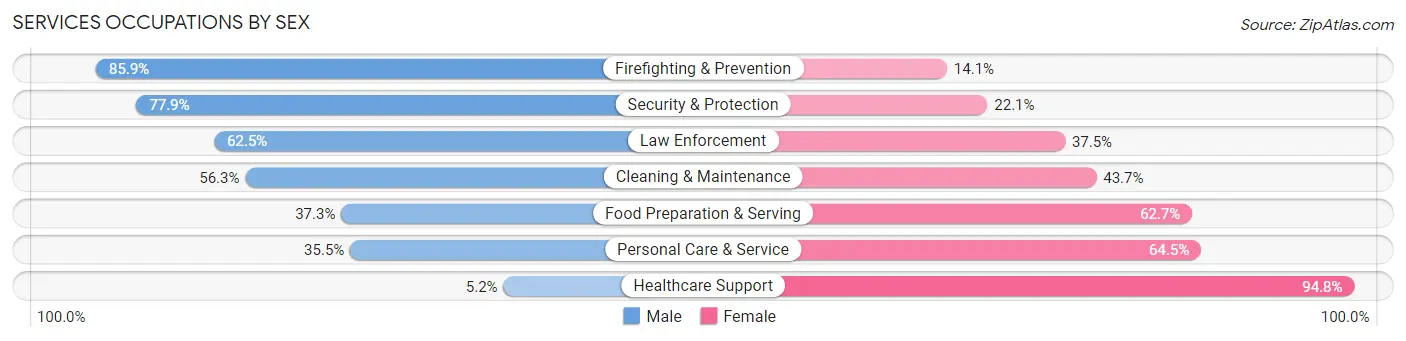
Within the Services occupations in Saugus, the most male-oriented occupations are Firefighting & Prevention (85.9%), Security & Protection (77.9%), and Law Enforcement (62.5%), while the most female-oriented occupations are Healthcare Support (94.8%), Personal Care & Service (64.5%), and Food Preparation & Serving (62.7%).
| Occupation | Male | Female |
| Healthcare Support | 19 (5.2%) | 347 (94.8%) |
| Security & Protection | 109 (77.9%) | 31 (22.1%) |
| Firefighting & Prevention | 79 (85.9%) | 13 (14.1%) |
| Law Enforcement | 30 (62.5%) | 18 (37.5%) |
| Food Preparation & Serving | 119 (37.3%) | 200 (62.7%) |
| Cleaning & Maintenance | 416 (56.3%) | 323 (43.7%) |
| Personal Care & Service | 162 (35.5%) | 294 (64.5%) |
| Total (Category) | 825 (40.8%) | 1,195 (59.2%) |
| Total (Overall) | 7,800 (50.9%) | 7,514 (49.1%) |
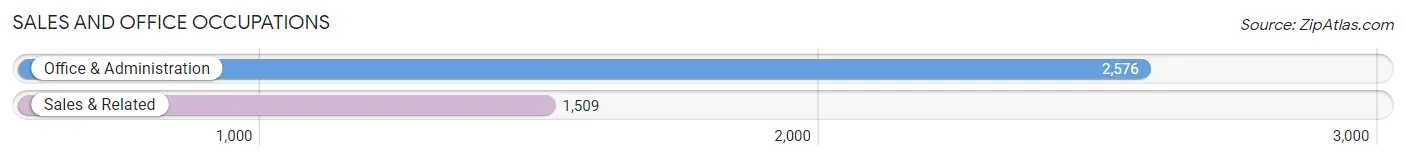
Sales and Office Occupations
The most common Sales and Office occupations in Saugus are Office & Administration (2,576 | 16.8%), and Sales & Related (1,509 | 9.9%).
Sales and Office Occupations by Sex
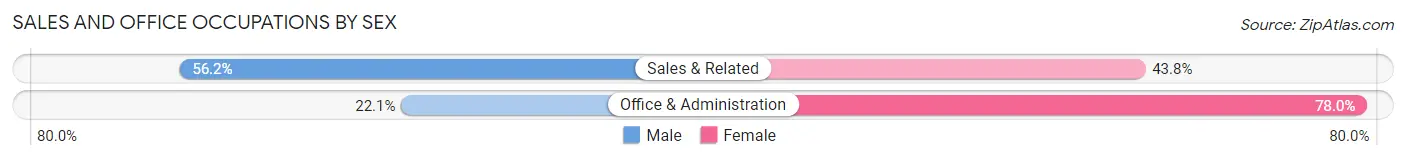
| Occupation | Male | Female |
| Sales & Related | 848 (56.2%) | 661 (43.8%) |
| Office & Administration | 568 (22.1%) | 2,008 (77.9%) |
| Total (Category) | 1,416 (34.7%) | 2,669 (65.3%) |
| Total (Overall) | 7,800 (50.9%) | 7,514 (49.1%) |
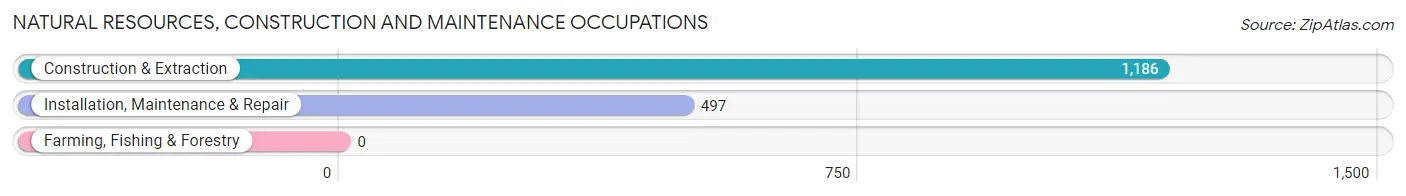
Natural Resources, Construction and Maintenance Occupations
The most common Natural Resources, Construction and Maintenance occupations in Saugus are Construction & Extraction (1,186 | 7.7%), and Installation, Maintenance & Repair (497 | 3.3%).
Natural Resources, Construction and Maintenance Occupations by Sex
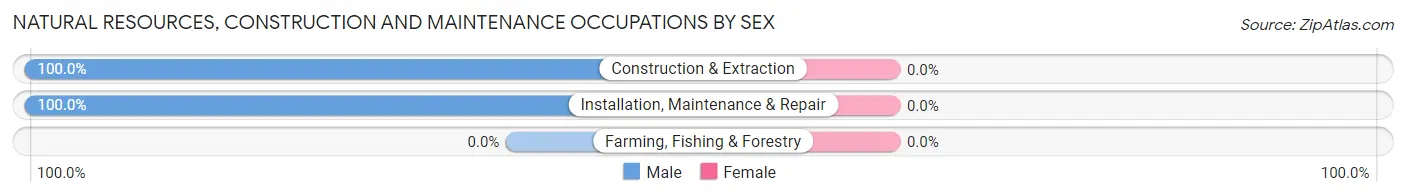
| Occupation | Male | Female |
| Farming, Fishing & Forestry | 0 (0.0%) | 0 (0.0%) |
| Construction & Extraction | 1,186 (100.0%) | 0 (0.0%) |
| Installation, Maintenance & Repair | 497 (100.0%) | 0 (0.0%) |
| Total (Category) | 1,683 (100.0%) | 0 (0.0%) |
| Total (Overall) | 7,800 (50.9%) | 7,514 (49.1%) |
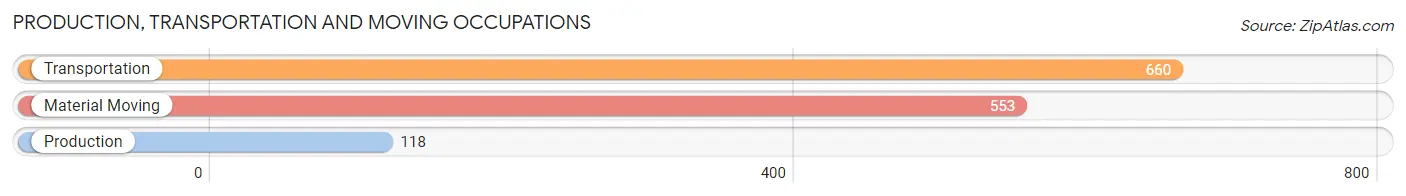
Production, Transportation and Moving Occupations
The most common Production, Transportation and Moving occupations in Saugus are Transportation (660 | 4.3%), Material Moving (553 | 3.6%), and Production (118 | 0.8%).
Production, Transportation and Moving Occupations by Sex
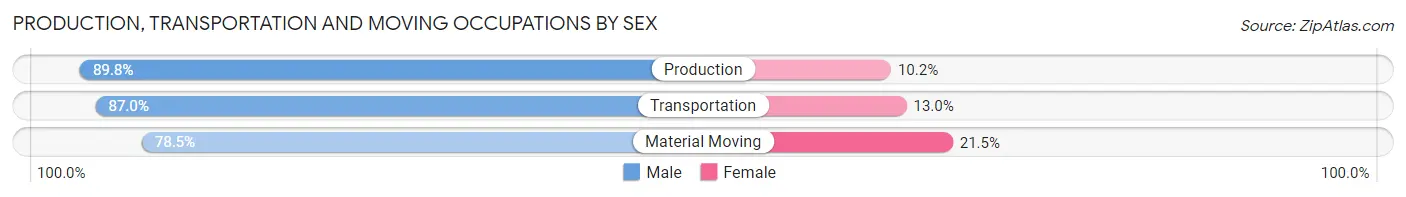
| Occupation | Male | Female |
| Production | 106 (89.8%) | 12 (10.2%) |
| Transportation | 574 (87.0%) | 86 (13.0%) |
| Material Moving | 434 (78.5%) | 119 (21.5%) |
| Total (Category) | 1,114 (83.7%) | 217 (16.3%) |
| Total (Overall) | 7,800 (50.9%) | 7,514 (49.1%) |
Employment Industries by Sex in Saugus
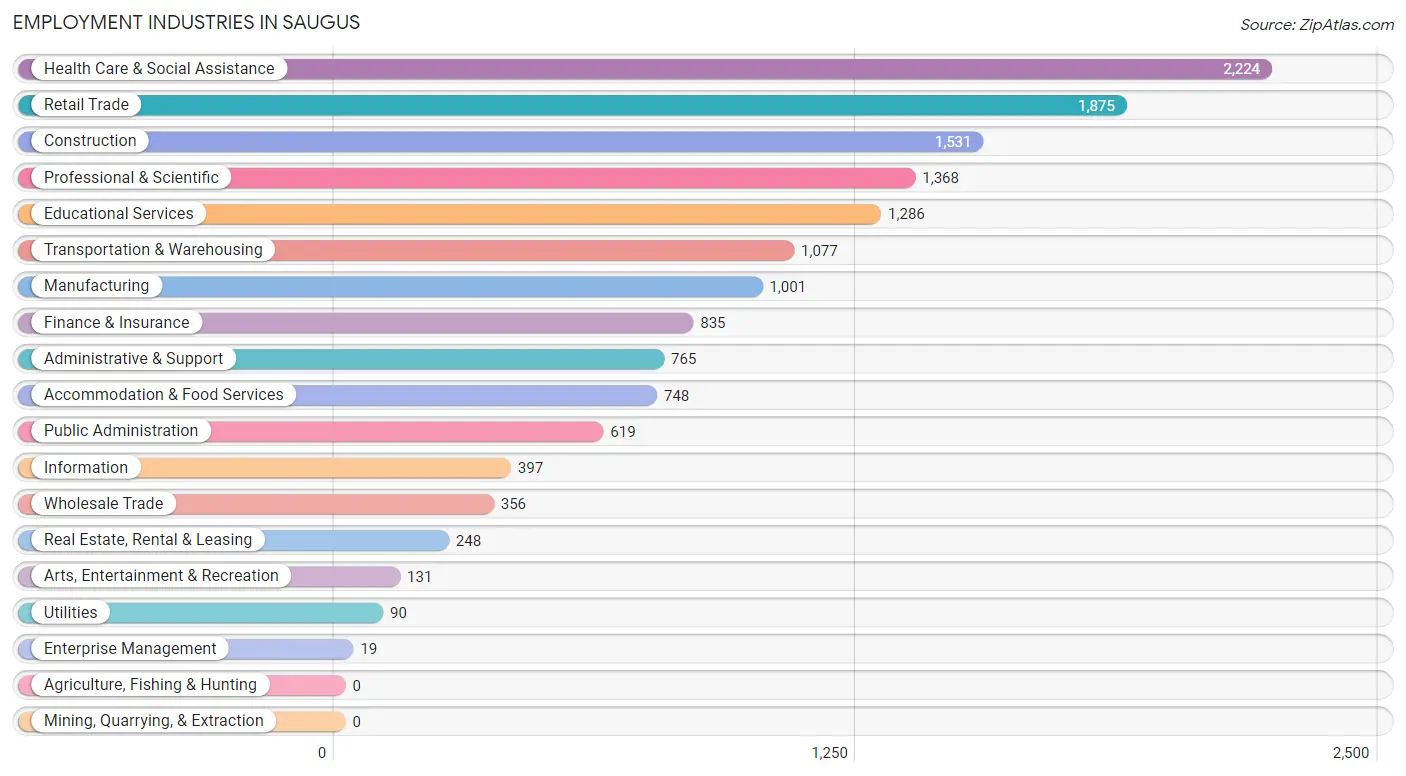
Employment Industries in Saugus
The major employment industries in Saugus include Health Care & Social Assistance (2,224 | 14.5%), Retail Trade (1,875 | 12.2%), Construction (1,531 | 10.0%), Professional & Scientific (1,368 | 8.9%), and Educational Services (1,286 | 8.4%).
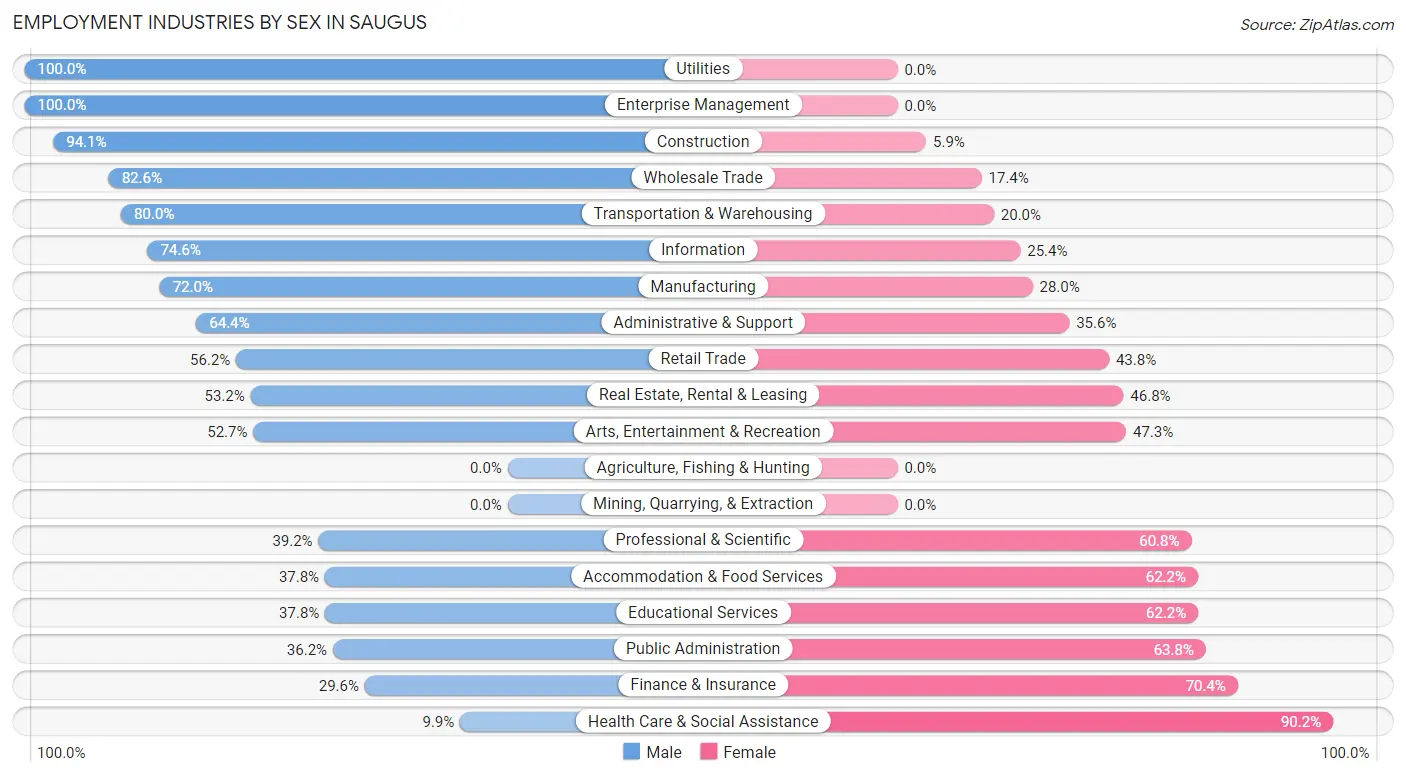
Employment Industries by Sex in Saugus
The Saugus industries that see more men than women are Utilities (100.0%), Enterprise Management (100.0%), and Construction (94.1%), whereas the industries that tend to have a higher number of women are Health Care & Social Assistance (90.1%), Finance & Insurance (70.4%), and Public Administration (63.8%).
| Industry | Male | Female |
| Agriculture, Fishing & Hunting | 0 (0.0%) | 0 (0.0%) |
| Mining, Quarrying, & Extraction | 0 (0.0%) | 0 (0.0%) |
| Construction | 1,440 (94.1%) | 91 (5.9%) |
| Manufacturing | 721 (72.0%) | 280 (28.0%) |
| Wholesale Trade | 294 (82.6%) | 62 (17.4%) |
| Retail Trade | 1,054 (56.2%) | 821 (43.8%) |
| Transportation & Warehousing | 862 (80.0%) | 215 (20.0%) |
| Utilities | 90 (100.0%) | 0 (0.0%) |
| Information | 296 (74.6%) | 101 (25.4%) |
| Finance & Insurance | 247 (29.6%) | 588 (70.4%) |
| Real Estate, Rental & Leasing | 132 (53.2%) | 116 (46.8%) |
| Professional & Scientific | 536 (39.2%) | 832 (60.8%) |
| Enterprise Management | 19 (100.0%) | 0 (0.0%) |
| Administrative & Support | 493 (64.4%) | 272 (35.6%) |
| Educational Services | 486 (37.8%) | 800 (62.2%) |
| Health Care & Social Assistance | 219 (9.9%) | 2,005 (90.1%) |
| Arts, Entertainment & Recreation | 69 (52.7%) | 62 (47.3%) |
| Accommodation & Food Services | 283 (37.8%) | 465 (62.2%) |
| Public Administration | 224 (36.2%) | 395 (63.8%) |
| Total | 7,800 (50.9%) | 7,514 (49.1%) |
Education in Saugus
School Enrollment in Saugus
The most common levels of schooling among the 5,260 students in Saugus are high school (1,417 | 26.9%), elementary school (993 | 18.9%), and college / undergraduate (950 | 18.1%).
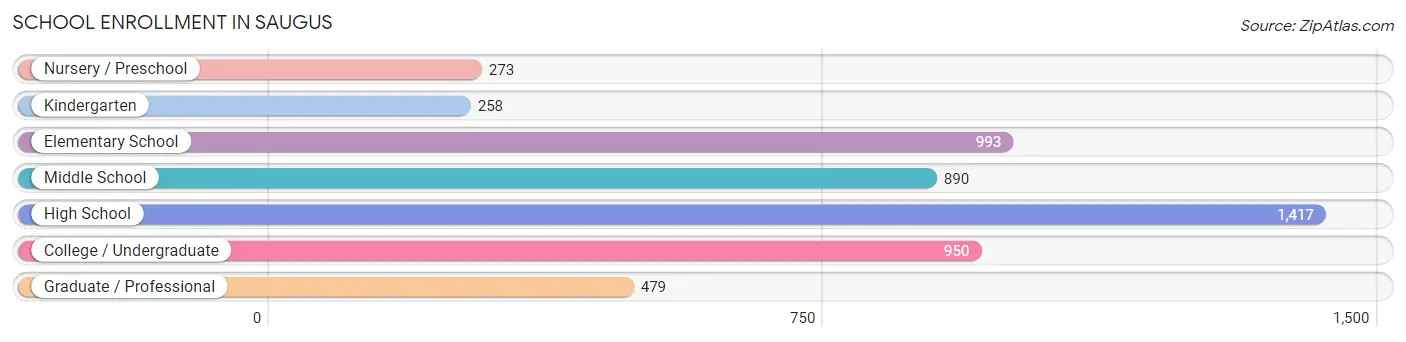
| School Level | # Students | % Students |
| Nursery / Preschool | 273 | 5.2% |
| Kindergarten | 258 | 4.9% |
| Elementary School | 993 | 18.9% |
| Middle School | 890 | 16.9% |
| High School | 1,417 | 26.9% |
| College / Undergraduate | 950 | 18.1% |
| Graduate / Professional | 479 | 9.1% |
| Total | 5,260 | 100.0% |
School Enrollment by Age by Funding Source in Saugus
Out of a total of 5,260 students who are enrolled in schools in Saugus, 1,178 (22.4%) attend a private institution, while the remaining 4,082 (77.6%) are enrolled in public schools. The age group of 25 to 34 year olds has the highest likelihood of being enrolled in private schools, with 202 (55.5% in the age bracket) enrolled. Conversely, the age group of 5 to 9 year old has the lowest likelihood of being enrolled in a private school, with 973 (87.6% in the age bracket) attending a public institution.
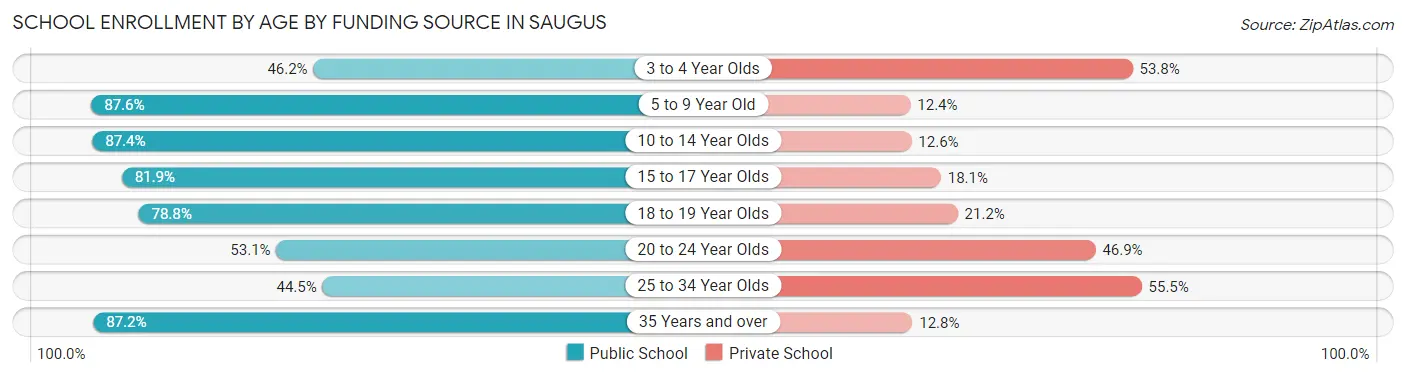
| Age Bracket | Public School | Private School |
| 3 to 4 Year Olds | 73 (46.2%) | 85 (53.8%) |
| 5 to 9 Year Old | 973 (87.6%) | 138 (12.4%) |
| 10 to 14 Year Olds | 1,233 (87.4%) | 178 (12.6%) |
| 15 to 17 Year Olds | 779 (81.9%) | 172 (18.1%) |
| 18 to 19 Year Olds | 230 (78.8%) | 62 (21.2%) |
| 20 to 24 Year Olds | 334 (53.1%) | 295 (46.9%) |
| 25 to 34 Year Olds | 162 (44.5%) | 202 (55.5%) |
| 35 Years and over | 300 (87.2%) | 44 (12.8%) |
| Total | 4,082 (77.6%) | 1,178 (22.4%) |
Educational Attainment by Field of Study in Saugus
Business (1,365 | 20.3%), social sciences (648 | 9.6%), education (619 | 9.2%), arts & humanities (574 | 8.5%), and psychology (568 | 8.4%) are the most common fields of study among 6,727 individuals in Saugus who have obtained a bachelor's degree or higher.
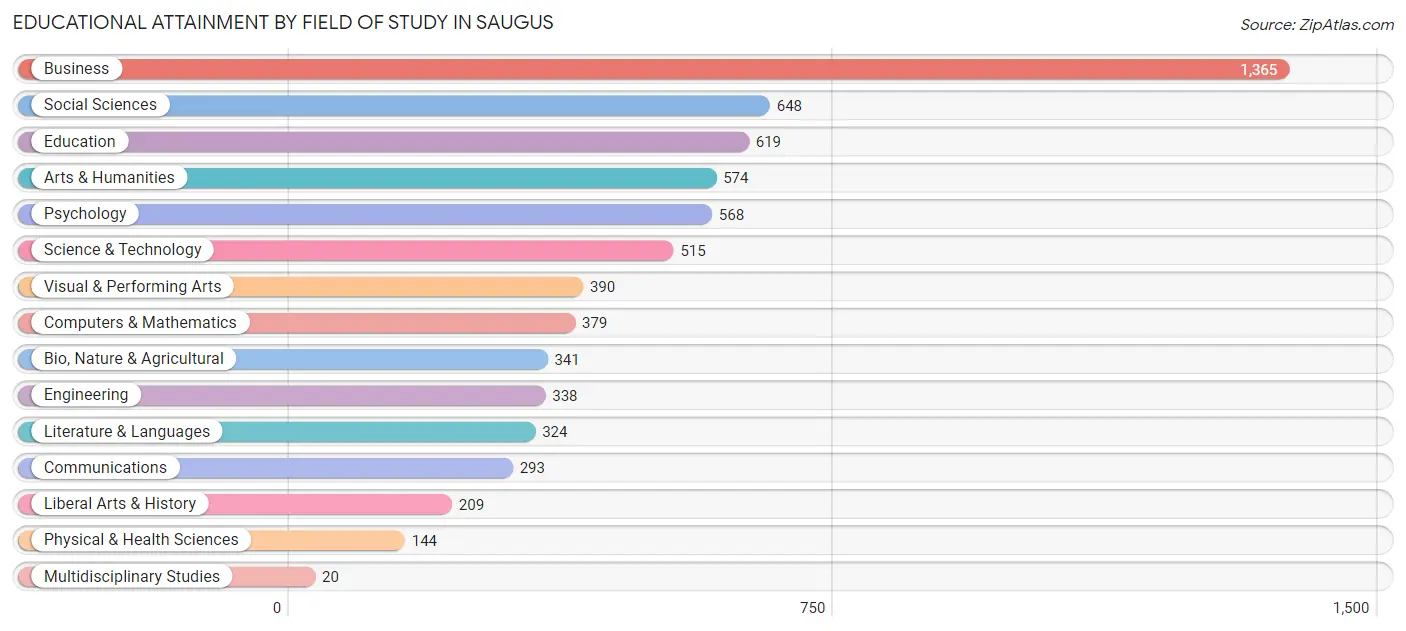
| Field of Study | # Graduates | % Graduates |
| Computers & Mathematics | 379 | 5.6% |
| Bio, Nature & Agricultural | 341 | 5.1% |
| Physical & Health Sciences | 144 | 2.1% |
| Psychology | 568 | 8.4% |
| Social Sciences | 648 | 9.6% |
| Engineering | 338 | 5.0% |
| Multidisciplinary Studies | 20 | 0.3% |
| Science & Technology | 515 | 7.7% |
| Business | 1,365 | 20.3% |
| Education | 619 | 9.2% |
| Literature & Languages | 324 | 4.8% |
| Liberal Arts & History | 209 | 3.1% |
| Visual & Performing Arts | 390 | 5.8% |
| Communications | 293 | 4.4% |
| Arts & Humanities | 574 | 8.5% |
| Total | 6,727 | 100.0% |
Transportation & Commute in Saugus
Vehicle Availability by Sex in Saugus
The most prevalent vehicle ownership categories in Saugus are males with 2 vehicles (2,718, accounting for 36.1%) and females with 2 vehicles (2,354, making up 38.1%).
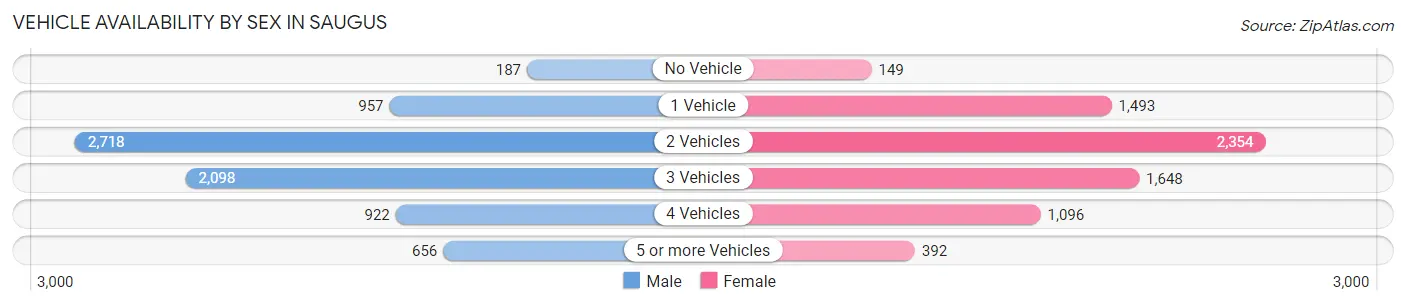
| Vehicles Available | Male | Female |
| No Vehicle | 187 (2.5%) | 149 (2.1%) |
| 1 Vehicle | 957 (12.7%) | 1,493 (20.9%) |
| 2 Vehicles | 2,718 (36.1%) | 2,354 (33.0%) |
| 3 Vehicles | 2,098 (27.8%) | 1,648 (23.1%) |
| 4 Vehicles | 922 (12.2%) | 1,096 (15.4%) |
| 5 or more Vehicles | 656 (8.7%) | 392 (5.5%) |
| Total | 7,538 (100.0%) | 7,132 (100.0%) |
Commute Time in Saugus
The most frequently occuring commute durations in Saugus are 30 to 34 minutes (2,499 commuters, 19.1%), 20 to 24 minutes (1,833 commuters, 14.0%), and 15 to 19 minutes (1,519 commuters, 11.6%).
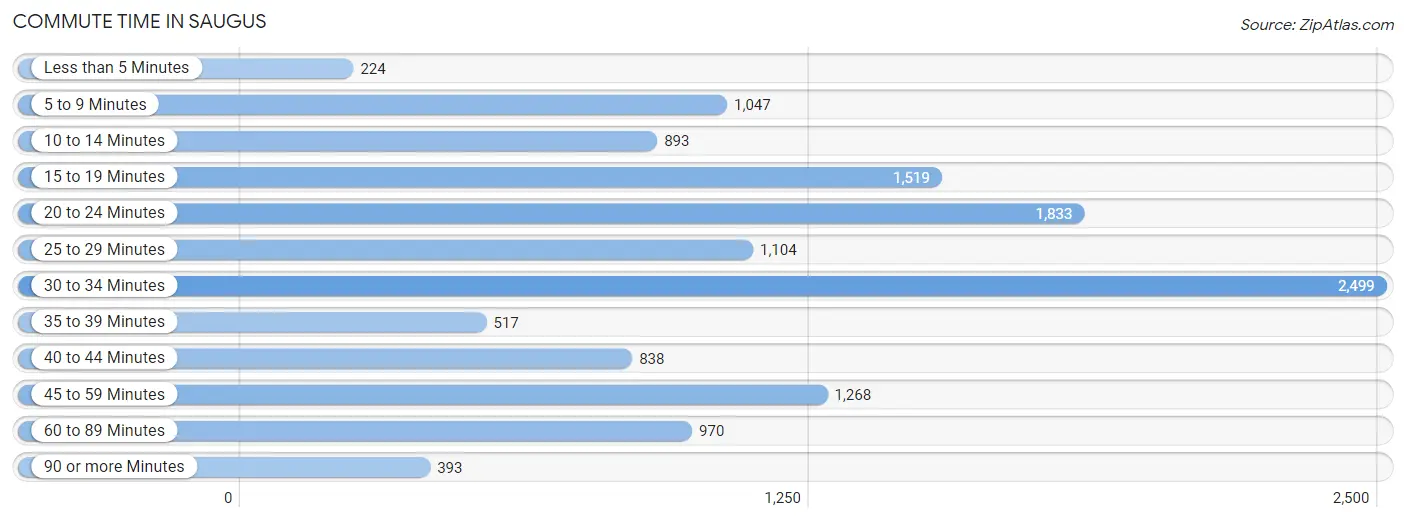
| Commute Time | # Commuters | % Commuters |
| Less than 5 Minutes | 224 | 1.7% |
| 5 to 9 Minutes | 1,047 | 8.0% |
| 10 to 14 Minutes | 893 | 6.8% |
| 15 to 19 Minutes | 1,519 | 11.6% |
| 20 to 24 Minutes | 1,833 | 14.0% |
| 25 to 29 Minutes | 1,104 | 8.4% |
| 30 to 34 Minutes | 2,499 | 19.1% |
| 35 to 39 Minutes | 517 | 4.0% |
| 40 to 44 Minutes | 838 | 6.4% |
| 45 to 59 Minutes | 1,268 | 9.7% |
| 60 to 89 Minutes | 970 | 7.4% |
| 90 or more Minutes | 393 | 3.0% |
Commute Time by Sex in Saugus
The most common commute times in Saugus are 30 to 34 minutes (1,383 commuters, 20.2%) for males and 30 to 34 minutes (1,116 commuters, 17.8%) for females.
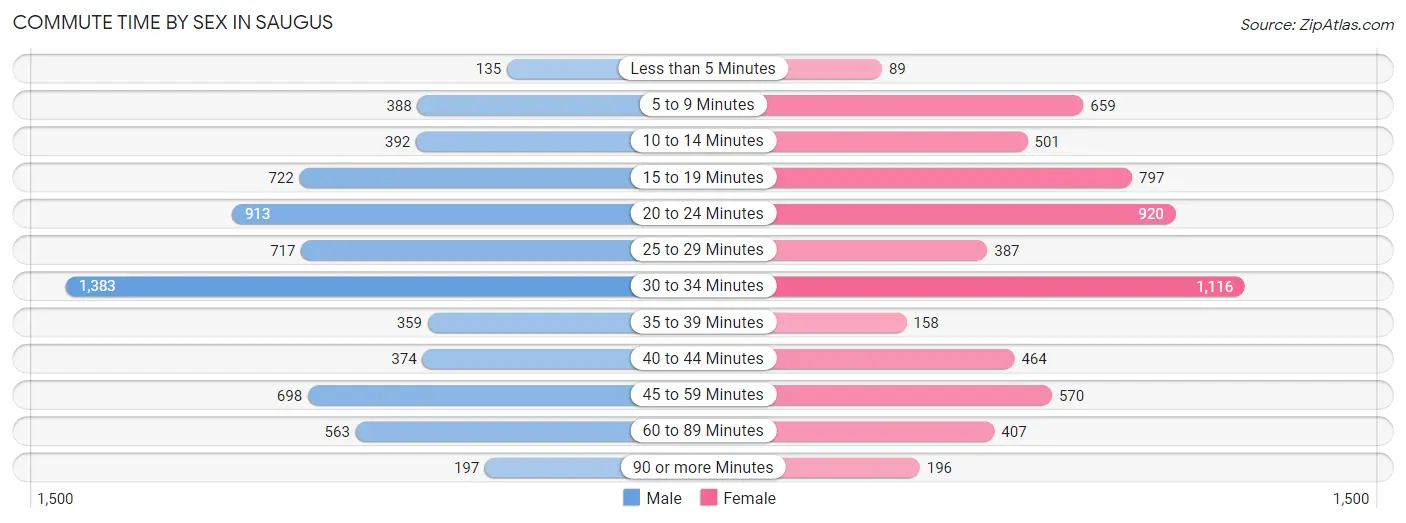
| Commute Time | Male | Female |
| Less than 5 Minutes | 135 (2.0%) | 89 (1.4%) |
| 5 to 9 Minutes | 388 (5.7%) | 659 (10.5%) |
| 10 to 14 Minutes | 392 (5.7%) | 501 (8.0%) |
| 15 to 19 Minutes | 722 (10.5%) | 797 (12.7%) |
| 20 to 24 Minutes | 913 (13.4%) | 920 (14.7%) |
| 25 to 29 Minutes | 717 (10.5%) | 387 (6.2%) |
| 30 to 34 Minutes | 1,383 (20.2%) | 1,116 (17.8%) |
| 35 to 39 Minutes | 359 (5.2%) | 158 (2.5%) |
| 40 to 44 Minutes | 374 (5.5%) | 464 (7.4%) |
| 45 to 59 Minutes | 698 (10.2%) | 570 (9.1%) |
| 60 to 89 Minutes | 563 (8.2%) | 407 (6.5%) |
| 90 or more Minutes | 197 (2.9%) | 196 (3.1%) |
Time of Departure to Work by Sex in Saugus
The most frequent times of departure to work in Saugus are 7:00 AM to 7:29 AM (912, 13.3%) for males and 7:00 AM to 7:29 AM (1,104, 17.6%) for females.
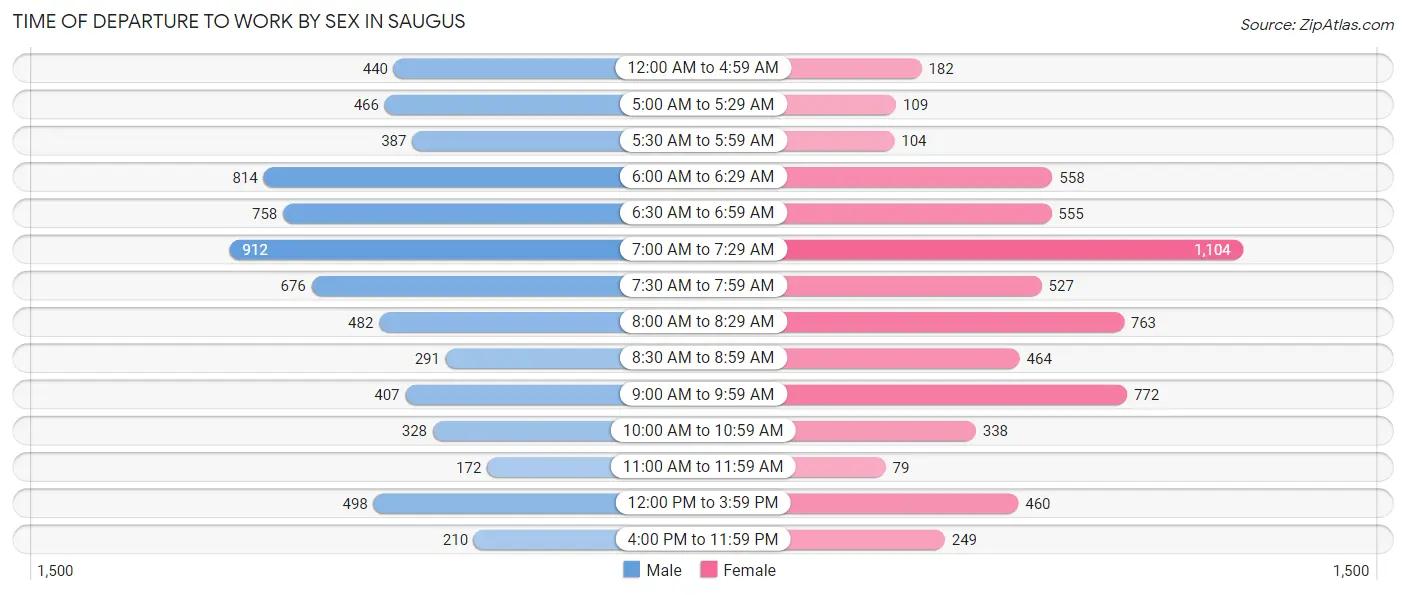
| Time of Departure | Male | Female |
| 12:00 AM to 4:59 AM | 440 (6.4%) | 182 (2.9%) |
| 5:00 AM to 5:29 AM | 466 (6.8%) | 109 (1.7%) |
| 5:30 AM to 5:59 AM | 387 (5.7%) | 104 (1.7%) |
| 6:00 AM to 6:29 AM | 814 (11.9%) | 558 (8.9%) |
| 6:30 AM to 6:59 AM | 758 (11.1%) | 555 (8.9%) |
| 7:00 AM to 7:29 AM | 912 (13.3%) | 1,104 (17.6%) |
| 7:30 AM to 7:59 AM | 676 (9.9%) | 527 (8.4%) |
| 8:00 AM to 8:29 AM | 482 (7.0%) | 763 (12.2%) |
| 8:30 AM to 8:59 AM | 291 (4.3%) | 464 (7.4%) |
| 9:00 AM to 9:59 AM | 407 (5.9%) | 772 (12.3%) |
| 10:00 AM to 10:59 AM | 328 (4.8%) | 338 (5.4%) |
| 11:00 AM to 11:59 AM | 172 (2.5%) | 79 (1.3%) |
| 12:00 PM to 3:59 PM | 498 (7.3%) | 460 (7.3%) |
| 4:00 PM to 11:59 PM | 210 (3.1%) | 249 (4.0%) |
| Total | 6,841 (100.0%) | 6,264 (100.0%) |
Housing Occupancy in Saugus
Occupancy by Ownership in Saugus
Of the total 10,768 dwellings in Saugus, owner-occupied units account for 8,009 (74.4%), while renter-occupied units make up 2,759 (25.6%).
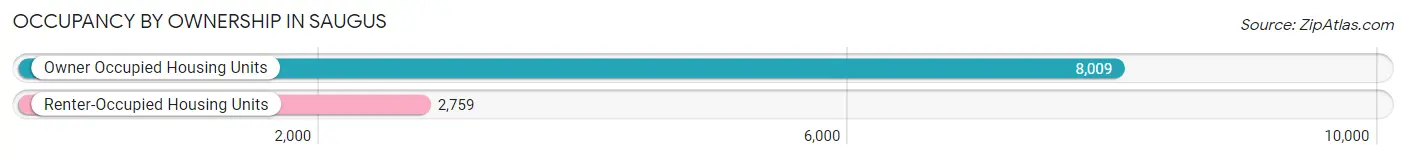
| Occupancy | # Housing Units | % Housing Units |
| Owner Occupied Housing Units | 8,009 | 74.4% |
| Renter-Occupied Housing Units | 2,759 | 25.6% |
| Total Occupied Housing Units | 10,768 | 100.0% |
Occupancy by Household Size in Saugus
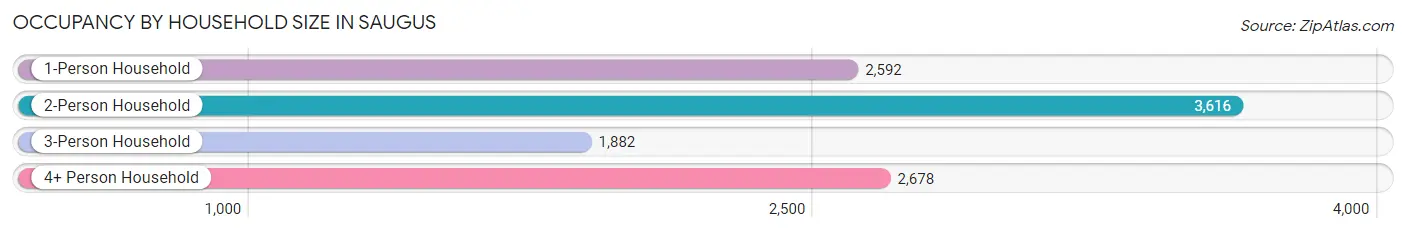
| Household Size | # Housing Units | % Housing Units |
| 1-Person Household | 2,592 | 24.1% |
| 2-Person Household | 3,616 | 33.6% |
| 3-Person Household | 1,882 | 17.5% |
| 4+ Person Household | 2,678 | 24.9% |
| Total Housing Units | 10,768 | 100.0% |
Occupancy by Ownership by Household Size in Saugus
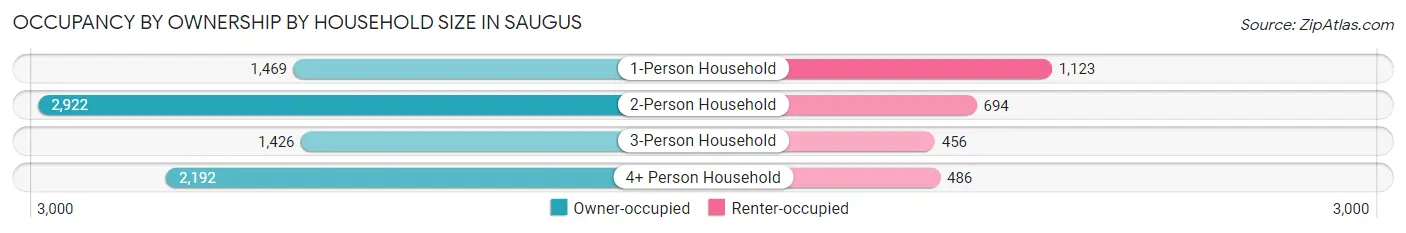
| Household Size | Owner-occupied | Renter-occupied |
| 1-Person Household | 1,469 (56.7%) | 1,123 (43.3%) |
| 2-Person Household | 2,922 (80.8%) | 694 (19.2%) |
| 3-Person Household | 1,426 (75.8%) | 456 (24.2%) |
| 4+ Person Household | 2,192 (81.9%) | 486 (18.1%) |
| Total Housing Units | 8,009 (74.4%) | 2,759 (25.6%) |
Occupancy by Educational Attainment in Saugus
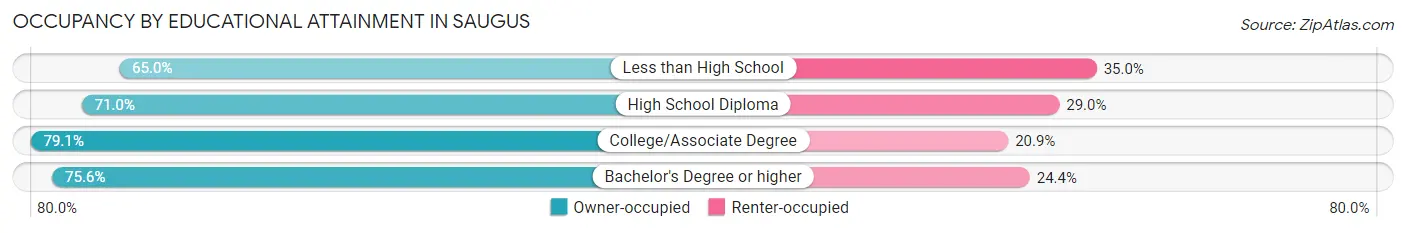
| Household Size | Owner-occupied | Renter-occupied |
| Less than High School | 591 (65.0%) | 318 (35.0%) |
| High School Diploma | 2,299 (71.0%) | 941 (29.0%) |
| College/Associate Degree | 2,605 (79.1%) | 690 (20.9%) |
| Bachelor's Degree or higher | 2,514 (75.6%) | 810 (24.4%) |
Occupancy by Age of Householder in Saugus
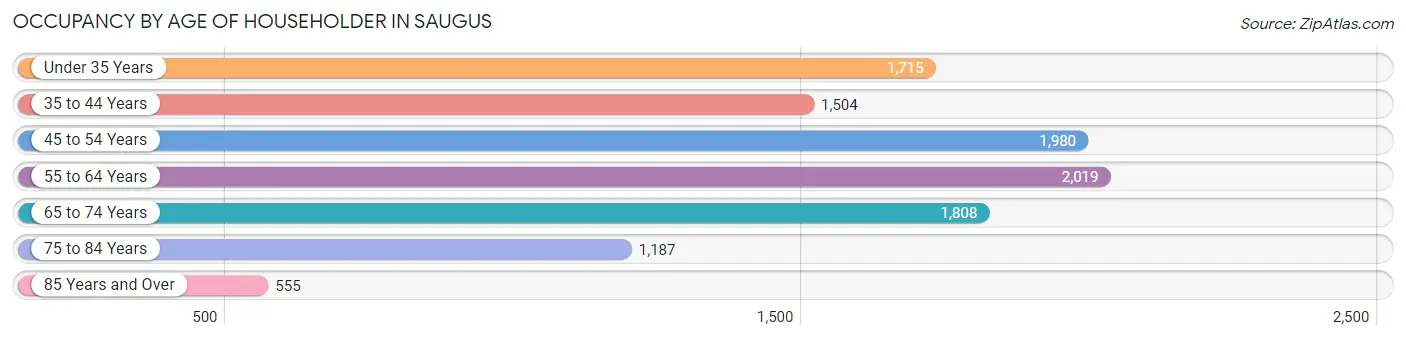
| Age Bracket | # Households | % Households |
| Under 35 Years | 1,715 | 15.9% |
| 35 to 44 Years | 1,504 | 14.0% |
| 45 to 54 Years | 1,980 | 18.4% |
| 55 to 64 Years | 2,019 | 18.8% |
| 65 to 74 Years | 1,808 | 16.8% |
| 75 to 84 Years | 1,187 | 11.0% |
| 85 Years and Over | 555 | 5.1% |
| Total | 10,768 | 100.0% |
Housing Finances in Saugus
Median Income by Occupancy in Saugus
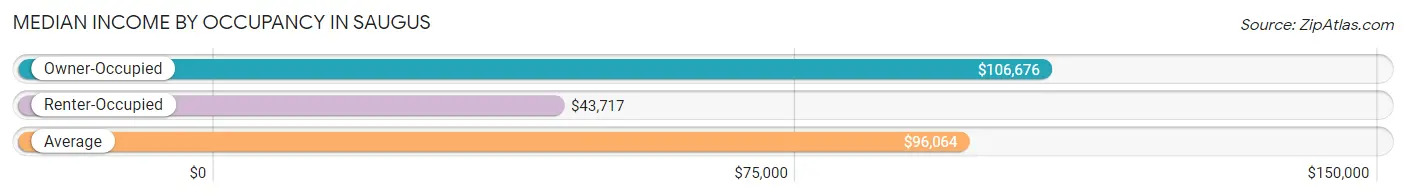
| Occupancy Type | # Households | Median Income |
| Owner-Occupied | 8,009 (74.4%) | $106,676 |
| Renter-Occupied | 2,759 (25.6%) | $43,717 |
| Average | 10,768 (100.0%) | $96,064 |
Occupancy by Householder Income Bracket in Saugus
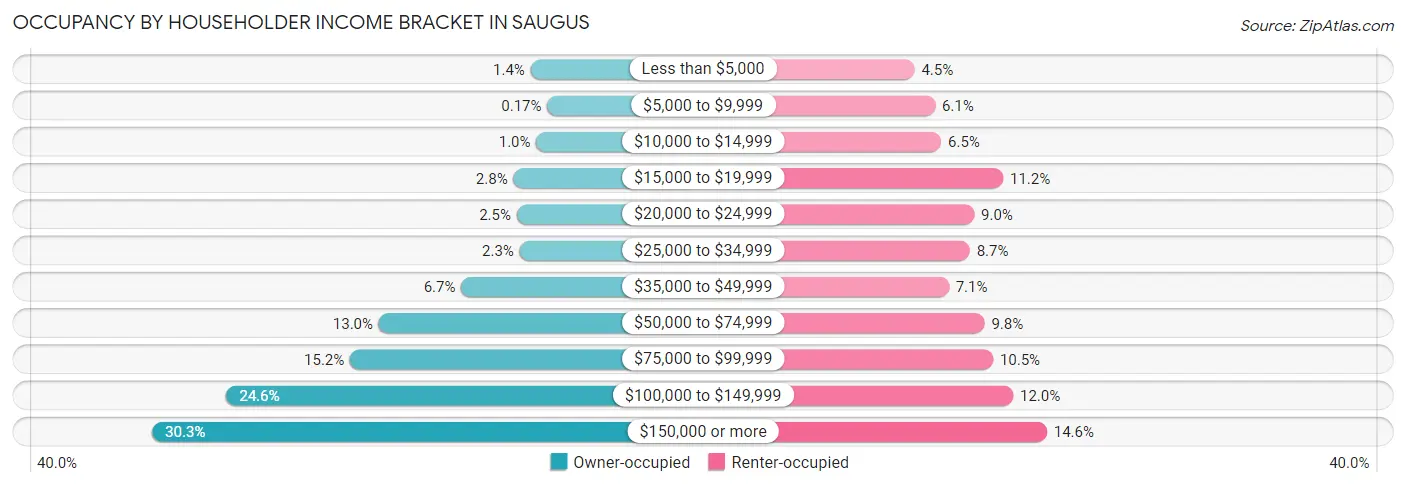
| Income Bracket | Owner-occupied | Renter-occupied |
| Less than $5,000 | 115 (1.4%) | 124 (4.5%) |
| $5,000 to $9,999 | 14 (0.2%) | 167 (6.0%) |
| $10,000 to $14,999 | 81 (1.0%) | 180 (6.5%) |
| $15,000 to $19,999 | 220 (2.8%) | 310 (11.2%) |
| $20,000 to $24,999 | 200 (2.5%) | 249 (9.0%) |
| $25,000 to $34,999 | 183 (2.3%) | 240 (8.7%) |
| $35,000 to $49,999 | 539 (6.7%) | 196 (7.1%) |
| $50,000 to $74,999 | 1,042 (13.0%) | 271 (9.8%) |
| $75,000 to $99,999 | 1,217 (15.2%) | 289 (10.5%) |
| $100,000 to $149,999 | 1,973 (24.6%) | 331 (12.0%) |
| $150,000 or more | 2,425 (30.3%) | 402 (14.6%) |
| Total | 8,009 (100.0%) | 2,759 (100.0%) |
Monthly Housing Cost Tiers in Saugus
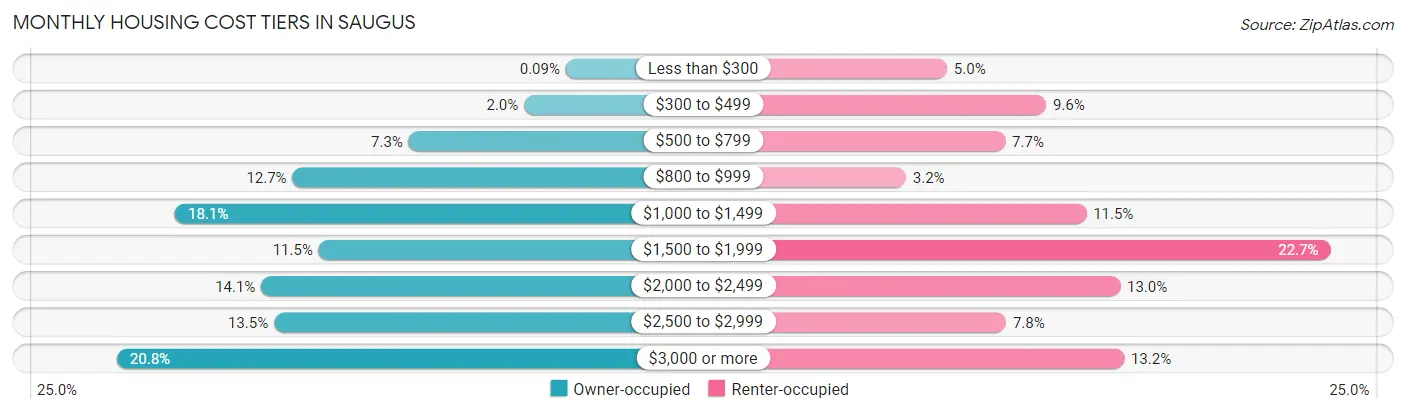
| Monthly Cost | Owner-occupied | Renter-occupied |
| Less than $300 | 7 (0.1%) | 139 (5.0%) |
| $300 to $499 | 161 (2.0%) | 265 (9.6%) |
| $500 to $799 | 586 (7.3%) | 213 (7.7%) |
| $800 to $999 | 1,015 (12.7%) | 87 (3.2%) |
| $1,000 to $1,499 | 1,447 (18.1%) | 316 (11.5%) |
| $1,500 to $1,999 | 918 (11.5%) | 626 (22.7%) |
| $2,000 to $2,499 | 1,130 (14.1%) | 359 (13.0%) |
| $2,500 to $2,999 | 1,083 (13.5%) | 214 (7.8%) |
| $3,000 or more | 1,662 (20.7%) | 364 (13.2%) |
| Total | 8,009 (100.0%) | 2,759 (100.0%) |
Physical Housing Characteristics in Saugus
Housing Structures in Saugus
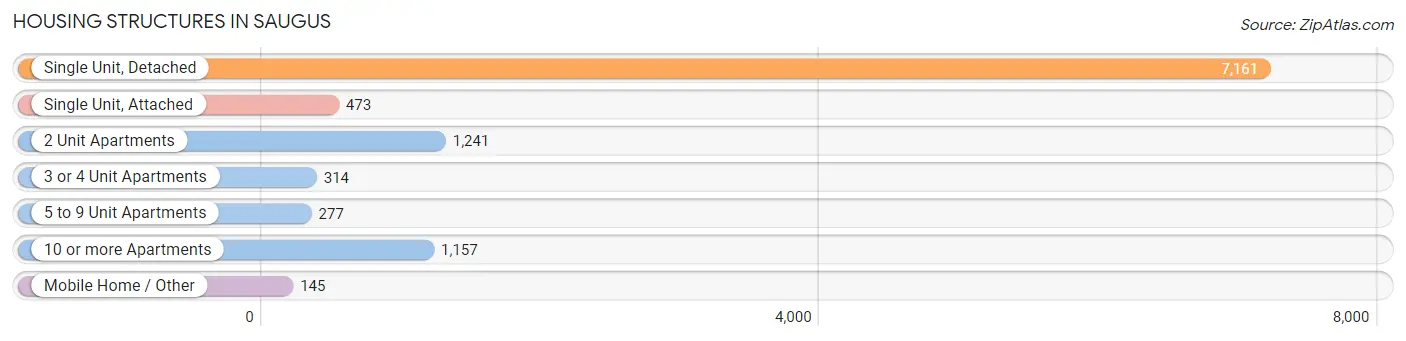
| Structure Type | # Housing Units | % Housing Units |
| Single Unit, Detached | 7,161 | 66.5% |
| Single Unit, Attached | 473 | 4.4% |
| 2 Unit Apartments | 1,241 | 11.5% |
| 3 or 4 Unit Apartments | 314 | 2.9% |
| 5 to 9 Unit Apartments | 277 | 2.6% |
| 10 or more Apartments | 1,157 | 10.7% |
| Mobile Home / Other | 145 | 1.3% |
| Total | 10,768 | 100.0% |
Housing Structures by Occupancy in Saugus
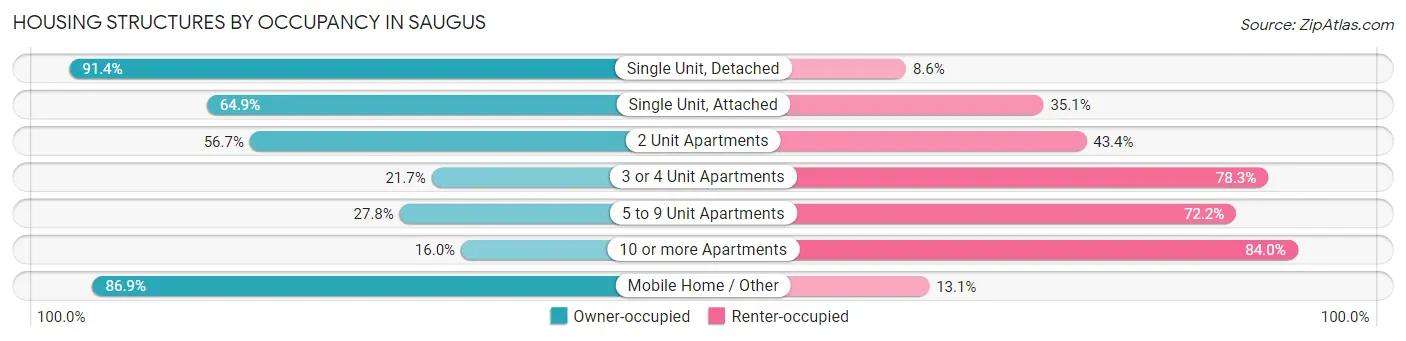
| Structure Type | Owner-occupied | Renter-occupied |
| Single Unit, Detached | 6,543 (91.4%) | 618 (8.6%) |
| Single Unit, Attached | 307 (64.9%) | 166 (35.1%) |
| 2 Unit Apartments | 703 (56.7%) | 538 (43.3%) |
| 3 or 4 Unit Apartments | 68 (21.7%) | 246 (78.3%) |
| 5 to 9 Unit Apartments | 77 (27.8%) | 200 (72.2%) |
| 10 or more Apartments | 185 (16.0%) | 972 (84.0%) |
| Mobile Home / Other | 126 (86.9%) | 19 (13.1%) |
| Total | 8,009 (74.4%) | 2,759 (25.6%) |
Housing Structures by Number of Rooms in Saugus
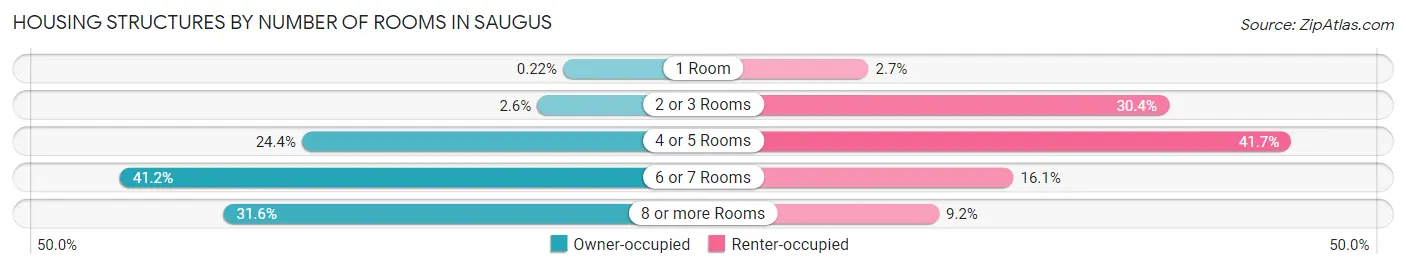
| Number of Rooms | Owner-occupied | Renter-occupied |
| 1 Room | 18 (0.2%) | 73 (2.6%) |
| 2 or 3 Rooms | 209 (2.6%) | 839 (30.4%) |
| 4 or 5 Rooms | 1,952 (24.4%) | 1,151 (41.7%) |
| 6 or 7 Rooms | 3,299 (41.2%) | 443 (16.1%) |
| 8 or more Rooms | 2,531 (31.6%) | 253 (9.2%) |
| Total | 8,009 (100.0%) | 2,759 (100.0%) |
Housing Structure by Heating Type in Saugus
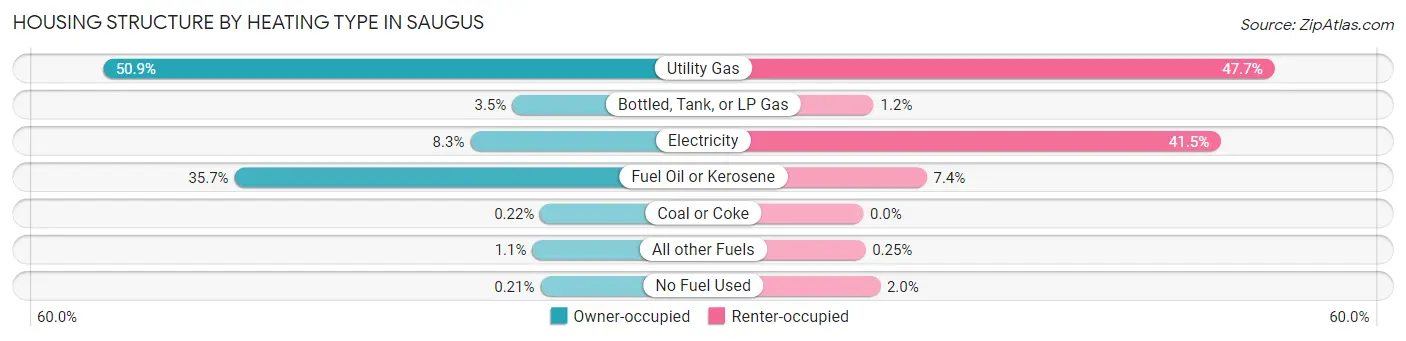
| Heating Type | Owner-occupied | Renter-occupied |
| Utility Gas | 4,080 (50.9%) | 1,316 (47.7%) |
| Bottled, Tank, or LP Gas | 279 (3.5%) | 34 (1.2%) |
| Electricity | 667 (8.3%) | 1,145 (41.5%) |
| Fuel Oil or Kerosene | 2,857 (35.7%) | 203 (7.4%) |
| Coal or Coke | 18 (0.2%) | 0 (0.0%) |
| All other Fuels | 91 (1.1%) | 7 (0.3%) |
| No Fuel Used | 17 (0.2%) | 54 (2.0%) |
| Total | 8,009 (100.0%) | 2,759 (100.0%) |
Household Vehicle Usage in Saugus
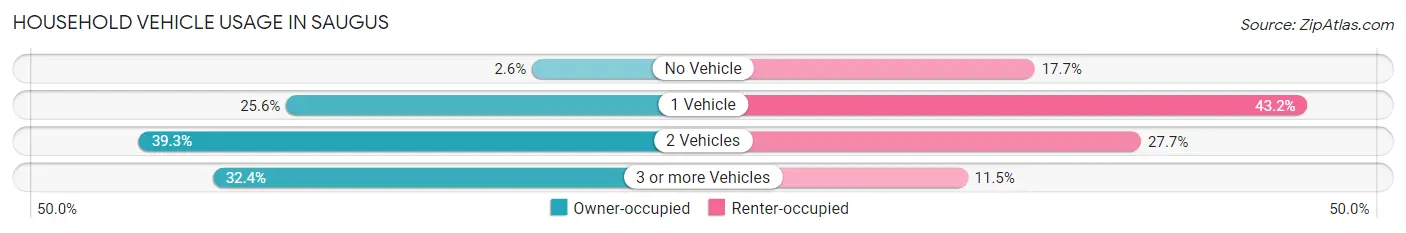
| Vehicles per Household | Owner-occupied | Renter-occupied |
| No Vehicle | 211 (2.6%) | 489 (17.7%) |
| 1 Vehicle | 2,049 (25.6%) | 1,191 (43.2%) |
| 2 Vehicles | 3,151 (39.3%) | 763 (27.7%) |
| 3 or more Vehicles | 2,598 (32.4%) | 316 (11.5%) |
| Total | 8,009 (100.0%) | 2,759 (100.0%) |
Real Estate & Mortgages in Saugus
Real Estate and Mortgage Overview in Saugus
| Characteristic | Without Mortgage | With Mortgage |
| Housing Units | 2,857 | 5,152 |
| Median Property Value | $502,900 | $559,800 |
| Median Household Income | $80,426 | $1,780 |
| Monthly Housing Costs | $967 | $1,650 |
| Real Estate Taxes | $5,132 | $77 |
Property Value by Mortgage Status in Saugus
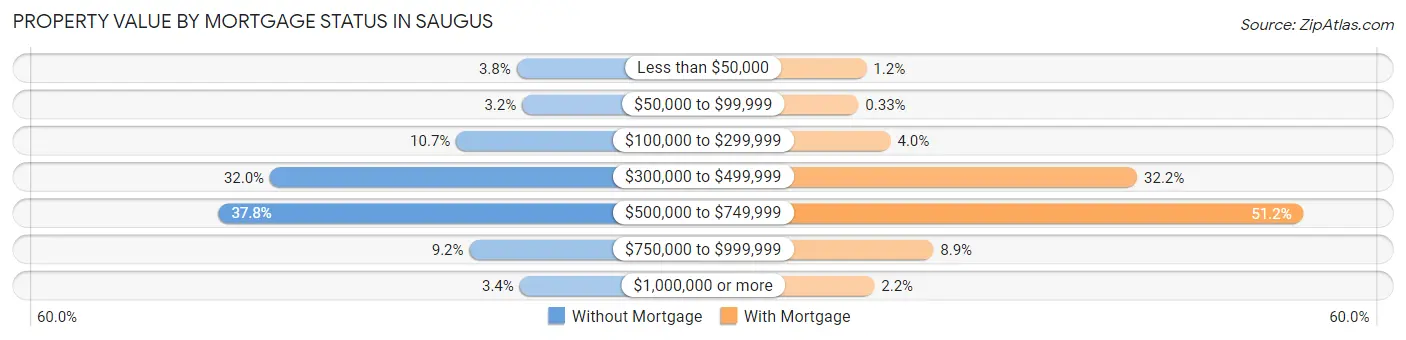
| Property Value | Without Mortgage | With Mortgage |
| Less than $50,000 | 108 (3.8%) | 64 (1.2%) |
| $50,000 to $99,999 | 90 (3.2%) | 17 (0.3%) |
| $100,000 to $299,999 | 305 (10.7%) | 206 (4.0%) |
| $300,000 to $499,999 | 913 (32.0%) | 1,658 (32.2%) |
| $500,000 to $749,999 | 1,081 (37.8%) | 2,638 (51.2%) |
| $750,000 to $999,999 | 262 (9.2%) | 458 (8.9%) |
| $1,000,000 or more | 98 (3.4%) | 111 (2.1%) |
| Total | 2,857 (100.0%) | 5,152 (100.0%) |
Household Income by Mortgage Status in Saugus
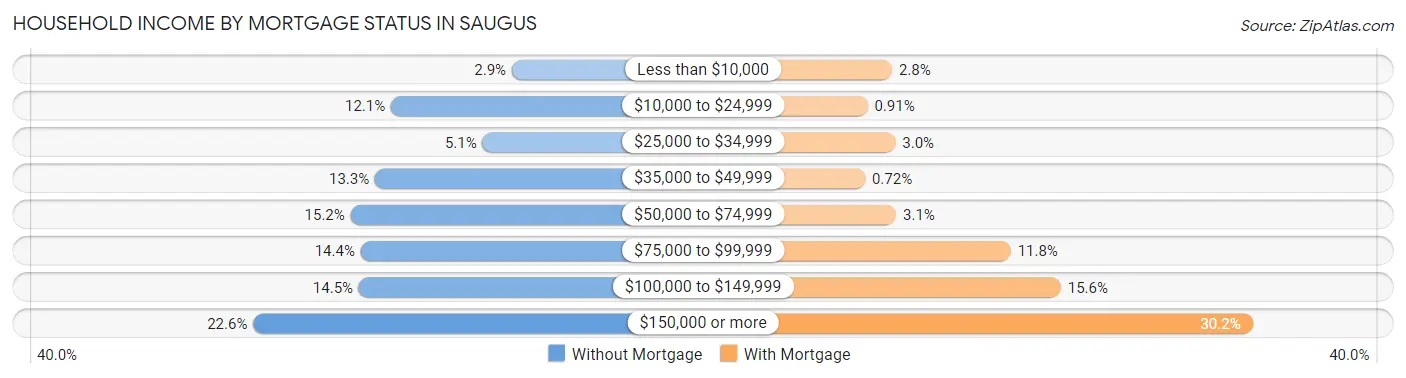
| Household Income | Without Mortgage | With Mortgage |
| Less than $10,000 | 82 (2.9%) | 143 (2.8%) |
| $10,000 to $24,999 | 345 (12.1%) | 47 (0.9%) |
| $25,000 to $34,999 | 146 (5.1%) | 156 (3.0%) |
| $35,000 to $49,999 | 380 (13.3%) | 37 (0.7%) |
| $50,000 to $74,999 | 433 (15.2%) | 159 (3.1%) |
| $75,000 to $99,999 | 411 (14.4%) | 609 (11.8%) |
| $100,000 to $149,999 | 415 (14.5%) | 806 (15.6%) |
| $150,000 or more | 645 (22.6%) | 1,558 (30.2%) |
| Total | 2,857 (100.0%) | 5,152 (100.0%) |
Property Value to Household Income Ratio in Saugus
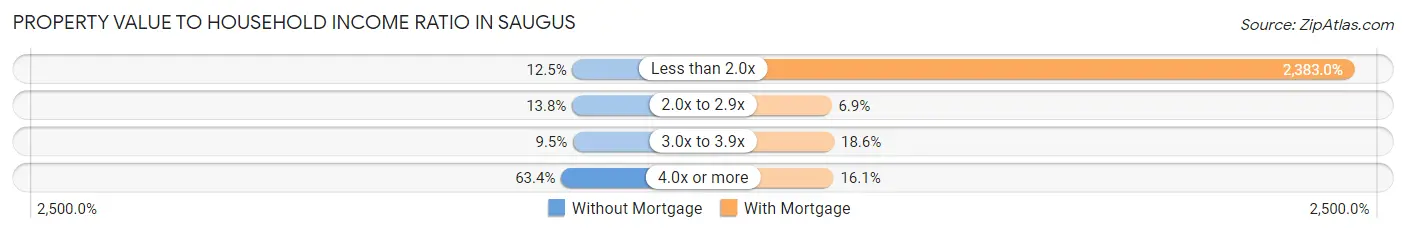
| Value-to-Income Ratio | Without Mortgage | With Mortgage |
| Less than 2.0x | 356 (12.5%) | 122,772 (2,383.0%) |
| 2.0x to 2.9x | 394 (13.8%) | 354 (6.9%) |
| 3.0x to 3.9x | 272 (9.5%) | 956 (18.6%) |
| 4.0x or more | 1,812 (63.4%) | 828 (16.1%) |
| Total | 2,857 (100.0%) | 5,152 (100.0%) |
Real Estate Taxes by Mortgage Status in Saugus
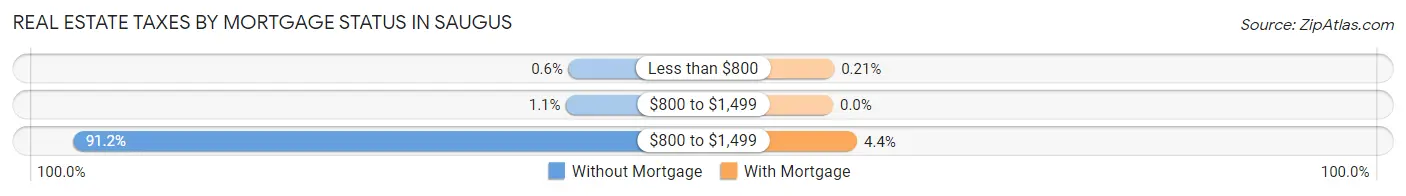
| Property Taxes | Without Mortgage | With Mortgage |
| Less than $800 | 17 (0.6%) | 11 (0.2%) |
| $800 to $1,499 | 30 (1.1%) | 0 (0.0%) |
| $800 to $1,499 | 2,606 (91.2%) | 226 (4.4%) |
| Total | 2,857 (100.0%) | 5,152 (100.0%) |
Health & Disability in Saugus
Health Insurance Coverage by Age in Saugus
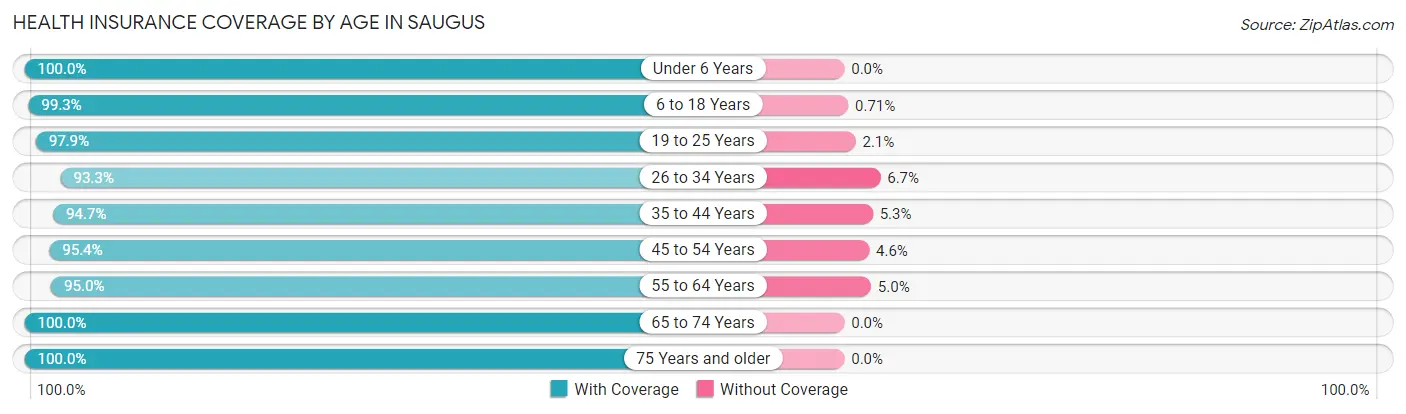
| Age Bracket | With Coverage | Without Coverage |
| Under 6 Years | 1,445 (100.0%) | 0 (0.0%) |
| 6 to 18 Years | 3,491 (99.3%) | 25 (0.7%) |
| 19 to 25 Years | 2,327 (97.9%) | 50 (2.1%) |
| 26 to 34 Years | 3,199 (93.3%) | 230 (6.7%) |
| 35 to 44 Years | 3,432 (94.7%) | 192 (5.3%) |
| 45 to 54 Years | 3,819 (95.4%) | 185 (4.6%) |
| 55 to 64 Years | 3,831 (95.0%) | 200 (5.0%) |
| 65 to 74 Years | 3,198 (100.0%) | 0 (0.0%) |
| 75 Years and older | 2,781 (100.0%) | 0 (0.0%) |
| Total | 27,523 (96.9%) | 882 (3.1%) |
Health Insurance Coverage by Citizenship Status in Saugus
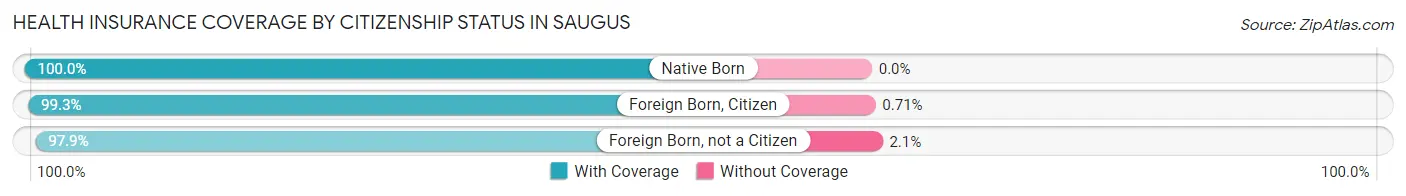
| Citizenship Status | With Coverage | Without Coverage |
| Native Born | 1,445 (100.0%) | 0 (0.0%) |
| Foreign Born, Citizen | 3,491 (99.3%) | 25 (0.7%) |
| Foreign Born, not a Citizen | 2,327 (97.9%) | 50 (2.1%) |
Health Insurance Coverage by Household Income in Saugus
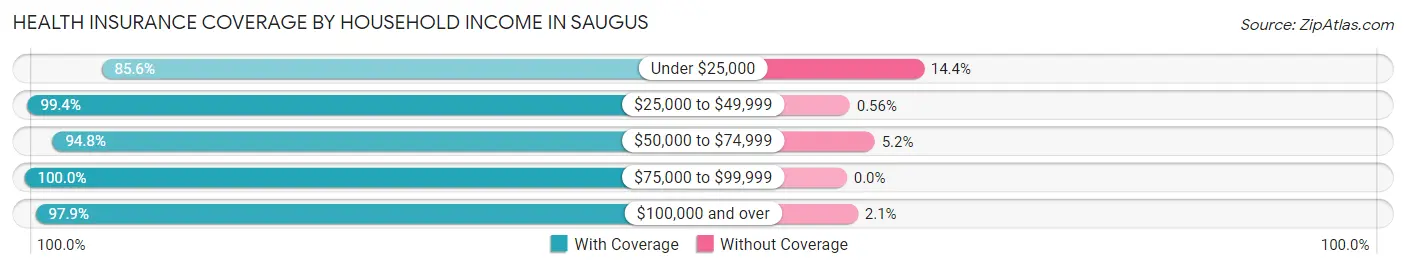
| Household Income | With Coverage | Without Coverage |
| Under $25,000 | 2,153 (85.6%) | 363 (14.4%) |
| $25,000 to $49,999 | 2,129 (99.4%) | 12 (0.6%) |
| $50,000 to $74,999 | 2,735 (94.8%) | 151 (5.2%) |
| $75,000 to $99,999 | 3,620 (100.0%) | 0 (0.0%) |
| $100,000 and over | 16,713 (97.9%) | 354 (2.1%) |
Public vs Private Health Insurance Coverage by Age in Saugus
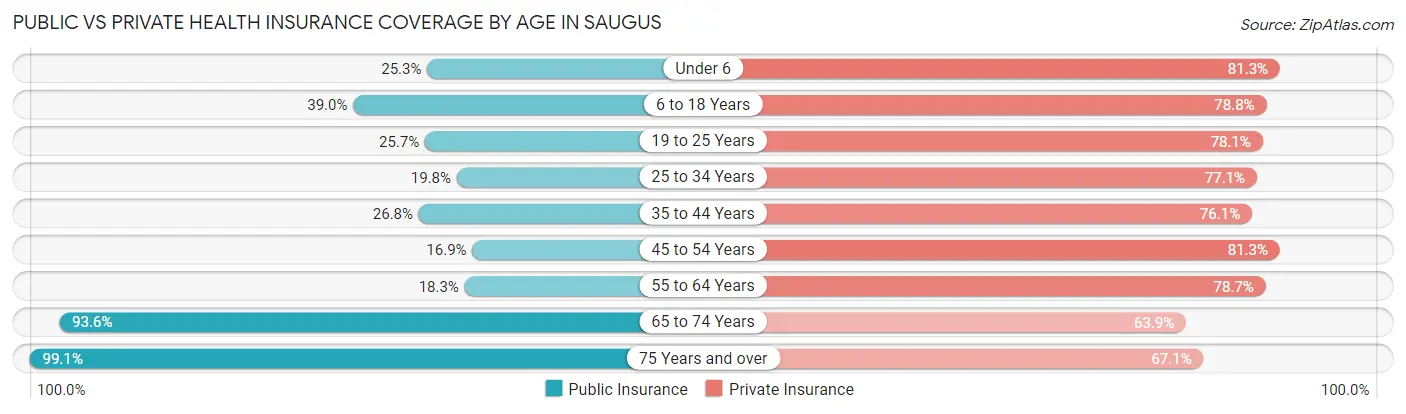
| Age Bracket | Public Insurance | Private Insurance |
| Under 6 | 365 (25.3%) | 1,175 (81.3%) |
| 6 to 18 Years | 1,371 (39.0%) | 2,771 (78.8%) |
| 19 to 25 Years | 610 (25.7%) | 1,857 (78.1%) |
| 25 to 34 Years | 678 (19.8%) | 2,642 (77.0%) |
| 35 to 44 Years | 972 (26.8%) | 2,759 (76.1%) |
| 45 to 54 Years | 676 (16.9%) | 3,255 (81.3%) |
| 55 to 64 Years | 738 (18.3%) | 3,171 (78.7%) |
| 65 to 74 Years | 2,993 (93.6%) | 2,044 (63.9%) |
| 75 Years and over | 2,755 (99.1%) | 1,867 (67.1%) |
| Total | 11,158 (39.3%) | 21,541 (75.8%) |
Disability Status by Sex by Age in Saugus
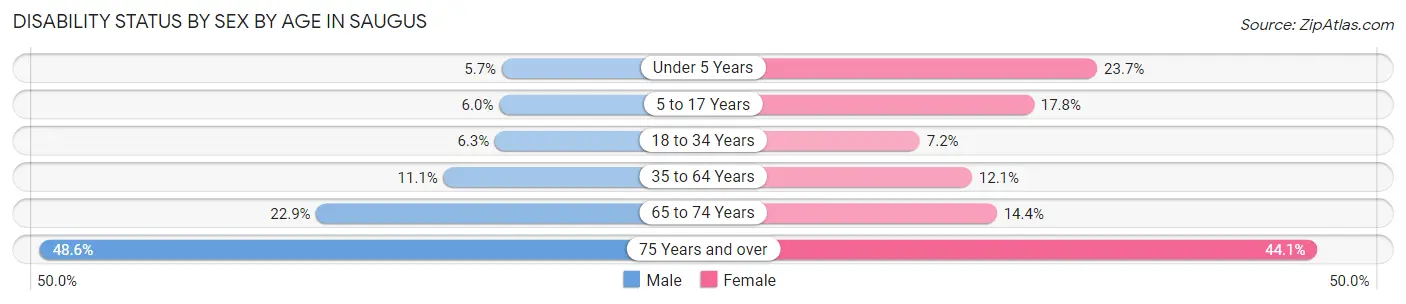
| Age Bracket | Male | Female |
| Under 5 Years | 42 (5.7%) | 82 (23.7%) |
| 5 to 17 Years | 111 (5.9%) | 324 (17.8%) |
| 18 to 34 Years | 178 (6.3%) | 231 (7.2%) |
| 35 to 64 Years | 660 (11.1%) | 690 (12.1%) |
| 65 to 74 Years | 360 (22.9%) | 234 (14.4%) |
| 75 Years and over | 498 (48.6%) | 775 (44.1%) |
Disability Class by Sex by Age in Saugus
Disability Class: Hearing Difficulty
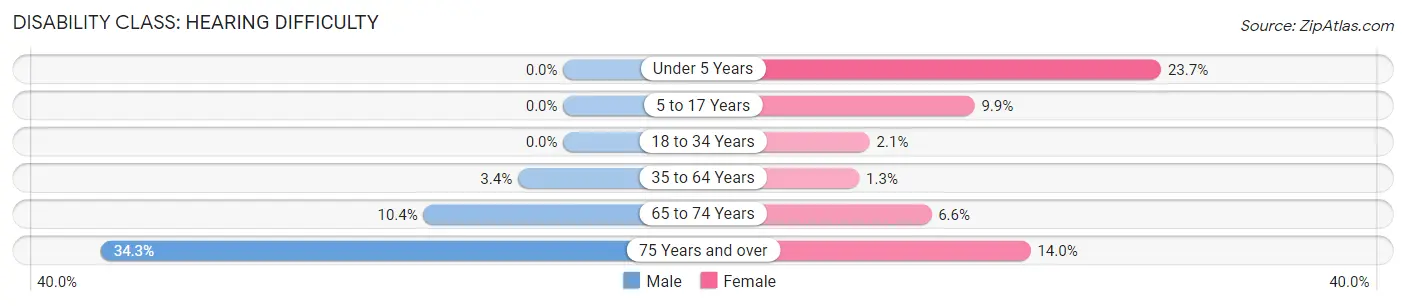
| Age Bracket | Male | Female |
| Under 5 Years | 0 (0.0%) | 82 (23.7%) |
| 5 to 17 Years | 0 (0.0%) | 179 (9.9%) |
| 18 to 34 Years | 0 (0.0%) | 66 (2.1%) |
| 35 to 64 Years | 200 (3.4%) | 74 (1.3%) |
| 65 to 74 Years | 163 (10.4%) | 108 (6.6%) |
| 75 Years and over | 352 (34.3%) | 246 (14.0%) |
Disability Class: Vision Difficulty
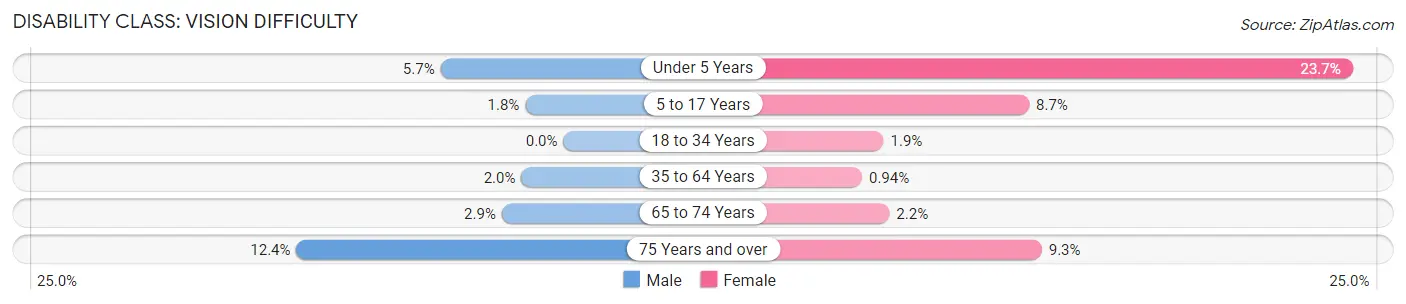
| Age Bracket | Male | Female |
| Under 5 Years | 42 (5.7%) | 82 (23.7%) |
| 5 to 17 Years | 33 (1.8%) | 158 (8.7%) |
| 18 to 34 Years | 0 (0.0%) | 62 (1.9%) |
| 35 to 64 Years | 116 (1.9%) | 54 (0.9%) |
| 65 to 74 Years | 45 (2.9%) | 36 (2.2%) |
| 75 Years and over | 127 (12.4%) | 163 (9.3%) |
Disability Class: Cognitive Difficulty
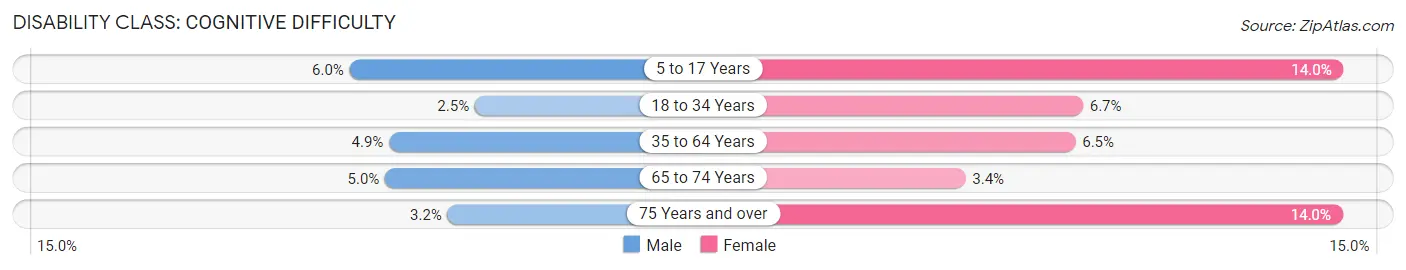
| Age Bracket | Male | Female |
| 5 to 17 Years | 111 (5.9%) | 254 (14.0%) |
| 18 to 34 Years | 69 (2.5%) | 214 (6.7%) |
| 35 to 64 Years | 288 (4.9%) | 372 (6.5%) |
| 65 to 74 Years | 78 (5.0%) | 56 (3.4%) |
| 75 Years and over | 33 (3.2%) | 245 (14.0%) |
Disability Class: Ambulatory Difficulty
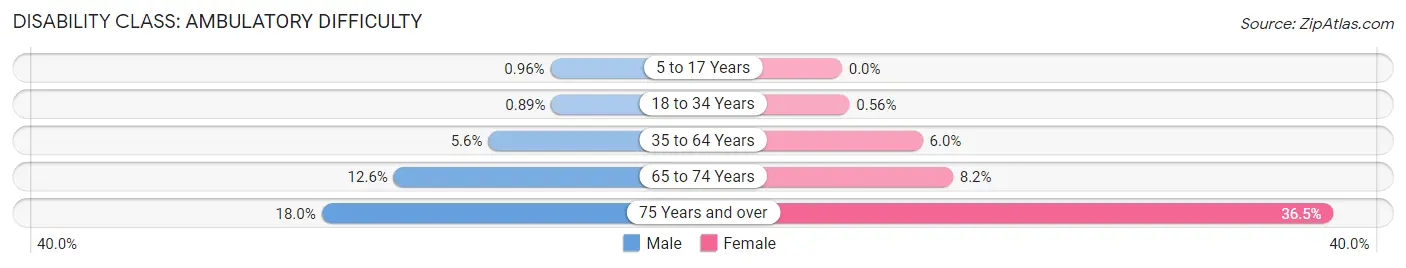
| Age Bracket | Male | Female |
| 5 to 17 Years | 18 (1.0%) | 0 (0.0%) |
| 18 to 34 Years | 25 (0.9%) | 18 (0.6%) |
| 35 to 64 Years | 331 (5.6%) | 343 (6.0%) |
| 65 to 74 Years | 198 (12.6%) | 134 (8.2%) |
| 75 Years and over | 184 (17.9%) | 641 (36.5%) |
Disability Class: Self-Care Difficulty
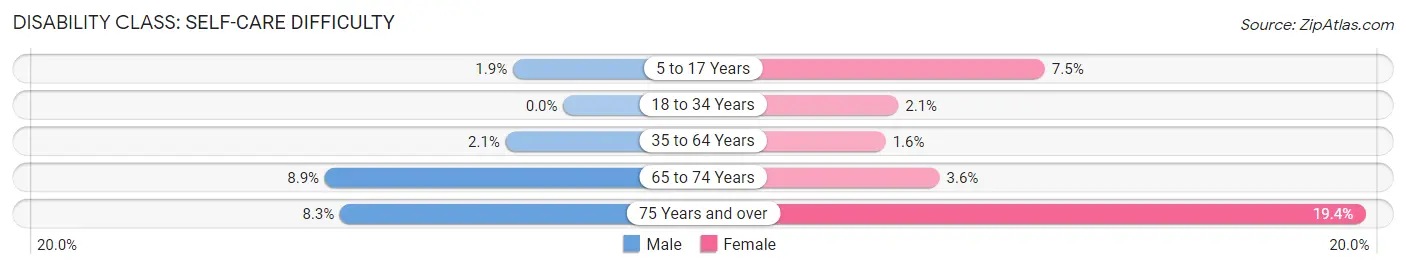
| Age Bracket | Male | Female |
| 5 to 17 Years | 35 (1.9%) | 137 (7.5%) |
| 18 to 34 Years | 0 (0.0%) | 67 (2.1%) |
| 35 to 64 Years | 127 (2.1%) | 93 (1.6%) |
| 65 to 74 Years | 139 (8.8%) | 59 (3.6%) |
| 75 Years and over | 85 (8.3%) | 341 (19.4%) |
Technology Access in Saugus
Computing Device Access in Saugus
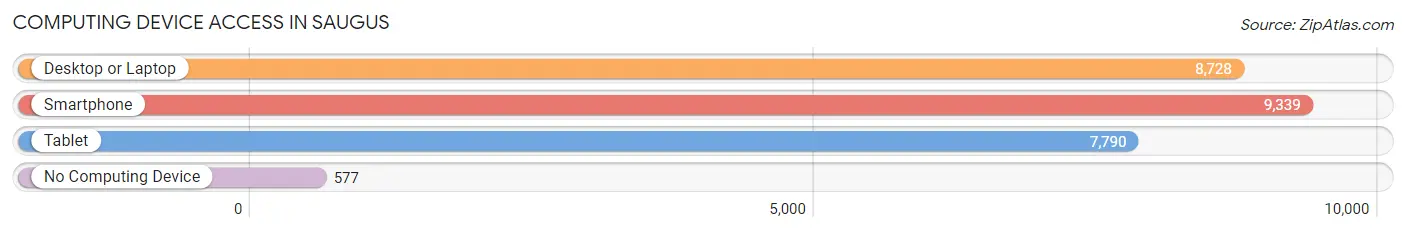
| Device Type | # Households | % Households |
| Desktop or Laptop | 8,728 | 81.0% |
| Smartphone | 9,339 | 86.7% |
| Tablet | 7,790 | 72.3% |
| No Computing Device | 577 | 5.4% |
| Total | 10,768 | 100.0% |
Internet Access in Saugus
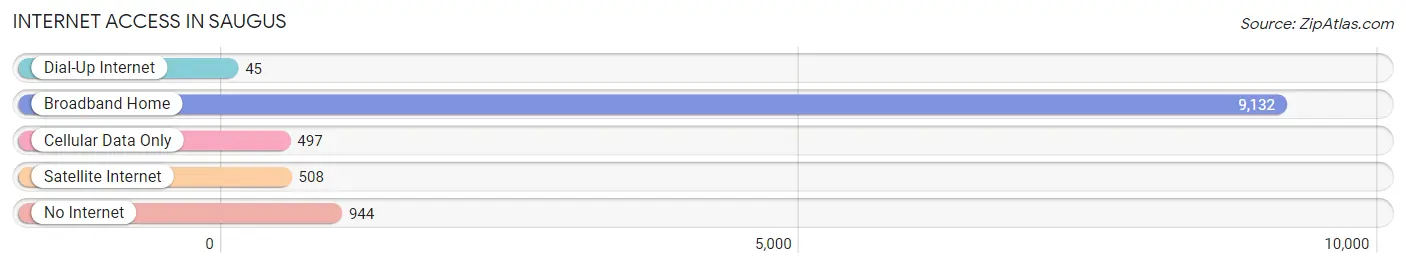
| Internet Type | # Households | % Households |
| Dial-Up Internet | 45 | 0.4% |
| Broadband Home | 9,132 | 84.8% |
| Cellular Data Only | 497 | 4.6% |
| Satellite Internet | 508 | 4.7% |
| No Internet | 944 | 8.8% |
| Total | 10,768 | 100.0% |
Saugus Summary
Saugus is a town located in Essex County, Massachusetts, United States. It is located approximately 10 miles north of Boston and is part of the Greater Boston metropolitan area. As of the 2010 census, the town had a population of 26,628.
History
The area now known as Saugus was first settled in 1629 by a group of English settlers led by John Saugus. The town was officially incorporated in 1644 and was named after the Saugus River, which runs through the town.
In the early 19th century, Saugus was a major industrial center, with several ironworks and paper mills located in the town. The Saugus Iron Works, which was established in 1646, was the first integrated ironworks in North America and is now a National Historic Site.
Geography
Saugus is located in eastern Massachusetts, approximately 10 miles north of Boston. It is bordered by the towns of Lynn, Revere, Malden, Melrose, Wakefield, and Stoneham. The town is located on the Saugus River, which runs through the center of town.
The town has a total area of 8.7 square miles, of which 8.3 square miles is land and 0.4 square miles is water. The town is mostly flat, with some hills in the northern part of town.
Economy
Saugus is a primarily residential community, with a few small businesses located in the town. The largest employers in the town are the Saugus Public Schools, the Saugus Iron Works National Historic Site, and the Saugus Public Library.
Demographics
As of the 2010 census, there were 26,628 people, 10,717 households, and 6,945 families residing in the town. The population density was 3,200.7 people per square mile. The racial makeup of the town was 87.3% White, 4.2% African American, 0.3% Native American, 4.2% Asian, 0.1% Pacific Islander, 1.7% from other races, and 2.2% from two or more races. Hispanic or Latino of any race were 5.2% of the population.
The median income for a household in the town was $63,945, and the median income for a family was $76,945. The per capita income for the town was $30,945. About 4.2% of families and 5.7% of the population were below the poverty line, including 6.7% of those under age 18 and 5.2% of those age 65 or over.
Common Questions
What is the Total Population of Saugus?
Total Population of Saugus is 28,566.
What is the Total Male Population of Saugus?
Total Male Population of Saugus is 14,013.
What is the Total Female Population of Saugus?
Total Female Population of Saugus is 14,553.
What is the Ratio of Males per 100 Females in Saugus?
There are 96.29 Males per 100 Females in Saugus.
What is the Ratio of Females per 100 Males in Saugus?
There are 103.85 Females per 100 Males in Saugus.
What is the Median Population Age in Saugus?
Median Population Age in Saugus is 44.4 Years.
What is the Average Family Size in Saugus
Average Family Size in Saugus is 3.1 People.
What is the Average Household Size in Saugus
Average Household Size in Saugus is 2.6 People.
What is Per Capita Income in Saugus?
Per Capita income in Saugus is $46,357.
What is the Median Family Income in Saugus?
Median Family Income in Saugus is $110,597.
What is the Median Household income in Saugus?
Median Household Income in Saugus is $96,064.
What is Income or Wage Gap in Saugus?
Income or Wage Gap in Saugus is 16.8%.
Women in Saugus earn 83.2 cents for every dollar earned by a man.
What is Inequality or Gini Index in Saugus?
Inequality or Gini Index in Saugus is 0.44.
How Large is the Labor Force in Saugus?
There are 15,879 People in the Labor Forcein in Saugus.
What is the Percentage of People in the Labor Force in Saugus?
64.8% of People are in the Labor Force in Saugus.
What is the Unemployment Rate in Saugus?
Unemployment Rate in Saugus is 3.4%.