Cities with the Most Immigrants from Caribbean in Kansas
RELATED REPORTS & OPTIONS
Caribbean
Kansas
Compare Cities
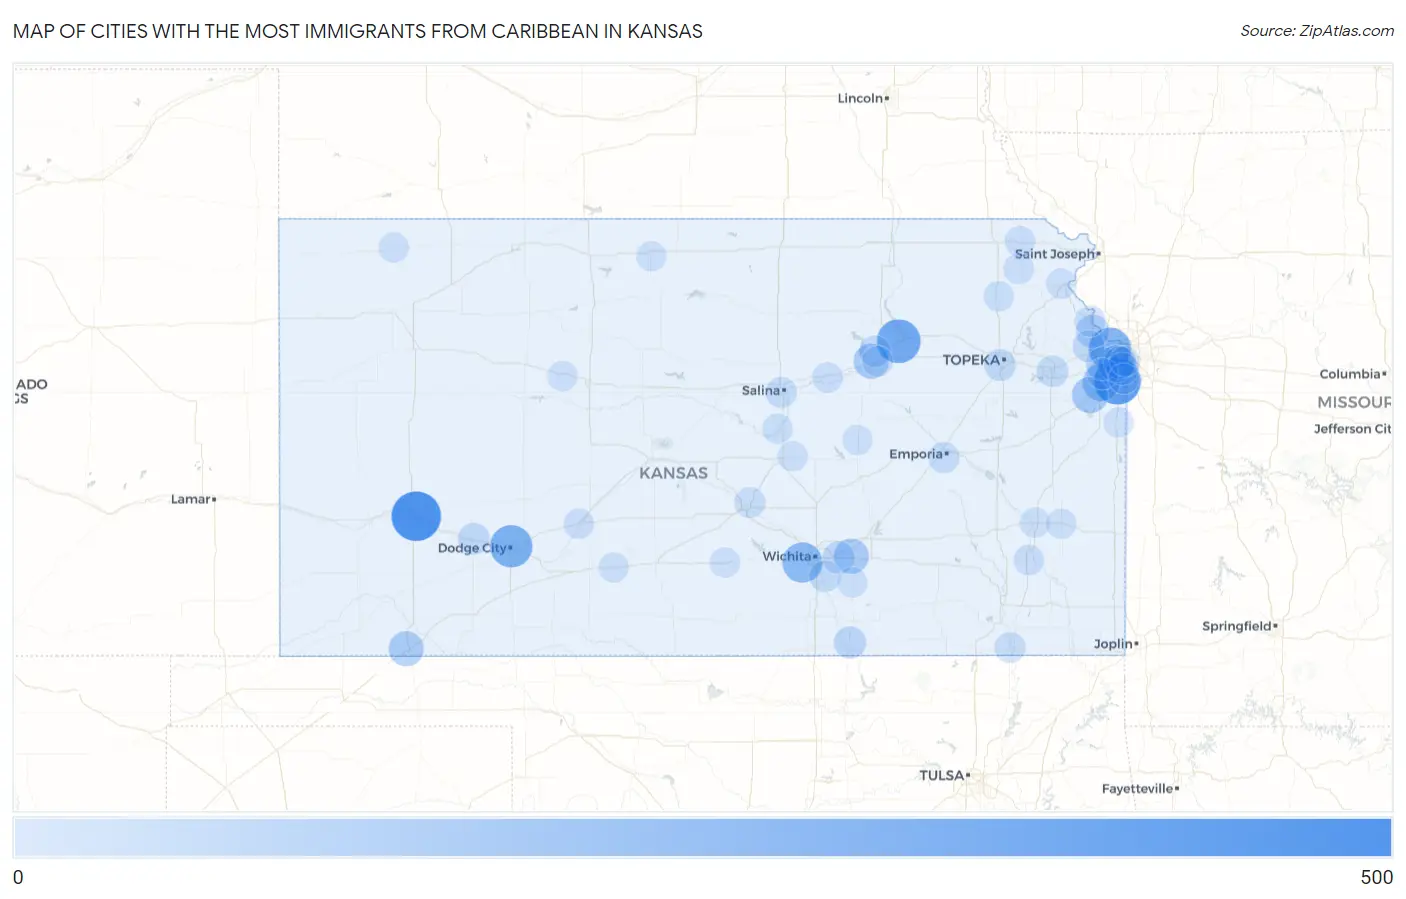
Map of Cities with the Most Immigrants from Caribbean in Kansas
0
500
Cities with the Most Immigrants from Caribbean in Kansas
| City | Caribbean | vs State | vs National | |
| 1. | Garden City | 449 | 3,670(12.23%)#1 | 4,544,093(0.01%)#726 |
| 2. | Overland Park | 380 | 3,670(10.35%)#2 | 4,544,093(0.01%)#826 |
| 3. | Manhattan | 311 | 3,670(8.47%)#3 | 4,544,093(0.01%)#972 |
| 4. | Kansas City | 278 | 3,670(7.57%)#4 | 4,544,093(0.01%)#1,045 |
| 5. | Dodge City | 278 | 3,670(7.57%)#5 | 4,544,093(0.01%)#1,047 |
| 6. | Wichita | 228 | 3,670(6.21%)#6 | 4,544,093(0.01%)#1,214 |
| 7. | Olathe | 162 | 3,670(4.41%)#7 | 4,544,093(0.00%)#1,547 |
| 8. | Merriam | 146 | 3,670(3.98%)#8 | 4,544,093(0.00%)#1,645 |
| 9. | Gardner | 132 | 3,670(3.60%)#9 | 4,544,093(0.00%)#1,750 |
| 10. | Junction City | 115 | 3,670(3.13%)#10 | 4,544,093(0.00%)#1,905 |
| 11. | Augusta | 111 | 3,670(3.02%)#11 | 4,544,093(0.00%)#1,964 |
| 12. | Liberal | 109 | 3,670(2.97%)#12 | 4,544,093(0.00%)#1,984 |
| 13. | Lansing | 65 | 3,670(1.77%)#13 | 4,544,093(0.00%)#2,636 |
| 14. | Shawnee | 63 | 3,670(1.72%)#14 | 4,544,093(0.00%)#2,667 |
| 15. | Mission | 52 | 3,670(1.42%)#15 | 4,544,093(0.00%)#2,945 |
| 16. | Prairie Village | 49 | 3,670(1.34%)#16 | 4,544,093(0.00%)#3,016 |
| 17. | Andover | 48 | 3,670(1.31%)#17 | 4,544,093(0.00%)#3,046 |
| 18. | Arkansas City | 43 | 3,670(1.17%)#18 | 4,544,093(0.00%)#3,210 |
| 19. | Topeka | 37 | 3,670(1.01%)#19 | 4,544,093(0.00%)#3,388 |
| 20. | Basehor | 35 | 3,670(0.95%)#20 | 4,544,093(0.00%)#3,486 |
| 21. | Cimarron | 35 | 3,670(0.95%)#21 | 4,544,093(0.00%)#3,503 |
| 22. | Lawrence | 33 | 3,670(0.90%)#22 | 4,544,093(0.00%)#3,542 |
| 23. | Fort Riley | 31 | 3,670(0.84%)#23 | 4,544,093(0.00%)#3,657 |
| 24. | Derby | 29 | 3,670(0.79%)#24 | 4,544,093(0.00%)#3,724 |
| 25. | Lenexa | 24 | 3,670(0.65%)#25 | 4,544,093(0.00%)#3,983 |
| 26. | Emporia | 23 | 3,670(0.63%)#26 | 4,544,093(0.00%)#4,047 |
| 27. | Salina | 20 | 3,670(0.54%)#27 | 4,544,093(0.00%)#4,213 |
| 28. | Grandview Plaza | 16 | 3,670(0.44%)#28 | 4,544,093(0.00%)#4,558 |
| 29. | Hutchinson | 15 | 3,670(0.41%)#29 | 4,544,093(0.00%)#4,570 |
| 30. | Leavenworth | 15 | 3,670(0.41%)#30 | 4,544,093(0.00%)#4,571 |
| 31. | Coffeyville | 15 | 3,670(0.41%)#31 | 4,544,093(0.00%)#4,600 |
| 32. | Abilene | 9 | 3,670(0.25%)#32 | 4,544,093(0.00%)#5,230 |
| 33. | Horton | 9 | 3,670(0.25%)#33 | 4,544,093(0.00%)#5,272 |
| 34. | Atchison | 8 | 3,670(0.22%)#34 | 4,544,093(0.00%)#5,334 |
| 35. | Chanute | 7 | 3,670(0.19%)#35 | 4,544,093(0.00%)#5,464 |
| 36. | Leawood | 6 | 3,670(0.16%)#36 | 4,544,093(0.00%)#5,581 |
| 37. | Kinsley | 6 | 3,670(0.16%)#37 | 4,544,093(0.00%)#5,674 |
| 38. | Hiawatha | 5 | 3,670(0.14%)#38 | 4,544,093(0.00%)#5,764 |
| 39. | Lindsborg | 4 | 3,670(0.11%)#39 | 4,544,093(0.00%)#5,898 |
| 40. | Holton | 4 | 3,670(0.11%)#40 | 4,544,093(0.00%)#5,902 |
| 41. | Iola | 3 | 3,670(0.08%)#41 | 4,544,093(0.00%)#6,017 |
| 42. | Ellis | 2 | 3,670(0.05%)#42 | 4,544,093(0.00%)#6,201 |
| 43. | Moran | 2 | 3,670(0.05%)#43 | 4,544,093(0.00%)#6,272 |
| 44. | Louisburg | 1 | 3,670(0.03%)#44 | 4,544,093(0.00%)#6,351 |
| 45. | Kingman | 1 | 3,670(0.03%)#45 | 4,544,093(0.00%)#6,365 |
| 46. | Douglass | 1 | 3,670(0.03%)#46 | 4,544,093(0.00%)#6,388 |
| 47. | Smith Center | 1 | 3,670(0.03%)#47 | 4,544,093(0.00%)#6,390 |
| 48. | Atwood | 1 | 3,670(0.03%)#48 | 4,544,093(0.00%)#6,398 |
| 49. | Galva | 1 | 3,670(0.03%)#49 | 4,544,093(0.00%)#6,406 |
| 50. | Haviland | 1 | 3,670(0.03%)#50 | 4,544,093(0.00%)#6,419 |
| 51. | Lincolnville | 1 | 3,670(0.03%)#51 | 4,544,093(0.00%)#6,459 |
| 52. | Mission Woods | 1 | 3,670(0.03%)#52 | 4,544,093(0.00%)#6,467 |
Common Questions
What are the Top 10 Cities with the Most Immigrants from Caribbean in Kansas?
Top 10 Cities with the Most Immigrants from Caribbean in Kansas are:
#1
449
#2
380
#3
311
#4
278
#5
278
#6
228
#7
162
#8
146
#9
132
#10
115
What city has the Most Immigrants from Caribbean in Kansas?
Garden City has the Most Immigrants from Caribbean in Kansas with 449.
What is the Total Immigrants from Caribbean in the State of Kansas?
Total Immigrants from Caribbean in Kansas is 3,670.
What is the Total Immigrants from Caribbean in the United States?
Total Immigrants from Caribbean in the United States is 4,544,093.