Cities with the Highest Percentage of Immigrants from Eastern Asia in Alaska
RELATED REPORTS & OPTIONS
Eastern Asia
Alaska
Compare Cities
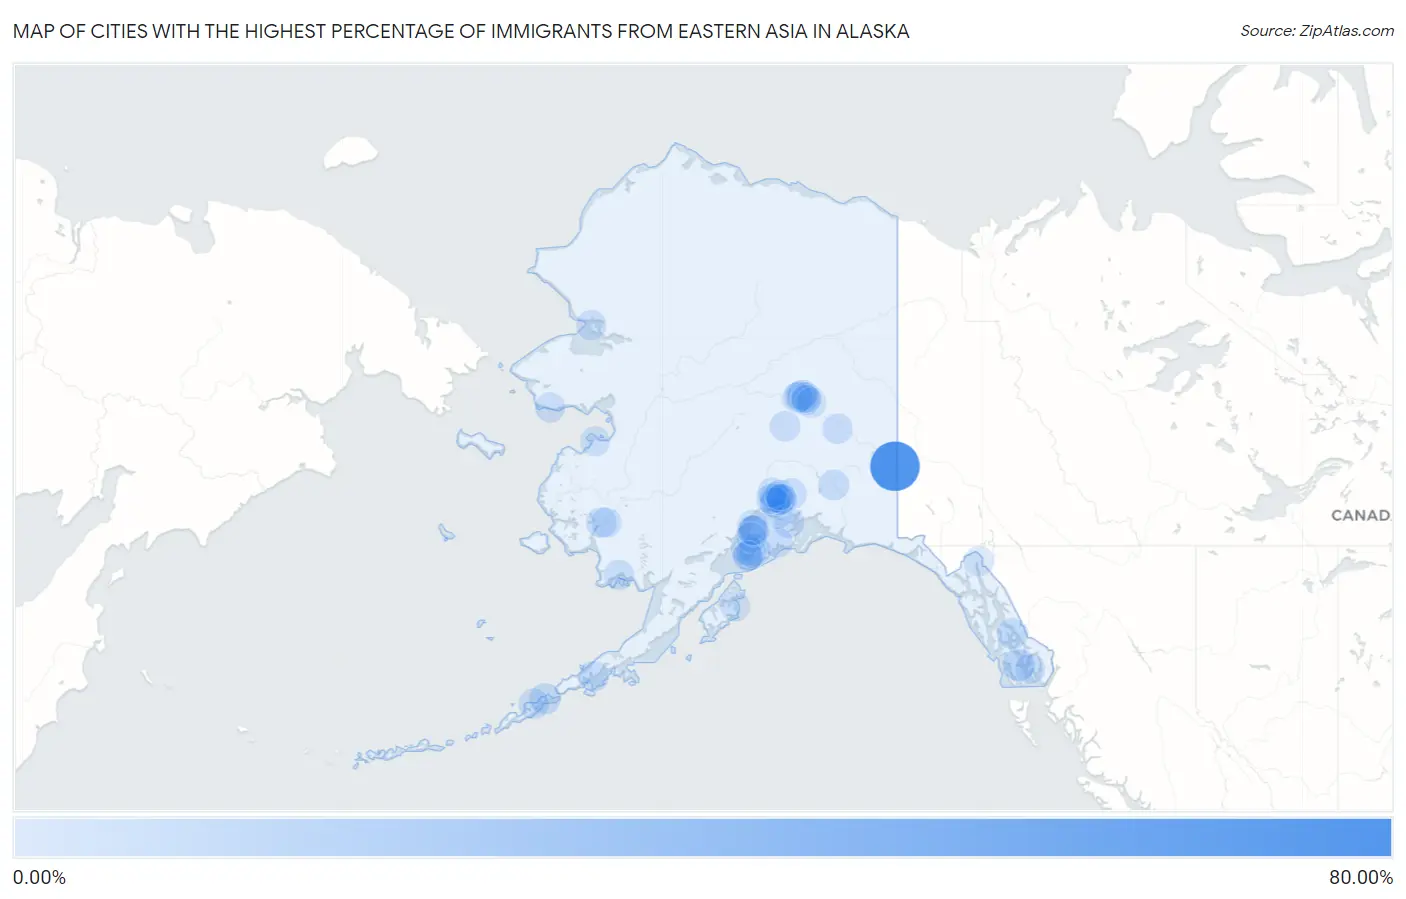
Map of Cities with the Highest Percentage of Immigrants from Eastern Asia in Alaska
0.00%
80.00%
Cities with the Highest Percentage of Immigrants from Eastern Asia in Alaska
| City | Eastern Asia | vs State | vs National | |
| 1. | Alcan Border | 77.53% | 0.84%(+76.7)#1 | 1.28%(+76.3)#1 |
| 2. | Kasaan | 8.54% | 0.84%(+7.70)#2 | 1.28%(+7.26)#220 |
| 3. | Fox River | 4.63% | 0.84%(+3.80)#3 | 1.28%(+3.36)#546 |
| 4. | Akutan | 4.50% | 0.84%(+3.66)#4 | 1.28%(+3.22)#575 |
| 5. | Petersburg | 3.41% | 0.84%(+2.57)#5 | 1.28%(+2.13)#835 |
| 6. | Tazlina | 2.51% | 0.84%(+1.67)#6 | 1.28%(+1.23)#1,184 |
| 7. | Chickaloon | 2.47% | 0.84%(+1.64)#7 | 1.28%(+1.20)#1,196 |
| 8. | Nikolaevsk | 2.45% | 0.84%(+1.61)#8 | 1.28%(+1.18)#1,205 |
| 9. | Whittier | 2.39% | 0.84%(+1.55)#9 | 1.28%(+1.11)#1,230 |
| 10. | Fairbanks | 2.16% | 0.84%(+1.32)#10 | 1.28%(+0.885)#1,379 |
| 11. | College | 2.00% | 0.84%(+1.16)#11 | 1.28%(+0.720)#1,495 |
| 12. | Kachemak | 1.78% | 0.84%(+0.943)#12 | 1.28%(+0.503)#1,685 |
| 13. | Bethel | 1.77% | 0.84%(+0.938)#13 | 1.28%(+0.499)#1,691 |
| 14. | Unalaska | 1.68% | 0.84%(+0.845)#14 | 1.28%(+0.406)#1,794 |
| 15. | Farmers Loop | 1.68% | 0.84%(+0.839)#15 | 1.28%(+0.399)#1,804 |
| 16. | Chena Ridge | 1.50% | 0.84%(+0.667)#16 | 1.28%(+0.228)#2,001 |
| 17. | Healy | 1.39% | 0.84%(+0.551)#17 | 1.28%(+0.112)#2,192 |
| 18. | Seward | 1.30% | 0.84%(+0.464)#18 | 1.28%(+0.025)#2,336 |
| 19. | Anchorage | 1.16% | 0.84%(+0.321)#19 | 1.28%(-0.118)#2,601 |
| 20. | Wasilla | 1.08% | 0.84%(+0.243)#20 | 1.28%(-0.197)#2,755 |
| 21. | Deltana | 1.07% | 0.84%(+0.232)#21 | 1.28%(-0.207)#2,779 |
| 22. | Ridgeway | 1.05% | 0.84%(+0.219)#22 | 1.28%(-0.221)#2,806 |
| 23. | Butte | 0.93% | 0.84%(+0.097)#23 | 1.28%(-0.343)#3,173 |
| 24. | King Cove | 0.90% | 0.84%(+0.066)#24 | 1.28%(-0.373)#3,256 |
| 25. | Nikiski | 0.89% | 0.84%(+0.049)#25 | 1.28%(-0.390)#3,291 |
| 26. | Fritz Creek | 0.74% | 0.84%(-0.097)#26 | 1.28%(-0.536)#3,829 |
| 27. | Nome | 0.73% | 0.84%(-0.108)#27 | 1.28%(-0.548)#3,872 |
| 28. | Kwethluk | 0.71% | 0.84%(-0.123)#28 | 1.28%(-0.563)#3,926 |
| 29. | Togiak | 0.71% | 0.84%(-0.124)#29 | 1.28%(-0.563)#3,927 |
| 30. | Soldotna | 0.66% | 0.84%(-0.176)#30 | 1.28%(-0.616)#4,163 |
| 31. | Cohoe | 0.66% | 0.84%(-0.178)#31 | 1.28%(-0.618)#4,177 |
| 32. | Juneau City And Borough | 0.61% | 0.84%(-0.229)#32 | 1.28%(-0.668)#4,389 |
| 33. | Utqiagvik | 0.59% | 0.84%(-0.242)#33 | 1.28%(-0.681)#4,458 |
| 34. | Mill Bay | 0.58% | 0.84%(-0.256)#34 | 1.28%(-0.695)#4,523 |
| 35. | Gateway | 0.53% | 0.84%(-0.307)#35 | 1.28%(-0.747)#4,847 |
| 36. | Kodiak | 0.50% | 0.84%(-0.335)#36 | 1.28%(-0.774)#5,013 |
| 37. | Eielson Afb | 0.49% | 0.84%(-0.348)#37 | 1.28%(-0.787)#5,104 |
| 38. | Meadow Lakes | 0.48% | 0.84%(-0.358)#38 | 1.28%(-0.797)#5,165 |
| 39. | Stebbins | 0.46% | 0.84%(-0.378)#39 | 1.28%(-0.817)#5,273 |
| 40. | Skagway | 0.42% | 0.84%(-0.412)#40 | 1.28%(-0.852)#5,544 |
| 41. | Tanaina | 0.42% | 0.84%(-0.413)#41 | 1.28%(-0.852)#5,552 |
| 42. | Knik Fairview | 0.42% | 0.84%(-0.417)#42 | 1.28%(-0.857)#5,582 |
| 43. | Badger | 0.40% | 0.84%(-0.435)#43 | 1.28%(-0.874)#5,723 |
| 44. | Sitka City And Borough | 0.38% | 0.84%(-0.458)#44 | 1.28%(-0.898)#5,897 |
| 45. | Willow | 0.26% | 0.84%(-0.580)#45 | 1.28%(-1.02)#6,892 |
| 46. | Homer | 0.23% | 0.84%(-0.605)#46 | 1.28%(-1.04)#7,141 |
| 47. | Kotzebue | 0.23% | 0.84%(-0.610)#47 | 1.28%(-1.05)#7,174 |
| 48. | Houston | 0.19% | 0.84%(-0.650)#48 | 1.28%(-1.09)#7,555 |
| 49. | South Lakes | 0.17% | 0.84%(-0.665)#49 | 1.28%(-1.10)#7,715 |
| 50. | Kenai | 0.16% | 0.84%(-0.676)#50 | 1.28%(-1.12)#7,817 |
| 51. | Fishhook | 0.16% | 0.84%(-0.680)#51 | 1.28%(-1.12)#7,855 |
| 52. | Ketchikan | 0.15% | 0.84%(-0.689)#52 | 1.28%(-1.13)#7,953 |
| 53. | North Pole | 0.14% | 0.84%(-0.694)#53 | 1.28%(-1.13)#8,002 |
| 54. | Palmer | 0.11% | 0.84%(-0.721)#54 | 1.28%(-1.16)#8,262 |
| 55. | North Lakes | 0.097% | 0.84%(-0.739)#55 | 1.28%(-1.18)#8,409 |
1
2Common Questions
What are the Top 10 Cities with the Highest Percentage of Immigrants from Eastern Asia in Alaska?
Top 10 Cities with the Highest Percentage of Immigrants from Eastern Asia in Alaska are:
#1
77.53%
#2
8.54%
#3
4.63%
#4
4.50%
#5
3.41%
#6
2.51%
#7
2.47%
#8
2.45%
#9
2.39%
#10
2.16%
What city has the Highest Percentage of Immigrants from Eastern Asia in Alaska?
Alcan Border has the Highest Percentage of Immigrants from Eastern Asia in Alaska with 77.53%.
What is the Percentage of Immigrants from Eastern Asia in the State of Alaska?
Percentage of Immigrants from Eastern Asia in Alaska is 0.84%.
What is the Percentage of Immigrants from Eastern Asia in the United States?
Percentage of Immigrants from Eastern Asia in the United States is 1.28%.