Cities with the Highest Percentage of Immigrants from Eastern Asia in Georgia
RELATED REPORTS & OPTIONS
Eastern Asia
Georgia
Compare Cities
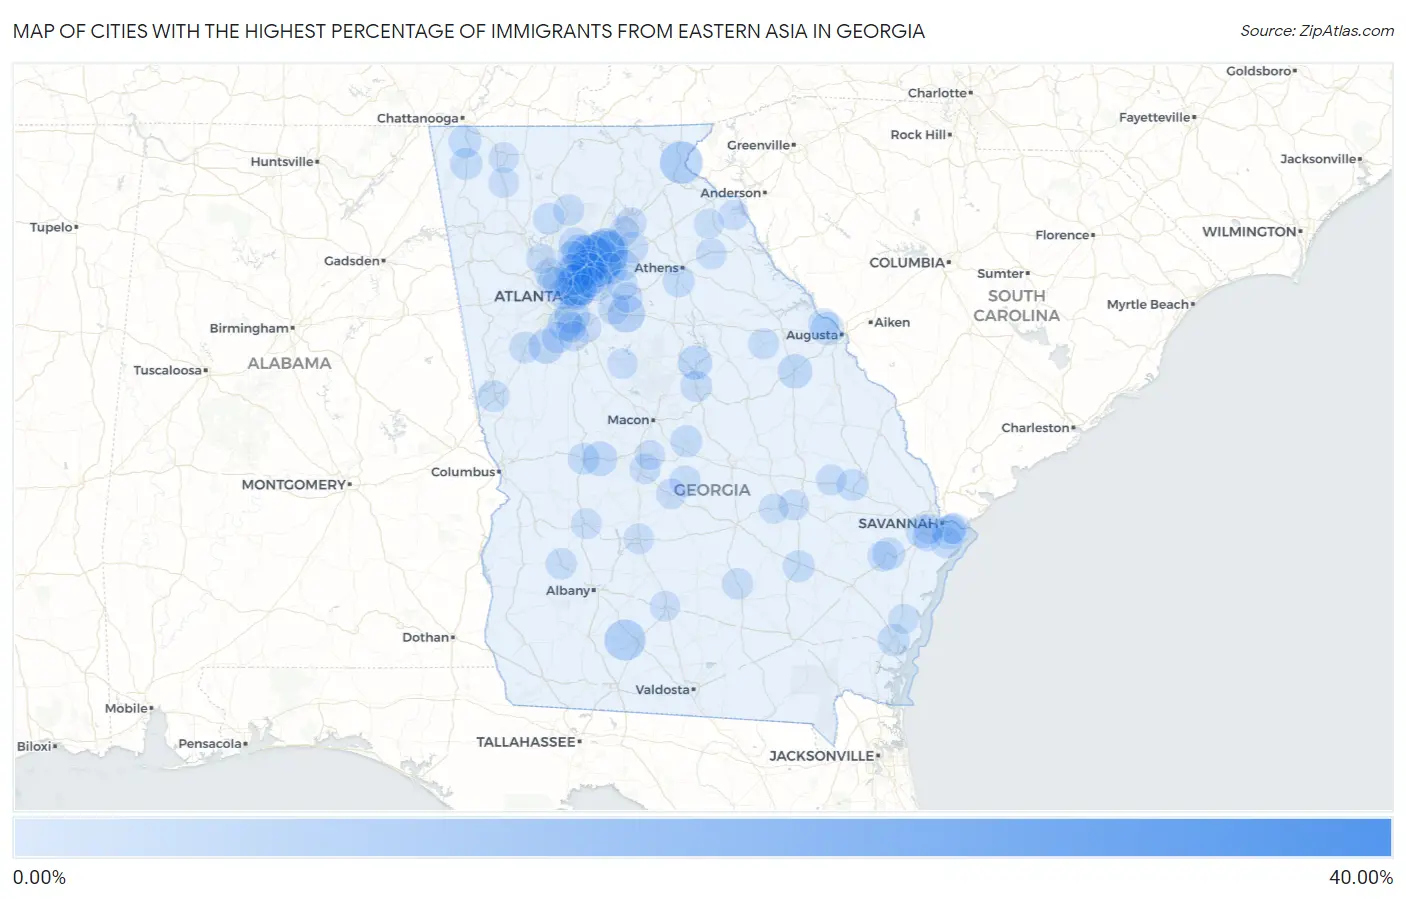
Map of Cities with the Highest Percentage of Immigrants from Eastern Asia in Georgia
0.00%
40.00%
Cities with the Highest Percentage of Immigrants from Eastern Asia in Georgia
| City | Eastern Asia | vs State | vs National | |
| 1. | Stockton | 33.88% | 0.93%(+33.0)#1 | 1.28%(+32.6)#13 |
| 2. | Duluth | 10.98% | 0.93%(+10.0)#2 | 1.28%(+9.70)#140 |
| 3. | Suwanee | 10.29% | 0.93%(+9.37)#3 | 1.28%(+9.02)#156 |
| 4. | Johns Creek | 9.07% | 0.93%(+8.15)#4 | 1.28%(+7.80)#197 |
| 5. | Tallulah Falls | 7.20% | 0.93%(+6.28)#5 | 1.28%(+5.93)#279 |
| 6. | Funston | 6.44% | 0.93%(+5.52)#6 | 1.28%(+5.17)#335 |
| 7. | Sugar Hill | 5.19% | 0.93%(+4.26)#7 | 1.28%(+3.91)#470 |
| 8. | North Druid Hills | 5.00% | 0.93%(+4.07)#8 | 1.28%(+3.72)#489 |
| 9. | Berkeley Lake | 4.87% | 0.93%(+3.94)#9 | 1.28%(+3.59)#512 |
| 10. | Oxford | 4.53% | 0.93%(+3.60)#10 | 1.28%(+3.25)#571 |
| 11. | Alpharetta | 3.82% | 0.93%(+2.89)#11 | 1.28%(+2.54)#701 |
| 12. | North Decatur | 3.64% | 0.93%(+2.72)#12 | 1.28%(+2.37)#759 |
| 13. | Peachtree Corners | 3.49% | 0.93%(+2.56)#13 | 1.28%(+2.21)#798 |
| 14. | Druid Hills | 3.44% | 0.93%(+2.51)#14 | 1.28%(+2.16)#821 |
| 15. | Lake City | 3.29% | 0.93%(+2.37)#15 | 1.28%(+2.02)#869 |
| 16. | Mountain Park | 3.17% | 0.93%(+2.25)#16 | 1.28%(+1.90)#906 |
| 17. | Peachtree City | 3.16% | 0.93%(+2.23)#17 | 1.28%(+1.88)#909 |
| 18. | Riverdale | 3.07% | 0.93%(+2.15)#18 | 1.28%(+1.80)#938 |
| 19. | Reynolds | 3.03% | 0.93%(+2.10)#19 | 1.28%(+1.75)#954 |
| 20. | Berry College | 3.01% | 0.93%(+2.08)#20 | 1.28%(+1.74)#958 |
| 21. | Dunwoody | 2.90% | 0.93%(+1.97)#21 | 1.28%(+1.62)#1,002 |
| 22. | Norcross | 2.88% | 0.93%(+1.95)#22 | 1.28%(+1.61)#1,011 |
| 23. | Wrens | 2.86% | 0.93%(+1.93)#23 | 1.28%(+1.58)#1,023 |
| 24. | Crooked Creek | 2.67% | 0.93%(+1.74)#24 | 1.28%(+1.39)#1,099 |
| 25. | Henderson | 2.46% | 0.93%(+1.54)#25 | 1.28%(+1.19)#1,201 |
| 26. | Dutch Island | 2.44% | 0.93%(+1.52)#26 | 1.28%(+1.17)#1,207 |
| 27. | Martinez | 2.27% | 0.93%(+1.35)#27 | 1.28%(+0.998)#1,304 |
| 28. | Doraville | 2.20% | 0.93%(+1.27)#28 | 1.28%(+0.922)#1,354 |
| 29. | Chickamauga | 2.01% | 0.93%(+1.09)#29 | 1.28%(+0.739)#1,478 |
| 30. | Decatur | 1.99% | 0.93%(+1.06)#30 | 1.28%(+0.710)#1,508 |
| 31. | Flemington | 1.91% | 0.93%(+0.987)#31 | 1.28%(+0.638)#1,568 |
| 32. | Chamblee | 1.84% | 0.93%(+0.918)#32 | 1.28%(+0.569)#1,623 |
| 33. | Milton | 1.80% | 0.93%(+0.874)#33 | 1.28%(+0.525)#1,672 |
| 34. | Buford | 1.71% | 0.93%(+0.780)#34 | 1.28%(+0.431)#1,767 |
| 35. | Dock Junction | 1.69% | 0.93%(+0.761)#35 | 1.28%(+0.412)#1,785 |
| 36. | Lafayette | 1.63% | 0.93%(+0.704)#36 | 1.28%(+0.355)#1,874 |
| 37. | Watkinsville | 1.57% | 0.93%(+0.641)#37 | 1.28%(+0.292)#1,936 |
| 38. | Jeffersonville | 1.55% | 0.93%(+0.623)#38 | 1.28%(+0.274)#1,955 |
| 39. | Lawrenceville | 1.51% | 0.93%(+0.586)#39 | 1.28%(+0.238)#1,993 |
| 40. | Baxley | 1.49% | 0.93%(+0.562)#40 | 1.28%(+0.213)#2,029 |
| 41. | Butler | 1.46% | 0.93%(+0.530)#41 | 1.28%(+0.181)#2,068 |
| 42. | Register | 1.44% | 0.93%(+0.508)#42 | 1.28%(+0.160)#2,104 |
| 43. | Atlanta | 1.41% | 0.93%(+0.481)#43 | 1.28%(+0.133)#2,150 |
| 44. | Kennesaw State University | 1.40% | 0.93%(+0.474)#44 | 1.28%(+0.125)#2,164 |
| 45. | Milledgeville | 1.38% | 0.93%(+0.454)#45 | 1.28%(+0.105)#2,199 |
| 46. | Newnan | 1.38% | 0.93%(+0.448)#46 | 1.28%(+0.099)#2,204 |
| 47. | Fayetteville | 1.36% | 0.93%(+0.435)#47 | 1.28%(+0.087)#2,227 |
| 48. | Lagrange | 1.34% | 0.93%(+0.414)#48 | 1.28%(+0.065)#2,263 |
| 49. | Sandy Springs | 1.31% | 0.93%(+0.382)#49 | 1.28%(+0.034)#2,311 |
| 50. | Waleska | 1.31% | 0.93%(+0.382)#50 | 1.28%(+0.033)#2,314 |
| 51. | Cochran | 1.29% | 0.93%(+0.367)#51 | 1.28%(+0.019)#2,350 |
| 52. | Skidaway Island | 1.24% | 0.93%(+0.311)#52 | 1.28%(-0.038)#2,449 |
| 53. | Brookhaven | 1.23% | 0.93%(+0.308)#53 | 1.28%(-0.041)#2,457 |
| 54. | Athens-Clarke County Unified Government (Balance) | 1.23% | 0.93%(+0.298)#54 | 1.28%(-0.050)#2,470 |
| 55. | Broxton | 1.20% | 0.93%(+0.275)#55 | 1.28%(-0.074)#2,513 |
| 56. | Dawson | 1.20% | 0.93%(+0.271)#56 | 1.28%(-0.078)#2,522 |
| 57. | Lilburn | 1.17% | 0.93%(+0.247)#57 | 1.28%(-0.102)#2,561 |
| 58. | Nelson | 1.16% | 0.93%(+0.236)#58 | 1.28%(-0.113)#2,587 |
| 59. | Conyers | 1.16% | 0.93%(+0.233)#59 | 1.28%(-0.116)#2,594 |
| 60. | Braselton | 1.13% | 0.93%(+0.203)#60 | 1.28%(-0.146)#2,648 |
| 61. | Evans | 1.12% | 0.93%(+0.189)#61 | 1.28%(-0.160)#2,679 |
| 62. | Talahi Island | 1.10% | 0.93%(+0.170)#62 | 1.28%(-0.179)#2,700 |
| 63. | Warrenton | 1.08% | 0.93%(+0.156)#63 | 1.28%(-0.193)#2,743 |
| 64. | Comer | 1.05% | 0.93%(+0.123)#64 | 1.28%(-0.226)#2,819 |
| 65. | Scottdale | 1.00% | 0.93%(+0.076)#65 | 1.28%(-0.272)#2,957 |
| 66. | Roswell | 1.00% | 0.93%(+0.071)#66 | 1.28%(-0.278)#2,976 |
| 67. | Perry | 0.94% | 0.93%(+0.018)#67 | 1.28%(-0.331)#3,130 |
| 68. | Dacula | 0.94% | 0.93%(+0.014)#68 | 1.28%(-0.334)#3,140 |
| 69. | Smyrna | 0.90% | 0.93%(-0.023)#69 | 1.28%(-0.372)#3,250 |
| 70. | Vidalia | 0.89% | 0.93%(-0.042)#70 | 1.28%(-0.390)#3,293 |
| 71. | Bemiss | 0.88% | 0.93%(-0.043)#71 | 1.28%(-0.392)#3,300 |
| 72. | Fair Oaks | 0.86% | 0.93%(-0.064)#72 | 1.28%(-0.412)#3,365 |
| 73. | Metter | 0.86% | 0.93%(-0.072)#73 | 1.28%(-0.421)#3,392 |
| 74. | Loganville | 0.83% | 0.93%(-0.094)#74 | 1.28%(-0.443)#3,468 |
| 75. | Dalton | 0.81% | 0.93%(-0.118)#75 | 1.28%(-0.467)#3,553 |
| 76. | Resaca | 0.81% | 0.93%(-0.120)#76 | 1.28%(-0.469)#3,557 |
| 77. | Walnut Grove | 0.80% | 0.93%(-0.124)#77 | 1.28%(-0.473)#3,576 |
| 78. | Tifton | 0.80% | 0.93%(-0.130)#78 | 1.28%(-0.478)#3,599 |
| 79. | Americus | 0.79% | 0.93%(-0.140)#79 | 1.28%(-0.489)#3,632 |
| 80. | Hawkinsville | 0.77% | 0.93%(-0.153)#80 | 1.28%(-0.502)#3,681 |
| 81. | Flovilla | 0.77% | 0.93%(-0.154)#81 | 1.28%(-0.503)#3,686 |
| 82. | Cordele | 0.76% | 0.93%(-0.163)#82 | 1.28%(-0.512)#3,724 |
| 83. | Whitemarsh Island | 0.75% | 0.93%(-0.176)#83 | 1.28%(-0.525)#3,788 |
| 84. | Tucker | 0.71% | 0.93%(-0.216)#84 | 1.28%(-0.565)#3,931 |
| 85. | Gainesville | 0.70% | 0.93%(-0.223)#85 | 1.28%(-0.572)#3,960 |
| 86. | Hinesville | 0.69% | 0.93%(-0.242)#86 | 1.28%(-0.590)#4,045 |
| 87. | Vinings | 0.68% | 0.93%(-0.247)#87 | 1.28%(-0.596)#4,067 |
| 88. | Stockbridge | 0.68% | 0.93%(-0.251)#88 | 1.28%(-0.600)#4,084 |
| 89. | Hartwell | 0.67% | 0.93%(-0.257)#89 | 1.28%(-0.606)#4,115 |
| 90. | Savannah | 0.64% | 0.93%(-0.286)#90 | 1.28%(-0.635)#4,246 |
| 91. | Georgetown | 0.64% | 0.93%(-0.286)#91 | 1.28%(-0.635)#4,249 |
| 92. | Bonanza | 0.63% | 0.93%(-0.295)#92 | 1.28%(-0.643)#4,280 |
| 93. | Franklin Springs | 0.58% | 0.93%(-0.350)#93 | 1.28%(-0.699)#4,542 |
| 94. | Jonesboro | 0.57% | 0.93%(-0.361)#94 | 1.28%(-0.709)#4,599 |
| 95. | Warner Robins | 0.56% | 0.93%(-0.362)#95 | 1.28%(-0.711)#4,607 |
| 96. | Darien | 0.56% | 0.93%(-0.368)#96 | 1.28%(-0.717)#4,644 |
| 97. | Echols County Consolidated Government | 0.54% | 0.93%(-0.387)#97 | 1.28%(-0.736)#4,785 |
| 98. | Kennesaw | 0.54% | 0.93%(-0.390)#98 | 1.28%(-0.739)#4,802 |
| 99. | Oakwood | 0.53% | 0.93%(-0.401)#99 | 1.28%(-0.750)#4,862 |
| 100. | Ailey | 0.51% | 0.93%(-0.412)#100 | 1.28%(-0.761)#4,934 |
Common Questions
What are the Top 10 Cities with the Highest Percentage of Immigrants from Eastern Asia in Georgia?
Top 10 Cities with the Highest Percentage of Immigrants from Eastern Asia in Georgia are:
#1
10.98%
#2
10.29%
#3
9.07%
#4
7.20%
#5
6.44%
#6
5.19%
#7
5.00%
#8
4.87%
#9
4.53%
#10
3.82%
What city has the Highest Percentage of Immigrants from Eastern Asia in Georgia?
Duluth has the Highest Percentage of Immigrants from Eastern Asia in Georgia with 10.98%.
What is the Percentage of Immigrants from Eastern Asia in the State of Georgia?
Percentage of Immigrants from Eastern Asia in Georgia is 0.93%.
What is the Percentage of Immigrants from Eastern Asia in the United States?
Percentage of Immigrants from Eastern Asia in the United States is 1.28%.