Cities with the Highest Percentage of Immigrants from Eastern Asia in North Carolina
RELATED REPORTS & OPTIONS
Eastern Asia
North Carolina
Compare Cities
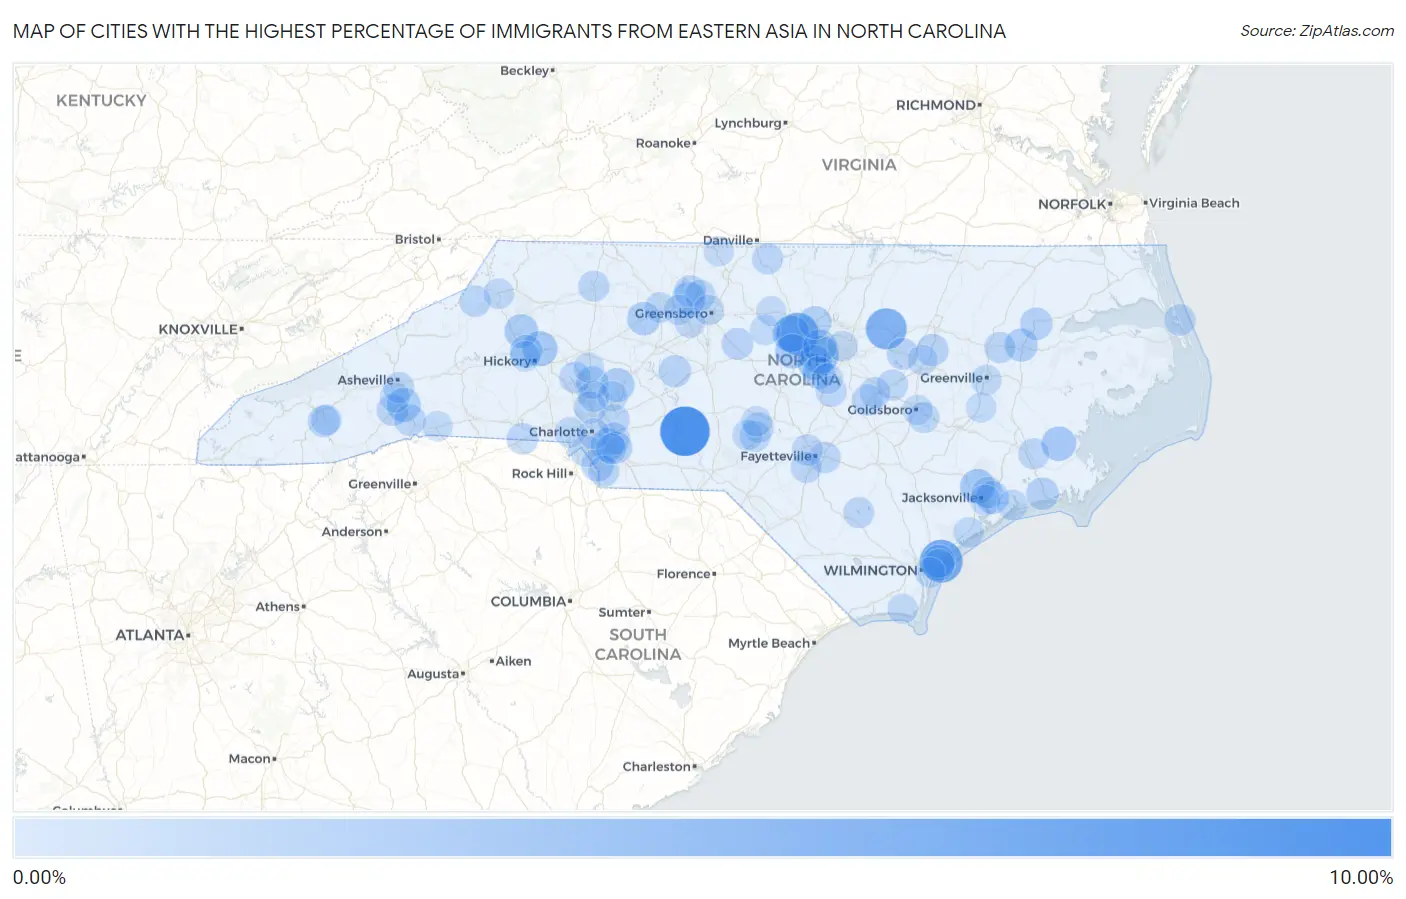
Map of Cities with the Highest Percentage of Immigrants from Eastern Asia in North Carolina
0.00%
10.00%
Cities with the Highest Percentage of Immigrants from Eastern Asia in North Carolina
| City | Eastern Asia | vs State | vs National | |
| 1. | Mount Gilead | 8.44% | 0.52%(+7.92)#1 | 1.28%(+7.16)#227 |
| 2. | Porters Neck | 5.67% | 0.52%(+5.14)#2 | 1.28%(+4.39)#410 |
| 3. | Chapel Hill | 5.27% | 0.52%(+4.74)#3 | 1.28%(+3.99)#456 |
| 4. | Bunn | 4.81% | 0.52%(+4.29)#4 | 1.28%(+3.54)#519 |
| 5. | Cary | 3.50% | 0.52%(+2.98)#5 | 1.28%(+2.23)#791 |
| 6. | Carrboro | 3.04% | 0.52%(+2.51)#6 | 1.28%(+1.76)#948 |
| 7. | Bethlehem | 2.39% | 0.52%(+1.86)#7 | 1.28%(+1.11)#1,231 |
| 8. | Apex | 2.33% | 0.52%(+1.80)#8 | 1.28%(+1.05)#1,269 |
| 9. | Half Moon | 2.30% | 0.52%(+1.78)#9 | 1.28%(+1.03)#1,287 |
| 10. | Fearrington Village | 2.21% | 0.52%(+1.68)#10 | 1.28%(+0.932)#1,342 |
| 11. | Stonewall | 2.18% | 0.52%(+1.66)#11 | 1.28%(+0.908)#1,359 |
| 12. | Landis | 1.99% | 0.52%(+1.47)#12 | 1.28%(+0.717)#1,499 |
| 13. | Fletcher | 1.98% | 0.52%(+1.45)#13 | 1.28%(+0.699)#1,516 |
| 14. | Cedar Rock | 1.96% | 0.52%(+1.43)#14 | 1.28%(+0.680)#1,532 |
| 15. | Matthews | 1.81% | 0.52%(+1.28)#15 | 1.28%(+0.531)#1,666 |
| 16. | Morrisville | 1.80% | 0.52%(+1.28)#16 | 1.28%(+0.526)#1,671 |
| 17. | Oak Ridge | 1.75% | 0.52%(+1.23)#17 | 1.28%(+0.479)#1,708 |
| 18. | Clemmons | 1.74% | 0.52%(+1.21)#18 | 1.28%(+0.463)#1,723 |
| 19. | Williamston | 1.63% | 0.52%(+1.10)#19 | 1.28%(+0.351)#1,877 |
| 20. | Bayshore | 1.60% | 0.52%(+1.07)#20 | 1.28%(+0.322)#1,903 |
| 21. | Governors | 1.59% | 0.52%(+1.06)#21 | 1.28%(+0.313)#1,916 |
| 22. | Durham | 1.52% | 0.52%(+0.996)#22 | 1.28%(+0.246)#1,987 |
| 23. | Granite Falls | 1.50% | 0.52%(+0.975)#23 | 1.28%(+0.224)#2,009 |
| 24. | Piney Green | 1.49% | 0.52%(+0.965)#24 | 1.28%(+0.214)#2,027 |
| 25. | Marvin | 1.46% | 0.52%(+0.939)#25 | 1.28%(+0.188)#2,058 |
| 26. | Briar Chapel | 1.44% | 0.52%(+0.919)#26 | 1.28%(+0.168)#2,091 |
| 27. | Mooresville | 1.41% | 0.52%(+0.882)#27 | 1.28%(+0.132)#2,151 |
| 28. | Newport | 1.41% | 0.52%(+0.882)#28 | 1.28%(+0.131)#2,153 |
| 29. | Windsor | 1.40% | 0.52%(+0.877)#29 | 1.28%(+0.127)#2,160 |
| 30. | Holly Springs | 1.37% | 0.52%(+0.843)#30 | 1.28%(+0.093)#2,214 |
| 31. | Denton | 1.30% | 0.52%(+0.776)#31 | 1.28%(+0.025)#2,335 |
| 32. | Elm City | 1.30% | 0.52%(+0.772)#32 | 1.28%(+0.021)#2,344 |
| 33. | Mint Hill | 1.28% | 0.52%(+0.753)#33 | 1.28%(+0.002)#2,383 |
| 34. | Huntersville | 1.25% | 0.52%(+0.725)#34 | 1.28%(-0.026)#2,426 |
| 35. | Hemby Bridge | 1.25% | 0.52%(+0.722)#35 | 1.28%(-0.028)#2,428 |
| 36. | Stokesdale | 1.17% | 0.52%(+0.645)#36 | 1.28%(-0.106)#2,576 |
| 37. | Forest Hills | 1.16% | 0.52%(+0.638)#37 | 1.28%(-0.113)#2,589 |
| 38. | Liberty | 1.13% | 0.52%(+0.600)#38 | 1.28%(-0.150)#2,654 |
| 39. | Bailey | 1.09% | 0.52%(+0.564)#39 | 1.28%(-0.186)#2,724 |
| 40. | Mills River | 1.08% | 0.52%(+0.560)#40 | 1.28%(-0.191)#2,733 |
| 41. | Ogden | 1.07% | 0.52%(+0.544)#41 | 1.28%(-0.207)#2,778 |
| 42. | Pineville | 1.03% | 0.52%(+0.510)#42 | 1.28%(-0.241)#2,852 |
| 43. | Barker Heights | 1.02% | 0.52%(+0.498)#43 | 1.28%(-0.253)#2,889 |
| 44. | Lake Norman Of Catawba | 1.01% | 0.52%(+0.489)#44 | 1.28%(-0.262)#2,916 |
| 45. | Grover | 1.00% | 0.52%(+0.478)#45 | 1.28%(-0.272)#2,956 |
| 46. | Banner Elk | 0.97% | 0.52%(+0.448)#46 | 1.28%(-0.303)#3,039 |
| 47. | Robersonville | 0.95% | 0.52%(+0.427)#47 | 1.28%(-0.324)#3,109 |
| 48. | Vander | 0.95% | 0.52%(+0.420)#48 | 1.28%(-0.330)#3,128 |
| 49. | Kill Devil Hills | 0.94% | 0.52%(+0.415)#49 | 1.28%(-0.335)#3,144 |
| 50. | Pumpkin Center | 0.93% | 0.52%(+0.405)#50 | 1.28%(-0.346)#3,179 |
| 51. | Harrisburg | 0.93% | 0.52%(+0.405)#51 | 1.28%(-0.346)#3,181 |
| 52. | Four Oaks | 0.93% | 0.52%(+0.401)#52 | 1.28%(-0.350)#3,192 |
| 53. | Fayetteville | 0.91% | 0.52%(+0.380)#53 | 1.28%(-0.371)#3,247 |
| 54. | Yanceyville | 0.89% | 0.52%(+0.368)#54 | 1.28%(-0.383)#3,273 |
| 55. | Davidson | 0.88% | 0.52%(+0.357)#55 | 1.28%(-0.394)#3,308 |
| 56. | Hope Mills | 0.88% | 0.52%(+0.352)#56 | 1.28%(-0.399)#3,324 |
| 57. | Cypress Landing | 0.86% | 0.52%(+0.331)#57 | 1.28%(-0.420)#3,391 |
| 58. | Angier | 0.84% | 0.52%(+0.316)#58 | 1.28%(-0.434)#3,435 |
| 59. | Micro | 0.84% | 0.52%(+0.314)#59 | 1.28%(-0.437)#3,446 |
| 60. | Southern Pines | 0.83% | 0.52%(+0.309)#60 | 1.28%(-0.441)#3,462 |
| 61. | Elroy | 0.83% | 0.52%(+0.305)#61 | 1.28%(-0.446)#3,478 |
| 62. | Smithfield | 0.82% | 0.52%(+0.299)#62 | 1.28%(-0.452)#3,488 |
| 63. | Biltmore Forest | 0.82% | 0.52%(+0.299)#63 | 1.28%(-0.452)#3,494 |
| 64. | Fairfield Harbour | 0.82% | 0.52%(+0.292)#64 | 1.28%(-0.459)#3,515 |
| 65. | White Lake | 0.80% | 0.52%(+0.277)#65 | 1.28%(-0.473)#3,577 |
| 66. | Waxhaw | 0.80% | 0.52%(+0.274)#66 | 1.28%(-0.477)#3,592 |
| 67. | Elkin | 0.79% | 0.52%(+0.270)#67 | 1.28%(-0.481)#3,607 |
| 68. | Summerfield | 0.78% | 0.52%(+0.258)#68 | 1.28%(-0.493)#3,644 |
| 69. | Charlotte | 0.77% | 0.52%(+0.246)#69 | 1.28%(-0.505)#3,699 |
| 70. | Belmont | 0.75% | 0.52%(+0.230)#70 | 1.28%(-0.521)#3,771 |
| 71. | Winston Salem | 0.73% | 0.52%(+0.207)#71 | 1.28%(-0.544)#3,860 |
| 72. | High Point | 0.71% | 0.52%(+0.187)#72 | 1.28%(-0.564)#3,930 |
| 73. | Holly Ridge | 0.71% | 0.52%(+0.183)#73 | 1.28%(-0.567)#3,937 |
| 74. | Cullowhee | 0.70% | 0.52%(+0.175)#74 | 1.28%(-0.576)#3,980 |
| 75. | Greenville | 0.70% | 0.52%(+0.170)#75 | 1.28%(-0.581)#3,996 |
| 76. | Stallings | 0.69% | 0.52%(+0.167)#76 | 1.28%(-0.584)#4,014 |
| 77. | Jacksonville | 0.68% | 0.52%(+0.151)#77 | 1.28%(-0.600)#4,083 |
| 78. | Whispering Pines | 0.67% | 0.52%(+0.143)#78 | 1.28%(-0.607)#4,126 |
| 79. | Swansboro | 0.67% | 0.52%(+0.140)#79 | 1.28%(-0.611)#4,139 |
| 80. | Fuquay Varina | 0.65% | 0.52%(+0.124)#80 | 1.28%(-0.626)#4,212 |
| 81. | Pinehurst | 0.65% | 0.52%(+0.121)#81 | 1.28%(-0.630)#4,223 |
| 82. | Greensboro | 0.64% | 0.52%(+0.115)#82 | 1.28%(-0.636)#4,252 |
| 83. | Boone | 0.64% | 0.52%(+0.110)#83 | 1.28%(-0.641)#4,268 |
| 84. | Anderson Creek | 0.63% | 0.52%(+0.105)#84 | 1.28%(-0.646)#4,294 |
| 85. | Avery Creek | 0.60% | 0.52%(+0.074)#85 | 1.28%(-0.677)#4,435 |
| 86. | Raleigh | 0.60% | 0.52%(+0.074)#86 | 1.28%(-0.677)#4,436 |
| 87. | Goldsboro | 0.59% | 0.52%(+0.068)#87 | 1.28%(-0.683)#4,468 |
| 88. | Saxapahaw | 0.58% | 0.52%(+0.058)#88 | 1.28%(-0.692)#4,513 |
| 89. | Carthage | 0.58% | 0.52%(+0.051)#89 | 1.28%(-0.700)#4,545 |
| 90. | Kernersville | 0.56% | 0.52%(+0.034)#90 | 1.28%(-0.716)#4,639 |
| 91. | Rhodhiss | 0.56% | 0.52%(+0.034)#91 | 1.28%(-0.717)#4,645 |
| 92. | Wilmington | 0.56% | 0.52%(+0.030)#92 | 1.28%(-0.721)#4,672 |
| 93. | Columbus | 0.55% | 0.52%(+0.027)#93 | 1.28%(-0.724)#4,689 |
| 94. | Kannapolis | 0.54% | 0.52%(+0.019)#94 | 1.28%(-0.732)#4,752 |
| 95. | Troutman | 0.54% | 0.52%(+0.017)#95 | 1.28%(-0.734)#4,767 |
| 96. | Grifton | 0.52% | 0.52%(-0.002)#96 | 1.28%(-0.753)#4,883 |
| 97. | Wilson | 0.51% | 0.52%(-0.010)#97 | 1.28%(-0.761)#4,929 |
| 98. | St James | 0.50% | 0.52%(-0.022)#98 | 1.28%(-0.773)#5,003 |
| 99. | Mebane | 0.49% | 0.52%(-0.033)#99 | 1.28%(-0.784)#5,075 |
| 100. | Eden | 0.49% | 0.52%(-0.036)#100 | 1.28%(-0.787)#5,102 |
Common Questions
What are the Top 10 Cities with the Highest Percentage of Immigrants from Eastern Asia in North Carolina?
Top 10 Cities with the Highest Percentage of Immigrants from Eastern Asia in North Carolina are:
#1
8.44%
#2
5.67%
#3
5.27%
#4
4.81%
#5
3.50%
#6
3.04%
#7
2.39%
#8
2.33%
#9
2.30%
#10
2.21%
What city has the Highest Percentage of Immigrants from Eastern Asia in North Carolina?
Mount Gilead has the Highest Percentage of Immigrants from Eastern Asia in North Carolina with 8.44%.
What is the Percentage of Immigrants from Eastern Asia in the State of North Carolina?
Percentage of Immigrants from Eastern Asia in North Carolina is 0.52%.
What is the Percentage of Immigrants from Eastern Asia in the United States?
Percentage of Immigrants from Eastern Asia in the United States is 1.28%.