Cities with the Highest Percentage of Immigrants from Eastern Asia in North Dakota
RELATED REPORTS & OPTIONS
Eastern Asia
North Dakota
Compare Cities
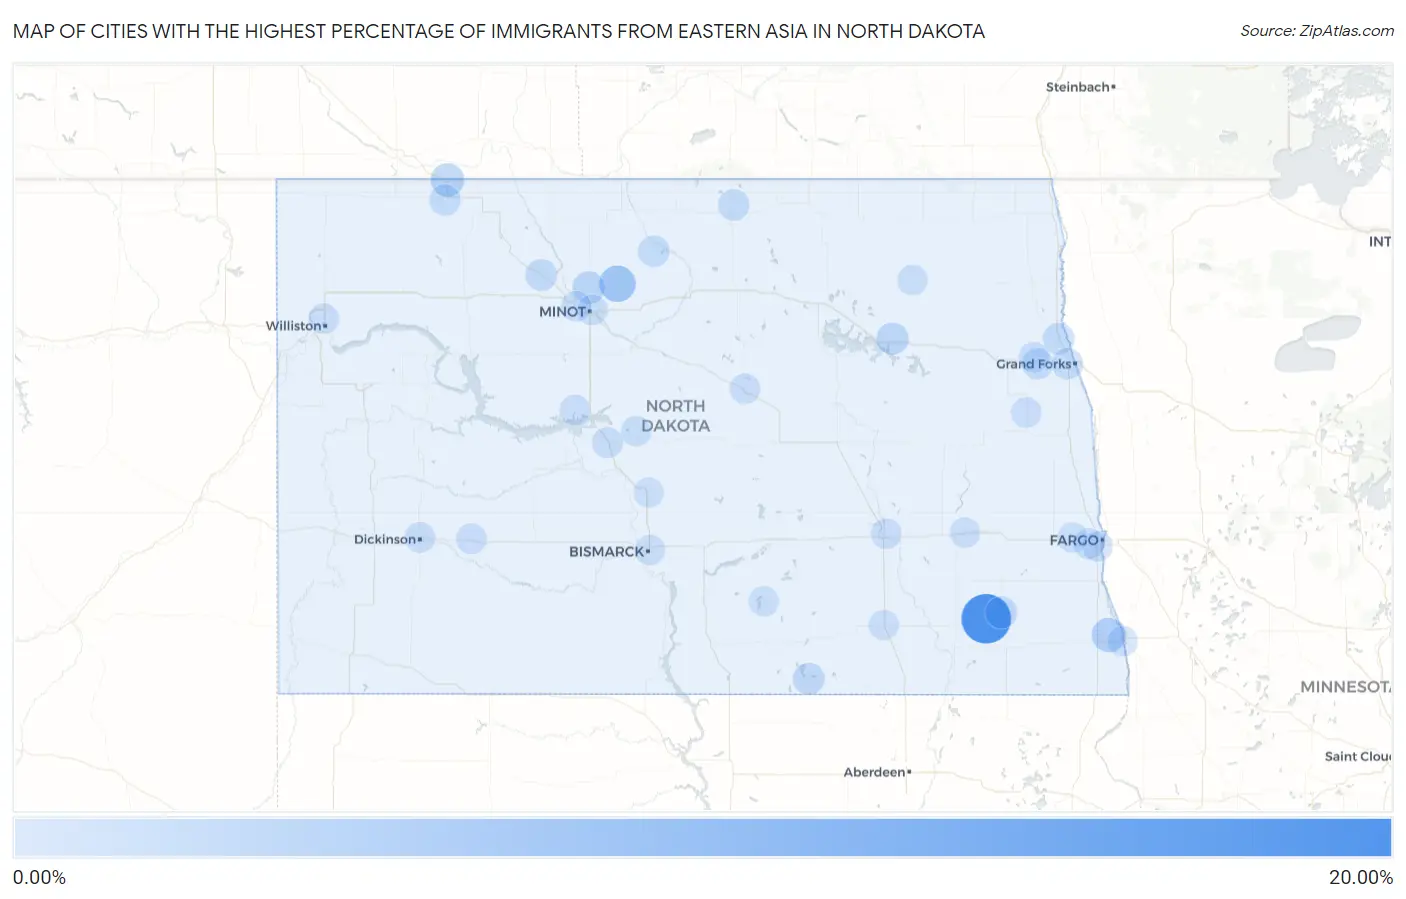
Map of Cities with the Highest Percentage of Immigrants from Eastern Asia in North Dakota
0.00%
20.00%
Cities with the Highest Percentage of Immigrants from Eastern Asia in North Dakota
| City | Eastern Asia | vs State | vs National | |
| 1. | Elliott | 18.92% | 0.27%(+18.7)#1 | 1.28%(+17.6)#54 |
| 2. | Deering | 5.88% | 0.27%(+5.62)#2 | 1.28%(+4.61)#385 |
| 3. | Dwight | 3.70% | 0.27%(+3.44)#3 | 1.28%(+2.43)#740 |
| 4. | Portal | 3.08% | 0.27%(+2.81)#4 | 1.28%(+1.80)#936 |
| 5. | Ruthville | 2.11% | 0.27%(+1.85)#5 | 1.28%(+0.837)#1,409 |
| 6. | Crary | 1.87% | 0.27%(+1.60)#6 | 1.28%(+0.593)#1,604 |
| 7. | Apple Valley | 1.82% | 0.27%(+1.56)#7 | 1.28%(+0.549)#1,648 |
| 8. | Lisbon | 1.71% | 0.27%(+1.45)#8 | 1.28%(+0.438)#1,755 |
| 9. | Ashley | 1.47% | 0.27%(+1.20)#9 | 1.28%(+0.190)#2,055 |
| 10. | Carpio | 1.37% | 0.27%(+1.10)#10 | 1.28%(+0.094)#2,213 |
| 11. | Manvel | 1.20% | 0.27%(+0.933)#11 | 1.28%(-0.077)#2,520 |
| 12. | Upham | 1.09% | 0.27%(+0.826)#12 | 1.28%(-0.183)#2,715 |
| 13. | East Dunseith | 1.09% | 0.27%(+0.823)#13 | 1.28%(-0.186)#2,725 |
| 14. | Lignite | 1.00% | 0.27%(+0.734)#14 | 1.28%(-0.276)#2,970 |
| 15. | Emerado | 0.96% | 0.27%(+0.695)#15 | 1.28%(-0.314)#3,071 |
| 16. | Grand Forks | 0.87% | 0.27%(+0.601)#16 | 1.28%(-0.409)#3,350 |
| 17. | West Fargo | 0.61% | 0.27%(+0.344)#17 | 1.28%(-0.665)#4,377 |
| 18. | Underwood | 0.55% | 0.27%(+0.280)#18 | 1.28%(-0.729)#4,733 |
| 19. | Garrison | 0.46% | 0.27%(+0.193)#19 | 1.28%(-0.816)#5,269 |
| 20. | Grand Forks Afb | 0.43% | 0.27%(+0.159)#20 | 1.28%(-0.850)#5,526 |
| 21. | Fargo | 0.42% | 0.27%(+0.158)#21 | 1.28%(-0.851)#5,538 |
| 22. | Dickinson | 0.42% | 0.27%(+0.152)#22 | 1.28%(-0.858)#5,593 |
| 23. | Richardton | 0.39% | 0.27%(+0.124)#23 | 1.28%(-0.885)#5,805 |
| 24. | Williston | 0.37% | 0.27%(+0.101)#24 | 1.28%(-0.909)#5,975 |
| 25. | Minot | 0.35% | 0.27%(+0.079)#25 | 1.28%(-0.930)#6,131 |
| 26. | Jamestown | 0.34% | 0.27%(+0.074)#26 | 1.28%(-0.935)#6,164 |
| 27. | Harvey | 0.34% | 0.27%(+0.073)#27 | 1.28%(-0.936)#6,176 |
| 28. | Edmore | 0.34% | 0.27%(+0.071)#28 | 1.28%(-0.938)#6,186 |
| 29. | Hatton | 0.31% | 0.27%(+0.045)#29 | 1.28%(-0.964)#6,421 |
| 30. | Wahpeton | 0.26% | 0.27%(-0.003)#30 | 1.28%(-1.01)#6,830 |
| 31. | Burlington | 0.23% | 0.27%(-0.037)#31 | 1.28%(-1.05)#7,158 |
| 32. | Turtle Lake | 0.20% | 0.27%(-0.068)#32 | 1.28%(-1.08)#7,427 |
| 33. | Valley City | 0.17% | 0.27%(-0.099)#33 | 1.28%(-1.11)#7,757 |
| 34. | Wilton | 0.15% | 0.27%(-0.118)#34 | 1.28%(-1.13)#7,943 |
| 35. | Edgeley | 0.15% | 0.27%(-0.119)#35 | 1.28%(-1.13)#7,950 |
| 36. | Bismarck | 0.13% | 0.27%(-0.140)#36 | 1.28%(-1.15)#8,144 |
| 37. | Napoleon | 0.12% | 0.27%(-0.143)#37 | 1.28%(-1.15)#8,169 |
| 38. | Mapleton | 0.087% | 0.27%(-0.180)#38 | 1.28%(-1.19)#8,494 |
Common Questions
What are the Top 10 Cities with the Highest Percentage of Immigrants from Eastern Asia in North Dakota?
Top 10 Cities with the Highest Percentage of Immigrants from Eastern Asia in North Dakota are:
What city has the Highest Percentage of Immigrants from Eastern Asia in North Dakota?
Elliott has the Highest Percentage of Immigrants from Eastern Asia in North Dakota with 18.92%.
What is the Percentage of Immigrants from Eastern Asia in the State of North Dakota?
Percentage of Immigrants from Eastern Asia in North Dakota is 0.27%.
What is the Percentage of Immigrants from Eastern Asia in the United States?
Percentage of Immigrants from Eastern Asia in the United States is 1.28%.