Cities with the Highest Percentage of Immigrants from Eastern Asia in South Carolina
RELATED REPORTS & OPTIONS
Eastern Asia
South Carolina
Compare Cities
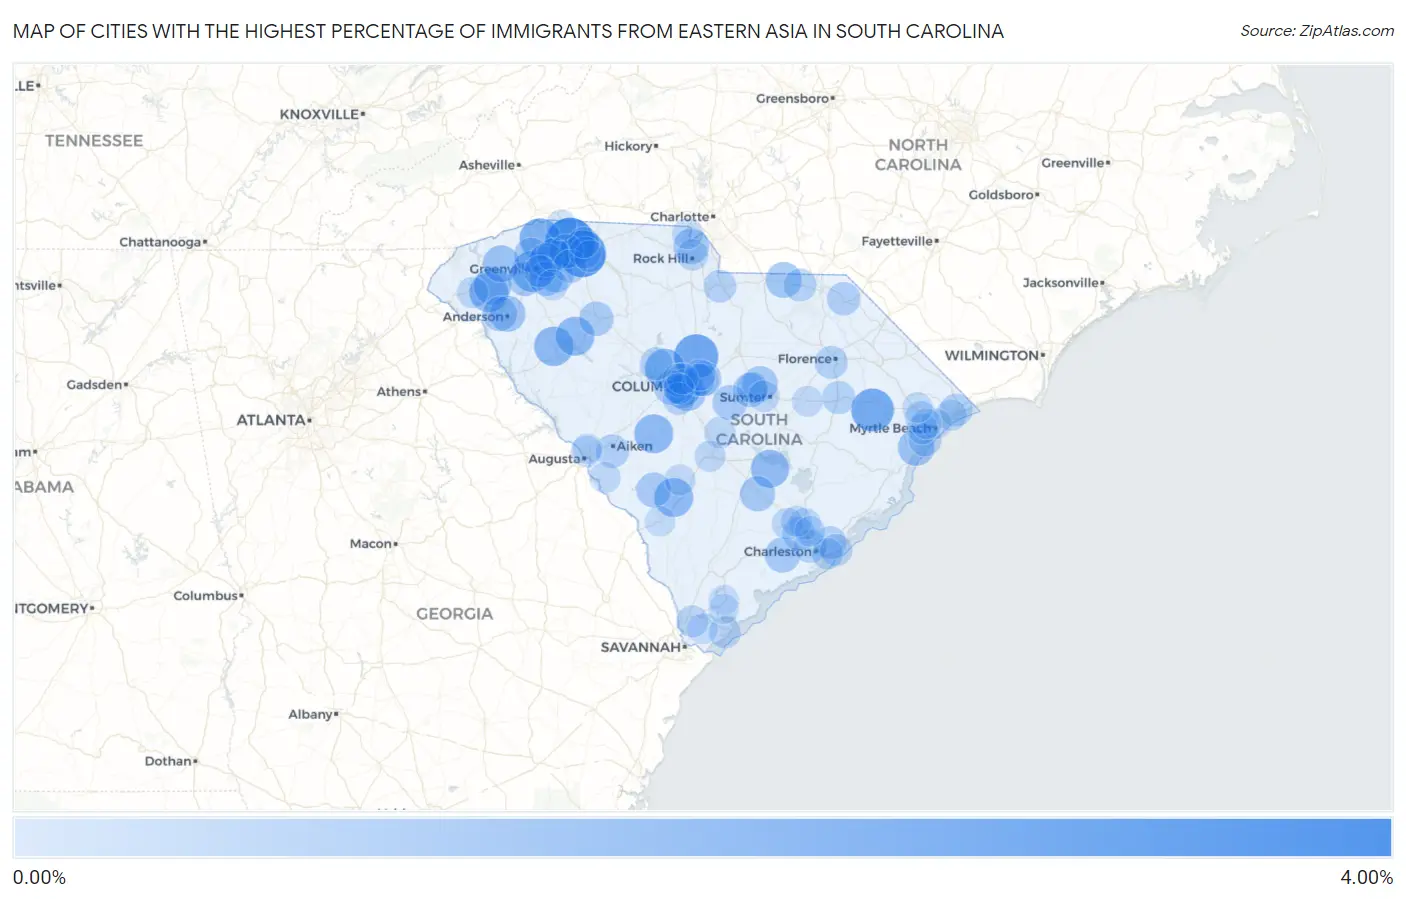
Map of Cities with the Highest Percentage of Immigrants from Eastern Asia in South Carolina
0.00%
4.00%
Cities with the Highest Percentage of Immigrants from Eastern Asia in South Carolina
| City | Eastern Asia | vs State | vs National | |
| 1. | Inman Mills | 3.56% | 0.33%(+3.22)#1 | 1.28%(+2.28)#782 |
| 2. | Arthurtown | 3.49% | 0.33%(+3.16)#2 | 1.28%(+2.22)#796 |
| 3. | Arcadia | 3.09% | 0.33%(+2.76)#3 | 1.28%(+1.82)#927 |
| 4. | Blythewood | 2.58% | 0.33%(+2.24)#4 | 1.28%(+1.30)#1,147 |
| 5. | Johnsonville | 2.35% | 0.33%(+2.01)#5 | 1.28%(+1.07)#1,258 |
| 6. | Tigerville | 2.03% | 0.33%(+1.69)#6 | 1.28%(+0.751)#1,468 |
| 7. | Judson | 2.02% | 0.33%(+1.69)#7 | 1.28%(+0.747)#1,469 |
| 8. | Lake Murray Of Richland | 1.85% | 0.33%(+1.52)#8 | 1.28%(+0.576)#1,617 |
| 9. | Hodges | 1.73% | 0.33%(+1.40)#9 | 1.28%(+0.458)#1,728 |
| 10. | Olar | 1.68% | 0.33%(+1.34)#10 | 1.28%(+0.400)#1,803 |
| 11. | Clemson | 1.67% | 0.33%(+1.34)#11 | 1.28%(+0.399)#1,805 |
| 12. | Wagener | 1.65% | 0.33%(+1.32)#12 | 1.28%(+0.375)#1,835 |
| 13. | Waterloo | 1.64% | 0.33%(+1.30)#13 | 1.28%(+0.364)#1,856 |
| 14. | Eutawville | 1.52% | 0.33%(+1.18)#14 | 1.28%(+0.239)#1,990 |
| 15. | Central | 1.40% | 0.33%(+1.07)#15 | 1.28%(+0.128)#2,155 |
| 16. | Cayce | 1.31% | 0.33%(+0.974)#16 | 1.28%(+0.033)#2,315 |
| 17. | Pickens | 1.30% | 0.33%(+0.969)#17 | 1.28%(+0.028)#2,324 |
| 18. | Murrells Inlet | 1.26% | 0.33%(+0.928)#18 | 1.28%(-0.013)#2,410 |
| 19. | West Columbia | 1.21% | 0.33%(+0.874)#19 | 1.28%(-0.067)#2,498 |
| 20. | Anderson | 1.16% | 0.33%(+0.824)#20 | 1.28%(-0.117)#2,599 |
| 21. | Mount Croghan | 1.13% | 0.33%(+0.795)#21 | 1.28%(-0.146)#2,649 |
| 22. | India Hook | 1.09% | 0.33%(+0.760)#22 | 1.28%(-0.181)#2,711 |
| 23. | Fripp Island | 1.04% | 0.33%(+0.708)#23 | 1.28%(-0.233)#2,839 |
| 24. | Dalzell | 1.02% | 0.33%(+0.690)#24 | 1.28%(-0.251)#2,883 |
| 25. | Harleyville | 1.02% | 0.33%(+0.689)#25 | 1.28%(-0.252)#2,886 |
| 26. | Hollywood | 1.02% | 0.33%(+0.684)#26 | 1.28%(-0.257)#2,901 |
| 27. | Woodfield | 1.00% | 0.33%(+0.669)#27 | 1.28%(-0.272)#2,954 |
| 28. | Five Forks | 0.98% | 0.33%(+0.644)#28 | 1.28%(-0.297)#3,022 |
| 29. | Eastover | 0.97% | 0.33%(+0.639)#29 | 1.28%(-0.302)#3,034 |
| 30. | Barnwell | 0.97% | 0.33%(+0.635)#30 | 1.28%(-0.306)#3,050 |
| 31. | Centerville | 0.96% | 0.33%(+0.621)#31 | 1.28%(-0.320)#3,092 |
| 32. | Wade Hampton | 0.96% | 0.33%(+0.621)#32 | 1.28%(-0.320)#3,093 |
| 33. | Powdersville | 0.96% | 0.33%(+0.621)#33 | 1.28%(-0.320)#3,098 |
| 34. | Travelers Rest | 0.92% | 0.33%(+0.586)#34 | 1.28%(-0.355)#3,209 |
| 35. | Clinton | 0.89% | 0.33%(+0.557)#35 | 1.28%(-0.384)#3,275 |
| 36. | Springdale | 0.89% | 0.33%(+0.551)#36 | 1.28%(-0.390)#3,292 |
| 37. | Lexington | 0.88% | 0.33%(+0.548)#37 | 1.28%(-0.393)#3,304 |
| 38. | Mauldin | 0.87% | 0.33%(+0.540)#38 | 1.28%(-0.401)#3,329 |
| 39. | Stateburg | 0.86% | 0.33%(+0.528)#39 | 1.28%(-0.413)#3,369 |
| 40. | Lyman | 0.84% | 0.33%(+0.502)#40 | 1.28%(-0.439)#3,454 |
| 41. | Taylors | 0.82% | 0.33%(+0.483)#41 | 1.28%(-0.458)#3,511 |
| 42. | Baxter | 0.79% | 0.33%(+0.457)#42 | 1.28%(-0.484)#3,620 |
| 43. | Greer | 0.77% | 0.33%(+0.433)#43 | 1.28%(-0.508)#3,710 |
| 44. | Bennettsville | 0.72% | 0.33%(+0.382)#44 | 1.28%(-0.559)#3,913 |
| 45. | Aiken | 0.71% | 0.33%(+0.374)#45 | 1.28%(-0.567)#3,936 |
| 46. | Reidville | 0.69% | 0.33%(+0.357)#46 | 1.28%(-0.584)#4,009 |
| 47. | North Charleston | 0.67% | 0.33%(+0.337)#47 | 1.28%(-0.604)#4,111 |
| 48. | Scranton | 0.67% | 0.33%(+0.334)#48 | 1.28%(-0.607)#4,121 |
| 49. | Charleston | 0.67% | 0.33%(+0.331)#49 | 1.28%(-0.609)#4,133 |
| 50. | Seven Oaks | 0.66% | 0.33%(+0.329)#50 | 1.28%(-0.612)#4,144 |
| 51. | Florence | 0.66% | 0.33%(+0.326)#51 | 1.28%(-0.615)#4,156 |
| 52. | Chapin | 0.65% | 0.33%(+0.313)#52 | 1.28%(-0.628)#4,214 |
| 53. | Chesterfield | 0.63% | 0.33%(+0.297)#53 | 1.28%(-0.644)#4,281 |
| 54. | North Myrtle Beach | 0.63% | 0.33%(+0.297)#54 | 1.28%(-0.644)#4,284 |
| 55. | Surfside Beach | 0.60% | 0.33%(+0.264)#55 | 1.28%(-0.677)#4,442 |
| 56. | Lancaster | 0.59% | 0.33%(+0.259)#56 | 1.28%(-0.682)#4,464 |
| 57. | Mount Pleasant | 0.58% | 0.33%(+0.250)#57 | 1.28%(-0.691)#4,505 |
| 58. | Red Hill | 0.58% | 0.33%(+0.249)#58 | 1.28%(-0.692)#4,511 |
| 59. | Columbia | 0.55% | 0.33%(+0.214)#59 | 1.28%(-0.727)#4,718 |
| 60. | South Congaree | 0.53% | 0.33%(+0.197)#60 | 1.28%(-0.744)#4,828 |
| 61. | Forest Acres | 0.52% | 0.33%(+0.188)#61 | 1.28%(-0.753)#4,885 |
| 62. | Capitol View | 0.52% | 0.33%(+0.181)#62 | 1.28%(-0.760)#4,923 |
| 63. | Isle Of Palms | 0.51% | 0.33%(+0.171)#63 | 1.28%(-0.770)#4,983 |
| 64. | Greenville | 0.48% | 0.33%(+0.145)#64 | 1.28%(-0.796)#5,151 |
| 65. | Saxon | 0.48% | 0.33%(+0.145)#65 | 1.28%(-0.796)#5,157 |
| 66. | Hilton Head Island | 0.46% | 0.33%(+0.127)#66 | 1.28%(-0.814)#5,256 |
| 67. | Hardeeville | 0.46% | 0.33%(+0.125)#67 | 1.28%(-0.816)#5,267 |
| 68. | Goose Creek | 0.42% | 0.33%(+0.084)#68 | 1.28%(-0.857)#5,584 |
| 69. | Spartanburg | 0.42% | 0.33%(+0.083)#69 | 1.28%(-0.858)#5,595 |
| 70. | Oakland | 0.42% | 0.33%(+0.083)#70 | 1.28%(-0.858)#5,599 |
| 71. | St Matthews | 0.41% | 0.33%(+0.079)#71 | 1.28%(-0.862)#5,623 |
| 72. | Sumter | 0.41% | 0.33%(+0.077)#72 | 1.28%(-0.864)#5,648 |
| 73. | Summerville | 0.40% | 0.33%(+0.067)#73 | 1.28%(-0.874)#5,727 |
| 74. | Rock Hill | 0.39% | 0.33%(+0.056)#74 | 1.28%(-0.885)#5,798 |
| 75. | Sullivan S Island | 0.39% | 0.33%(+0.054)#75 | 1.28%(-0.887)#5,823 |
| 76. | Dentsville | 0.35% | 0.33%(+0.019)#76 | 1.28%(-0.922)#6,071 |
| 77. | Briarcliffe Acres | 0.35% | 0.33%(+0.017)#77 | 1.28%(-0.924)#6,078 |
| 78. | St Andrews | 0.35% | 0.33%(+0.012)#78 | 1.28%(-0.929)#6,122 |
| 79. | Seneca | 0.34% | 0.33%(+0.005)#79 | 1.28%(-0.936)#6,175 |
| 80. | Orangeburg | 0.33% | 0.33%(-0.002)#80 | 1.28%(-0.943)#6,231 |
| 81. | Boiling Springs | 0.33% | 0.33%(-0.004)#81 | 1.28%(-0.945)#6,252 |
| 82. | Socastee | 0.33% | 0.33%(-0.008)#82 | 1.28%(-0.949)#6,281 |
| 83. | Lake Wylie | 0.33% | 0.33%(-0.008)#83 | 1.28%(-0.949)#6,283 |
| 84. | Simpsonville | 0.32% | 0.33%(-0.016)#84 | 1.28%(-0.957)#6,360 |
| 85. | Jackson | 0.32% | 0.33%(-0.016)#85 | 1.28%(-0.957)#6,364 |
| 86. | Denmark | 0.32% | 0.33%(-0.018)#86 | 1.28%(-0.959)#6,375 |
| 87. | North Augusta | 0.29% | 0.33%(-0.040)#87 | 1.28%(-0.981)#6,565 |
| 88. | Ladson | 0.29% | 0.33%(-0.041)#88 | 1.28%(-0.982)#6,574 |
| 89. | Turbeville | 0.28% | 0.33%(-0.053)#89 | 1.28%(-0.994)#6,668 |
| 90. | Oak Grove | 0.27% | 0.33%(-0.062)#90 | 1.28%(-1.00)#6,757 |
| 91. | Bluffton | 0.26% | 0.33%(-0.076)#91 | 1.28%(-1.02)#6,862 |
| 92. | Landrum | 0.24% | 0.33%(-0.095)#92 | 1.28%(-1.04)#7,049 |
| 93. | Myrtle Beach | 0.23% | 0.33%(-0.105)#93 | 1.28%(-1.05)#7,152 |
| 94. | Allendale | 0.22% | 0.33%(-0.113)#94 | 1.28%(-1.05)#7,213 |
| 95. | Hanahan | 0.22% | 0.33%(-0.118)#95 | 1.28%(-1.06)#7,258 |
| 96. | Forestbrook | 0.22% | 0.33%(-0.119)#96 | 1.28%(-1.06)#7,272 |
| 97. | Conway | 0.21% | 0.33%(-0.120)#97 | 1.28%(-1.06)#7,280 |
| 98. | Burton | 0.20% | 0.33%(-0.137)#98 | 1.28%(-1.08)#7,440 |
| 99. | Port Royal | 0.19% | 0.33%(-0.143)#99 | 1.28%(-1.08)#7,497 |
| 100. | Belvedere | 0.17% | 0.33%(-0.162)#100 | 1.28%(-1.10)#7,701 |
Common Questions
What are the Top 10 Cities with the Highest Percentage of Immigrants from Eastern Asia in South Carolina?
Top 10 Cities with the Highest Percentage of Immigrants from Eastern Asia in South Carolina are:
#1
3.56%
#2
3.09%
#3
2.58%
#4
2.35%
#5
2.03%
#6
2.02%
#7
1.85%
#8
1.73%
#9
1.68%
#10
1.67%
What city has the Highest Percentage of Immigrants from Eastern Asia in South Carolina?
Inman Mills has the Highest Percentage of Immigrants from Eastern Asia in South Carolina with 3.56%.
What is the Percentage of Immigrants from Eastern Asia in the State of South Carolina?
Percentage of Immigrants from Eastern Asia in South Carolina is 0.33%.
What is the Percentage of Immigrants from Eastern Asia in the United States?
Percentage of Immigrants from Eastern Asia in the United States is 1.28%.