Cities with the Highest Percentage of Immigrants from Eastern Asia in New York
RELATED REPORTS & OPTIONS
Eastern Asia
New York
Compare Cities
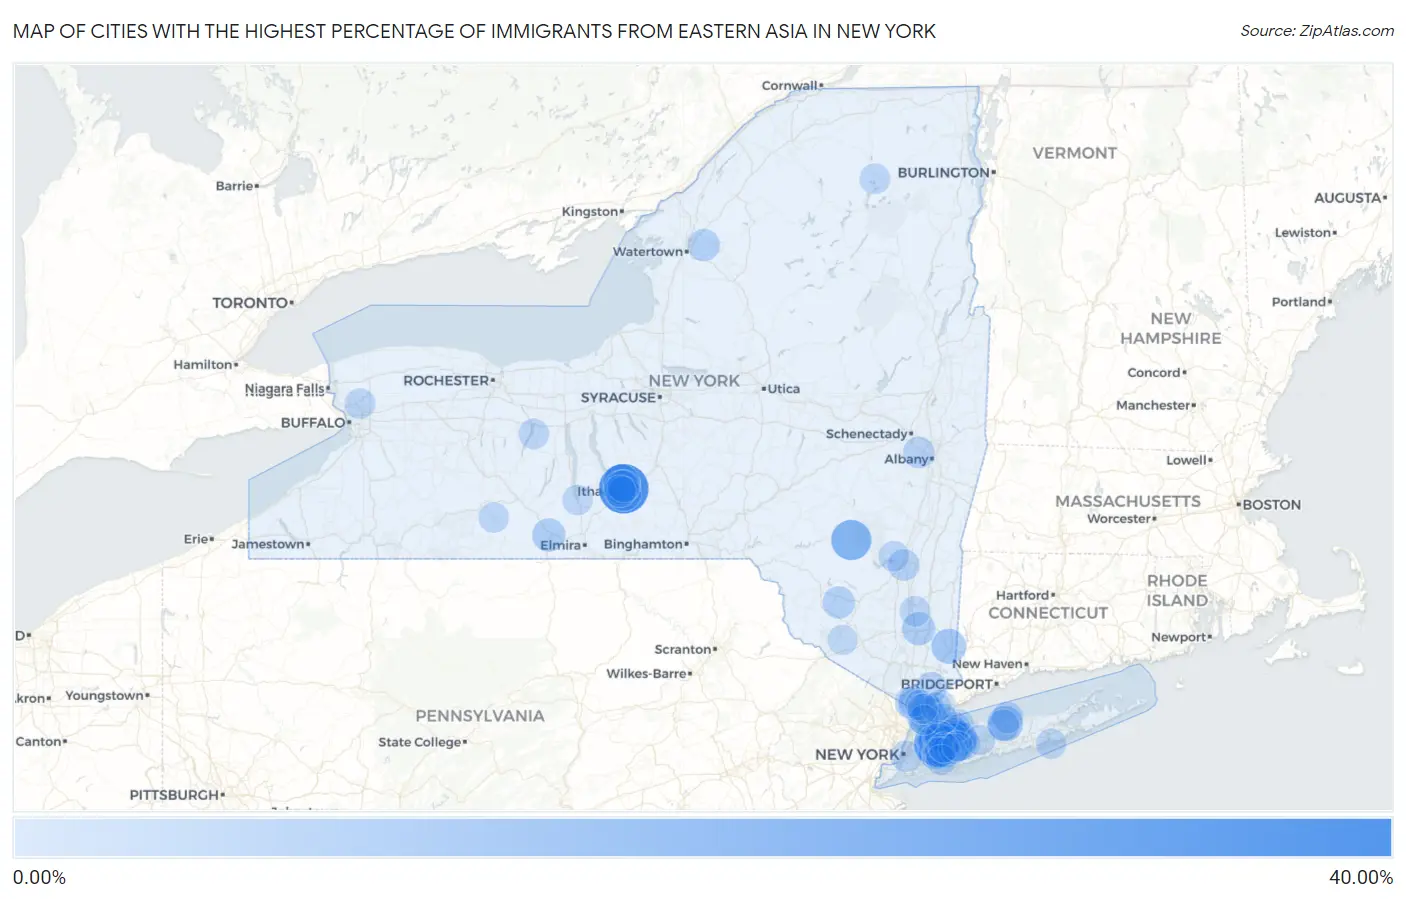
Map of Cities with the Highest Percentage of Immigrants from Eastern Asia in New York
0.00%
40.00%
Cities with the Highest Percentage of Immigrants from Eastern Asia in New York
| City | Eastern Asia | vs State | vs National | |
| 1. | Forest Home | 39.39% | 2.98%(+36.4)#1 | 1.28%(+38.1)#8 |
| 2. | Great Neck Gardens | 26.95% | 2.98%(+24.0)#2 | 1.28%(+25.7)#28 |
| 3. | Russell Gardens | 24.73% | 2.98%(+21.8)#3 | 1.28%(+23.5)#30 |
| 4. | University Gardens | 22.94% | 2.98%(+20.0)#4 | 1.28%(+21.7)#35 |
| 5. | Lake Success | 22.80% | 2.98%(+19.8)#5 | 1.28%(+21.5)#37 |
| 6. | Pine Hill | 21.67% | 2.98%(+18.7)#6 | 1.28%(+20.4)#39 |
| 7. | Jericho | 19.83% | 2.98%(+16.9)#7 | 1.28%(+18.6)#48 |
| 8. | Thomaston | 19.64% | 2.98%(+16.7)#8 | 1.28%(+18.4)#50 |
| 9. | Lansing | 14.74% | 2.98%(+11.8)#9 | 1.28%(+13.5)#77 |
| 10. | Greenvale | 14.43% | 2.98%(+11.5)#10 | 1.28%(+13.2)#78 |
| 11. | Searingtown | 14.19% | 2.98%(+11.2)#11 | 1.28%(+12.9)#80 |
| 12. | Stony Brook University | 13.04% | 2.98%(+10.1)#12 | 1.28%(+11.8)#97 |
| 13. | Brewster Hill | 11.92% | 2.98%(+8.94)#13 | 1.28%(+10.6)#112 |
| 14. | Greenville Cdp Westchester County | 11.84% | 2.98%(+8.86)#14 | 1.28%(+10.6)#115 |
| 15. | Kensington | 11.56% | 2.98%(+8.58)#15 | 1.28%(+10.3)#123 |
| 16. | North Hills | 11.52% | 2.98%(+8.54)#16 | 1.28%(+10.2)#125 |
| 17. | Syosset | 11.27% | 2.98%(+8.29)#17 | 1.28%(+9.99)#131 |
| 18. | Great Neck Estates | 11.24% | 2.98%(+8.26)#18 | 1.28%(+9.96)#134 |
| 19. | Millwood | 11.21% | 2.98%(+8.23)#19 | 1.28%(+9.93)#137 |
| 20. | Cayuga Heights | 10.88% | 2.98%(+7.90)#20 | 1.28%(+9.60)#143 |
| 21. | East Ithaca | 10.87% | 2.98%(+7.89)#21 | 1.28%(+9.59)#144 |
| 22. | Herricks | 10.77% | 2.98%(+7.79)#22 | 1.28%(+9.49)#145 |
| 23. | Garden City Park | 10.14% | 2.98%(+7.16)#23 | 1.28%(+8.86)#162 |
| 24. | Manhasset Hills | 9.50% | 2.98%(+6.53)#24 | 1.28%(+8.23)#177 |
| 25. | Great Neck Plaza | 9.47% | 2.98%(+6.49)#25 | 1.28%(+8.20)#178 |
| 26. | Bellerose Terrace | 9.27% | 2.98%(+6.30)#26 | 1.28%(+8.00)#186 |
| 27. | Tuckahoe | 9.18% | 2.98%(+6.20)#27 | 1.28%(+7.90)#193 |
| 28. | Varna | 8.87% | 2.98%(+5.89)#28 | 1.28%(+7.59)#204 |
| 29. | Merritt Park | 8.83% | 2.98%(+5.86)#29 | 1.28%(+7.56)#208 |
| 30. | Gang Mills | 8.72% | 2.98%(+5.75)#30 | 1.28%(+7.45)#215 |
| 31. | North New Hyde Park | 8.65% | 2.98%(+5.67)#31 | 1.28%(+7.37)#217 |
| 32. | Manhasset | 8.48% | 2.98%(+5.51)#32 | 1.28%(+7.21)#222 |
| 33. | Roslyn Heights | 8.42% | 2.98%(+5.44)#33 | 1.28%(+7.14)#231 |
| 34. | Muttontown | 8.26% | 2.98%(+5.28)#34 | 1.28%(+6.98)#238 |
| 35. | Roslyn Harbor | 8.13% | 2.98%(+5.15)#35 | 1.28%(+6.85)#243 |
| 36. | Matinecock | 8.06% | 2.98%(+5.09)#36 | 1.28%(+6.79)#245 |
| 37. | Northeast Ithaca | 7.27% | 2.98%(+4.29)#37 | 1.28%(+5.99)#275 |
| 38. | Roslyn | 7.14% | 2.98%(+4.16)#38 | 1.28%(+5.86)#285 |
| 39. | Woodridge | 7.05% | 2.98%(+4.07)#39 | 1.28%(+5.78)#288 |
| 40. | Felts Mills | 6.98% | 2.98%(+4.00)#40 | 1.28%(+5.70)#294 |
| 41. | Plainview | 6.81% | 2.98%(+3.83)#41 | 1.28%(+5.53)#306 |
| 42. | Scarsdale | 6.78% | 2.98%(+3.80)#42 | 1.28%(+5.50)#308 |
| 43. | Upper Brookville | 6.60% | 2.98%(+3.62)#43 | 1.28%(+5.32)#319 |
| 44. | Plandome Heights | 6.50% | 2.98%(+3.53)#44 | 1.28%(+5.23)#331 |
| 45. | Ithaca | 6.18% | 2.98%(+3.20)#45 | 1.28%(+4.90)#356 |
| 46. | Westmere | 5.99% | 2.98%(+3.01)#46 | 1.28%(+4.71)#371 |
| 47. | Lincoln Park | 5.98% | 2.98%(+3.00)#47 | 1.28%(+4.70)#372 |
| 48. | Albertson | 5.87% | 2.98%(+2.89)#48 | 1.28%(+4.59)#389 |
| 49. | Great Neck | 5.66% | 2.98%(+2.68)#49 | 1.28%(+4.38)#413 |
| 50. | Eastchester | 5.63% | 2.98%(+2.65)#50 | 1.28%(+4.35)#419 |
| 51. | Poquott | 5.60% | 2.98%(+2.62)#51 | 1.28%(+4.33)#423 |
| 52. | New York | 5.47% | 2.98%(+2.49)#52 | 1.28%(+4.19)#433 |
| 53. | New Hyde Park | 5.46% | 2.98%(+2.48)#53 | 1.28%(+4.19)#435 |
| 54. | South Floral Park | 5.45% | 2.98%(+2.47)#54 | 1.28%(+4.17)#437 |
| 55. | Munsey Park | 5.37% | 2.98%(+2.40)#55 | 1.28%(+4.10)#446 |
| 56. | Chappaqua | 5.12% | 2.98%(+2.14)#56 | 1.28%(+3.85)#474 |
| 57. | Stony Brook | 5.10% | 2.98%(+2.13)#57 | 1.28%(+3.83)#475 |
| 58. | Flower Hill | 5.08% | 2.98%(+2.10)#58 | 1.28%(+3.80)#480 |
| 59. | Piermont | 5.07% | 2.98%(+2.09)#59 | 1.28%(+3.79)#482 |
| 60. | Orangeburg | 4.91% | 2.98%(+1.93)#60 | 1.28%(+3.63)#504 |
| 61. | Wurtsboro Hills | 4.80% | 2.98%(+1.83)#61 | 1.28%(+3.53)#520 |
| 62. | Manorhaven | 4.79% | 2.98%(+1.81)#62 | 1.28%(+3.52)#522 |
| 63. | Hartsdale | 4.77% | 2.98%(+1.79)#63 | 1.28%(+3.49)#526 |
| 64. | Centre Island | 4.70% | 2.98%(+1.72)#64 | 1.28%(+3.42)#537 |
| 65. | Brookville | 4.69% | 2.98%(+1.71)#65 | 1.28%(+3.41)#539 |
| 66. | East Williston | 4.64% | 2.98%(+1.66)#66 | 1.28%(+3.36)#545 |
| 67. | Mineola | 4.62% | 2.98%(+1.65)#67 | 1.28%(+3.35)#548 |
| 68. | East Setauket | 4.56% | 2.98%(+1.59)#68 | 1.28%(+3.29)#562 |
| 69. | East Hills | 4.53% | 2.98%(+1.55)#69 | 1.28%(+3.25)#569 |
| 70. | Saddle Rock | 4.31% | 2.98%(+1.33)#70 | 1.28%(+3.03)#607 |
| 71. | University At Buffalo | 4.30% | 2.98%(+1.32)#71 | 1.28%(+3.02)#609 |
| 72. | Grand View On Hudson | 4.25% | 2.98%(+1.27)#72 | 1.28%(+2.97)#623 |
| 73. | Mill Neck | 4.24% | 2.98%(+1.26)#73 | 1.28%(+2.97)#624 |
| 74. | Paul Smiths | 4.22% | 2.98%(+1.24)#74 | 1.28%(+2.95)#627 |
| 75. | Spackenkill | 4.20% | 2.98%(+1.22)#75 | 1.28%(+2.92)#633 |
| 76. | Irvington | 4.19% | 2.98%(+1.21)#76 | 1.28%(+2.91)#635 |
| 77. | Crystal Beach | 4.16% | 2.98%(+1.18)#77 | 1.28%(+2.88)#640 |
| 78. | Plandome Manor | 4.06% | 2.98%(+1.08)#78 | 1.28%(+2.78)#654 |
| 79. | Carle Place | 4.04% | 2.98%(+1.06)#79 | 1.28%(+2.76)#658 |
| 80. | Garden City | 4.00% | 2.98%(+1.02)#80 | 1.28%(+2.73)#663 |
| 81. | Zena | 3.99% | 2.98%(+1.02)#81 | 1.28%(+2.72)#665 |
| 82. | Floral Park | 3.96% | 2.98%(+0.981)#82 | 1.28%(+2.68)#670 |
| 83. | Port Washington | 3.91% | 2.98%(+0.931)#83 | 1.28%(+2.63)#682 |
| 84. | West Hampton Dunes | 3.85% | 2.98%(+0.869)#84 | 1.28%(+2.57)#696 |
| 85. | Salisbury | 3.82% | 2.98%(+0.840)#85 | 1.28%(+2.54)#704 |
| 86. | Rye Brook | 3.81% | 2.98%(+0.833)#86 | 1.28%(+2.53)#707 |
| 87. | Watkins Glen | 3.77% | 2.98%(+0.793)#87 | 1.28%(+2.49)#721 |
| 88. | Vassar College | 3.75% | 2.98%(+0.774)#88 | 1.28%(+2.48)#724 |
| 89. | Canisteo | 3.72% | 2.98%(+0.748)#89 | 1.28%(+2.45)#733 |
| 90. | Dix Hills | 3.70% | 2.98%(+0.722)#90 | 1.28%(+2.42)#741 |
| 91. | Rye | 3.70% | 2.98%(+0.719)#91 | 1.28%(+2.42)#742 |
| 92. | Stewart Manor | 3.65% | 2.98%(+0.677)#92 | 1.28%(+2.38)#754 |
| 93. | North Lynbrook | 3.62% | 2.98%(+0.640)#93 | 1.28%(+2.34)#764 |
| 94. | Williston Park | 3.59% | 2.98%(+0.615)#94 | 1.28%(+2.32)#771 |
| 95. | Harrison | 3.59% | 2.98%(+0.609)#95 | 1.28%(+2.31)#775 |
| 96. | Bard College | 3.58% | 2.98%(+0.605)#96 | 1.28%(+2.31)#776 |
| 97. | Otisville | 3.49% | 2.98%(+0.517)#97 | 1.28%(+2.22)#795 |
| 98. | Bronxville | 3.49% | 2.98%(+0.508)#98 | 1.28%(+2.21)#800 |
| 99. | Ardsley | 3.47% | 2.98%(+0.494)#99 | 1.28%(+2.20)#807 |
| 100. | Hicksville | 3.43% | 2.98%(+0.457)#100 | 1.28%(+2.16)#824 |
Common Questions
What are the Top 10 Cities with the Highest Percentage of Immigrants from Eastern Asia in New York?
Top 10 Cities with the Highest Percentage of Immigrants from Eastern Asia in New York are:
#1
39.39%
#2
26.95%
#3
24.73%
#4
22.94%
#5
22.80%
#6
21.67%
#7
19.83%
#8
19.64%
#9
14.74%
#10
14.43%
What city has the Highest Percentage of Immigrants from Eastern Asia in New York?
Forest Home has the Highest Percentage of Immigrants from Eastern Asia in New York with 39.39%.
What is the Percentage of Immigrants from Eastern Asia in the State of New York?
Percentage of Immigrants from Eastern Asia in New York is 2.98%.
What is the Percentage of Immigrants from Eastern Asia in the United States?
Percentage of Immigrants from Eastern Asia in the United States is 1.28%.