Golf, IL
Golf Map
Golf Overview
546
TOTAL POPULATION
291
MALE POPULATION
255
FEMALE POPULATION
114.12
MALES / 100 FEMALES
87.63
FEMALES / 100 MALES
50.1
MEDIAN AGE
3.0
AVG FAMILY SIZE
2.7
AVG HOUSEHOLD SIZE
$121,116
PER CAPITA INCOME
$236,250
AVG FAMILY INCOME
$228,750
AVG HOUSEHOLD INCOME
36.5%
WAGE / INCOME GAP [ % ]
63.5¢/ $1
WAGE / INCOME GAP [ $ ]
0.50
INEQUALITY / GINI INDEX
283
LABOR FORCE [ PEOPLE ]
63.7%
PERCENT IN LABOR FORCE
6.7%
UNEMPLOYMENT RATE
Golf Zip Codes
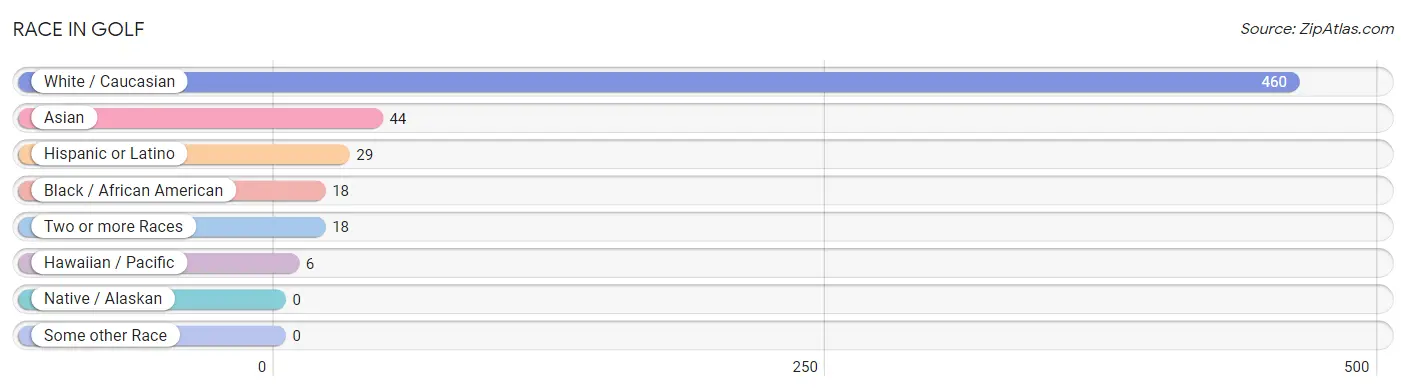
Race in Golf
The most populous races in Golf are White / Caucasian (460 | 84.3%), Asian (44 | 8.1%), and Hispanic or Latino (29 | 5.3%).
| Race | # Population | % Population |
| Asian | 44 | 8.1% |
| Black / African American | 18 | 3.3% |
| Hawaiian / Pacific | 6 | 1.1% |
| Hispanic or Latino | 29 | 5.3% |
| Native / Alaskan | 0 | 0.0% |
| White / Caucasian | 460 | 84.3% |
| Two or more Races | 18 | 3.3% |
| Some other Race | 0 | 0.0% |
| Total | 546 | 100.0% |
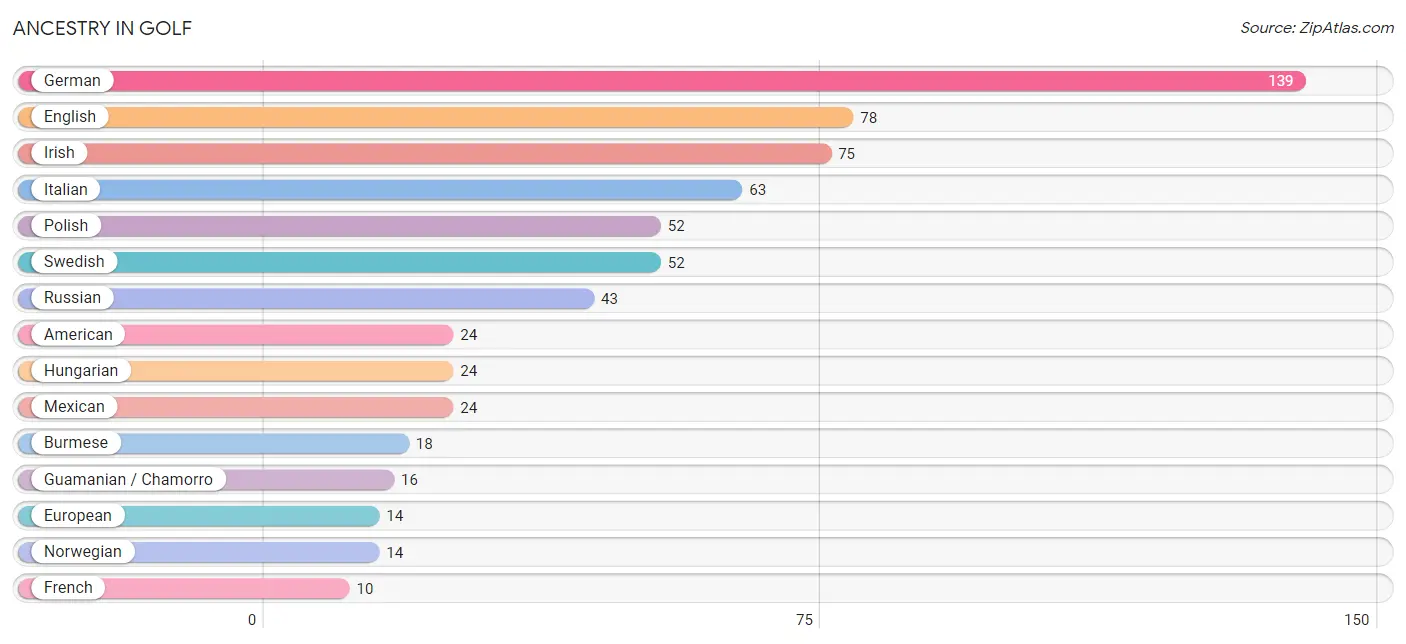
Ancestry in Golf
The most populous ancestries reported in Golf are German (139 | 25.5%), English (78 | 14.3%), Irish (75 | 13.7%), Italian (63 | 11.5%), and Polish (52 | 9.5%), together accounting for 74.5% of all Golf residents.
| Ancestry | # Population | % Population |
| American | 24 | 4.4% |
| Arab | 1 | 0.2% |
| Argentinean | 4 | 0.7% |
| Australian | 6 | 1.1% |
| Austrian | 3 | 0.5% |
| Belgian | 2 | 0.4% |
| Bhutanese | 1 | 0.2% |
| Burmese | 18 | 3.3% |
| Cambodian | 2 | 0.4% |
| Central American | 1 | 0.2% |
| Croatian | 3 | 0.5% |
| Czech | 1 | 0.2% |
| Danish | 5 | 0.9% |
| Dutch | 3 | 0.5% |
| Eastern European | 4 | 0.7% |
| English | 78 | 14.3% |
| Ethiopian | 6 | 1.1% |
| European | 14 | 2.6% |
| French | 10 | 1.8% |
| German | 139 | 25.5% |
| Greek | 10 | 1.8% |
| Guamanian / Chamorro | 16 | 2.9% |
| Hungarian | 24 | 4.4% |
| Indian (Asian) | 6 | 1.1% |
| Irish | 75 | 13.7% |
| Italian | 63 | 11.5% |
| Jamaican | 3 | 0.5% |
| Korean | 10 | 1.8% |
| Lebanese | 1 | 0.2% |
| Lithuanian | 3 | 0.5% |
| Mexican | 24 | 4.4% |
| Norwegian | 14 | 2.6% |
| Pakistani | 2 | 0.4% |
| Polish | 52 | 9.5% |
| Russian | 43 | 7.9% |
| Salvadoran | 1 | 0.2% |
| Scandinavian | 2 | 0.4% |
| South American | 4 | 0.7% |
| Subsaharan African | 6 | 1.1% |
| Swedish | 52 | 9.5% |
| Thai | 7 | 1.3% |
| Ukrainian | 1 | 0.2% |
| Welsh | 3 | 0.5% | View All 43 Rows |
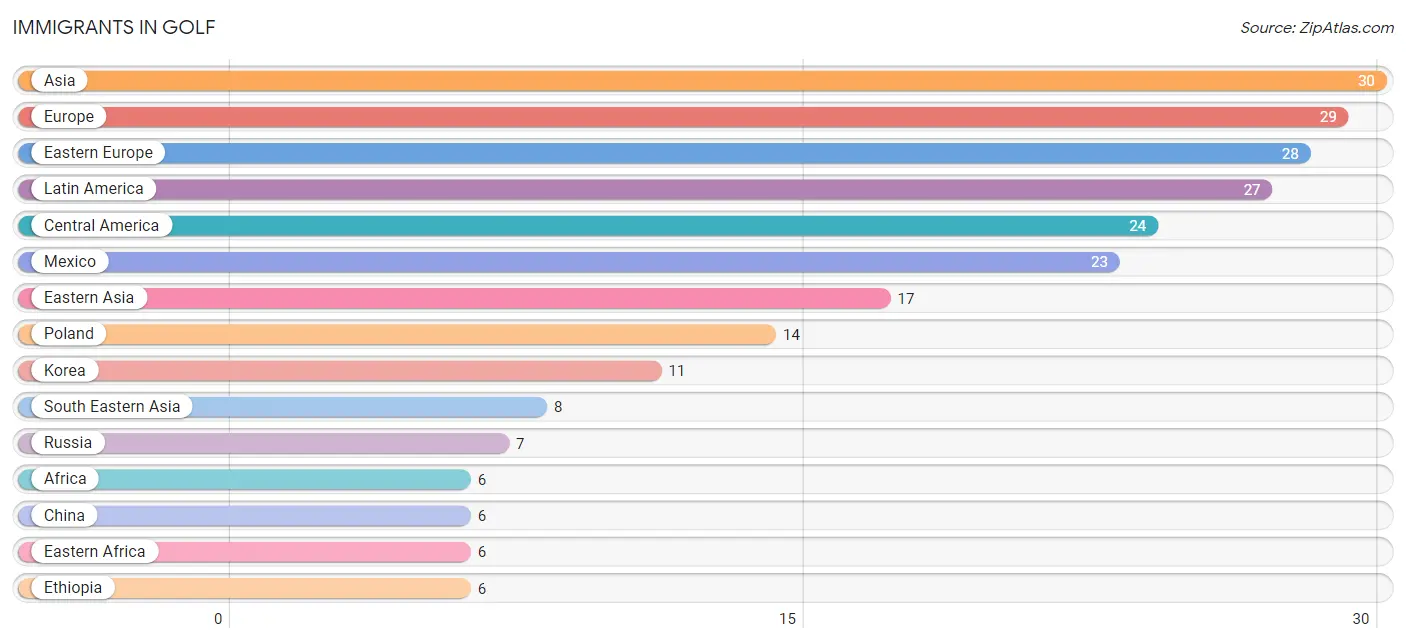
Immigrants in Golf
The most numerous immigrant groups reported in Golf came from Asia (30 | 5.5%), Europe (29 | 5.3%), Eastern Europe (28 | 5.1%), Latin America (27 | 5.0%), and Central America (24 | 4.4%), together accounting for 25.3% of all Golf residents.
| Immigration Origin | # Population | % Population |
| Africa | 6 | 1.1% |
| Asia | 30 | 5.5% |
| Australia | 4 | 0.7% |
| Caribbean | 3 | 0.5% |
| Central America | 24 | 4.4% |
| China | 6 | 1.1% |
| Eastern Africa | 6 | 1.1% |
| Eastern Asia | 17 | 3.1% |
| Eastern Europe | 28 | 5.1% |
| El Salvador | 1 | 0.2% |
| England | 1 | 0.2% |
| Ethiopia | 6 | 1.1% |
| Europe | 29 | 5.3% |
| India | 5 | 0.9% |
| Jamaica | 3 | 0.5% |
| Korea | 11 | 2.0% |
| Latin America | 27 | 5.0% |
| Mexico | 23 | 4.2% |
| Northern Europe | 1 | 0.2% |
| Oceania | 4 | 0.7% |
| Philippines | 6 | 1.1% |
| Poland | 14 | 2.6% |
| Russia | 7 | 1.3% |
| South Central Asia | 5 | 0.9% |
| South Eastern Asia | 8 | 1.5% |
| Thailand | 2 | 0.4% | View All 26 Rows |
Sex and Age in Golf
Sex and Age in Golf
The most populous age groups in Golf are 55 to 59 Years (45 | 15.5%) for men and 55 to 59 Years (43 | 16.9%) for women.
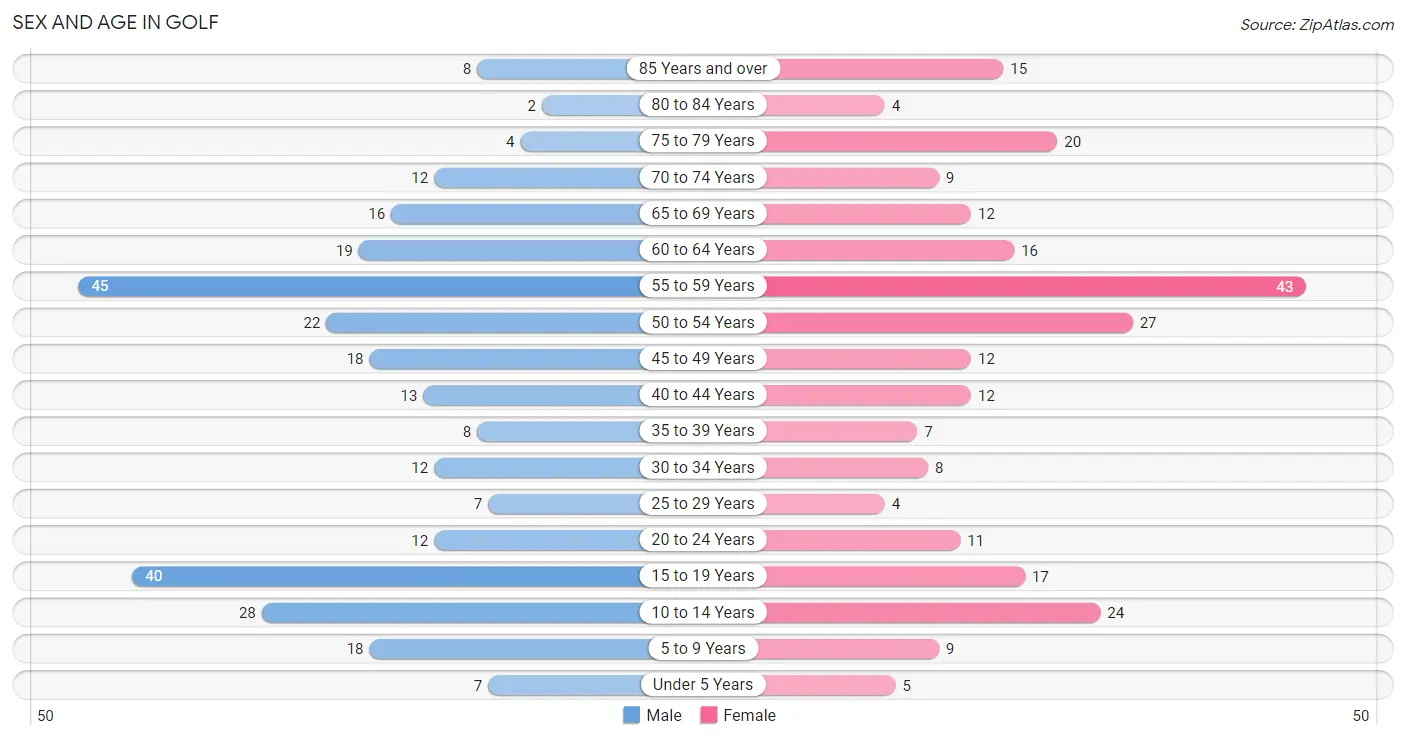
| Age Bracket | Male | Female |
| Under 5 Years | 7 (2.4%) | 5 (2.0%) |
| 5 to 9 Years | 18 (6.2%) | 9 (3.5%) |
| 10 to 14 Years | 28 (9.6%) | 24 (9.4%) |
| 15 to 19 Years | 40 (13.8%) | 17 (6.7%) |
| 20 to 24 Years | 12 (4.1%) | 11 (4.3%) |
| 25 to 29 Years | 7 (2.4%) | 4 (1.6%) |
| 30 to 34 Years | 12 (4.1%) | 8 (3.1%) |
| 35 to 39 Years | 8 (2.8%) | 7 (2.8%) |
| 40 to 44 Years | 13 (4.5%) | 12 (4.7%) |
| 45 to 49 Years | 18 (6.2%) | 12 (4.7%) |
| 50 to 54 Years | 22 (7.6%) | 27 (10.6%) |
| 55 to 59 Years | 45 (15.5%) | 43 (16.9%) |
| 60 to 64 Years | 19 (6.5%) | 16 (6.3%) |
| 65 to 69 Years | 16 (5.5%) | 12 (4.7%) |
| 70 to 74 Years | 12 (4.1%) | 9 (3.5%) |
| 75 to 79 Years | 4 (1.4%) | 20 (7.8%) |
| 80 to 84 Years | 2 (0.7%) | 4 (1.6%) |
| 85 Years and over | 8 (2.8%) | 15 (5.9%) |
| Total | 291 (100.0%) | 255 (100.0%) |
Families and Households in Golf
Median Family Size in Golf
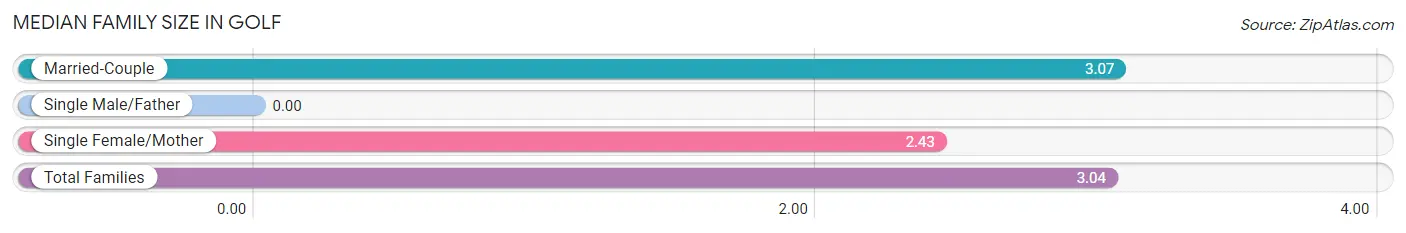
| Family Type | # Families | Family Size |
| Married-Couple | 153 (95.6%) | 3.07 |
| Single Male/Father | 0 (0.0%) | - |
| Single Female/Mother | 7 (4.4%) | 2.43 |
| Total Families | 160 (100.0%) | 3.04 |
Median Household Size in Golf
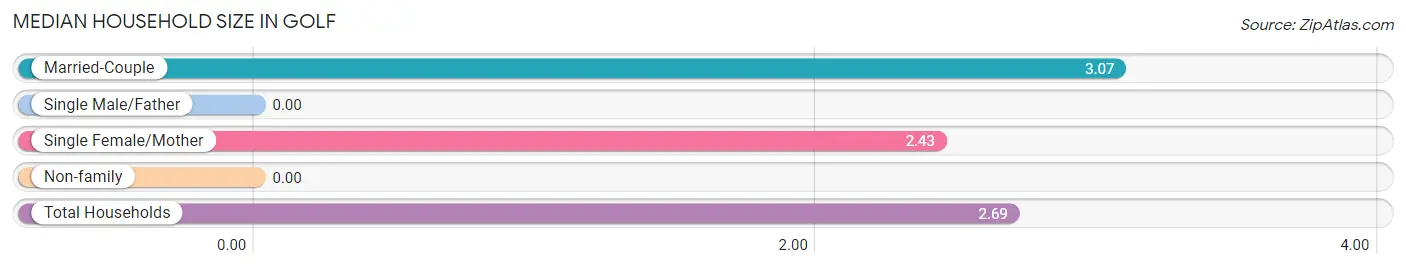
| Household Type | # Households | Household Size |
| Married-Couple | 153 (78.9%) | 3.07 |
| Single Male/Father | 0 (0.0%) | - |
| Single Female/Mother | 7 (3.6%) | 2.43 |
| Non-family | 34 (17.5%) | - |
| Total Households | 194 (100.0%) | 2.69 |
Household Size by Marriage Status in Golf
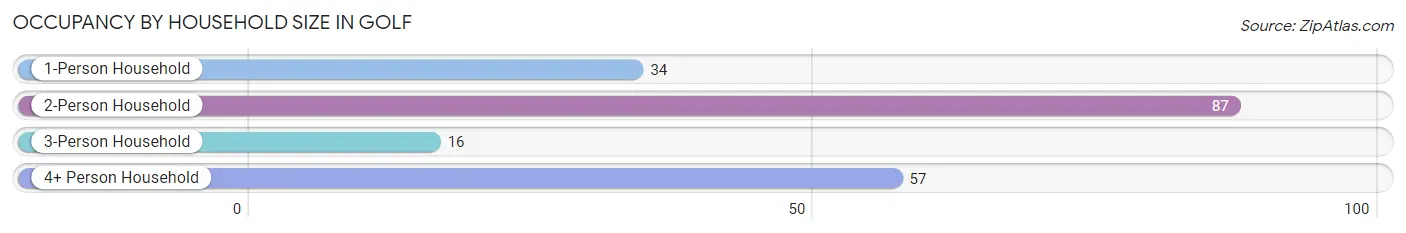
Out of a total of 194 households in Golf, 160 (82.5%) are family households, while 34 (17.5%) are nonfamily households. The most numerous type of family households are 2-person households, comprising 87, and the most common type of nonfamily households are 1-person households, comprising 34.
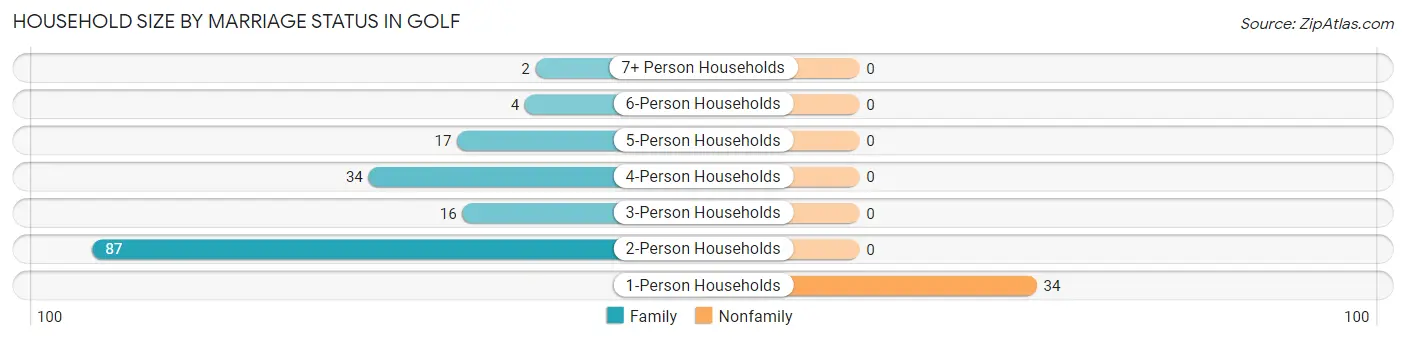
| Household Size | Family Households | Nonfamily Households |
| 1-Person Households | - | 34 (17.5%) |
| 2-Person Households | 87 (44.9%) | 0 (0.0%) |
| 3-Person Households | 16 (8.3%) | 0 (0.0%) |
| 4-Person Households | 34 (17.5%) | 0 (0.0%) |
| 5-Person Households | 17 (8.8%) | 0 (0.0%) |
| 6-Person Households | 4 (2.1%) | 0 (0.0%) |
| 7+ Person Households | 2 (1.0%) | 0 (0.0%) |
| Total | 160 (82.5%) | 34 (17.5%) |
Female Fertility in Golf
Fertility by Age in Golf
Average fertility rate in Golf is 91.0 births per 1,000 women. Women in the age bracket of 20 to 34 years have the highest fertility rate with 261.0 births per 1,000 women. Women in the age bracket of 20 to 34 years acount for 85.7% of all women with births.
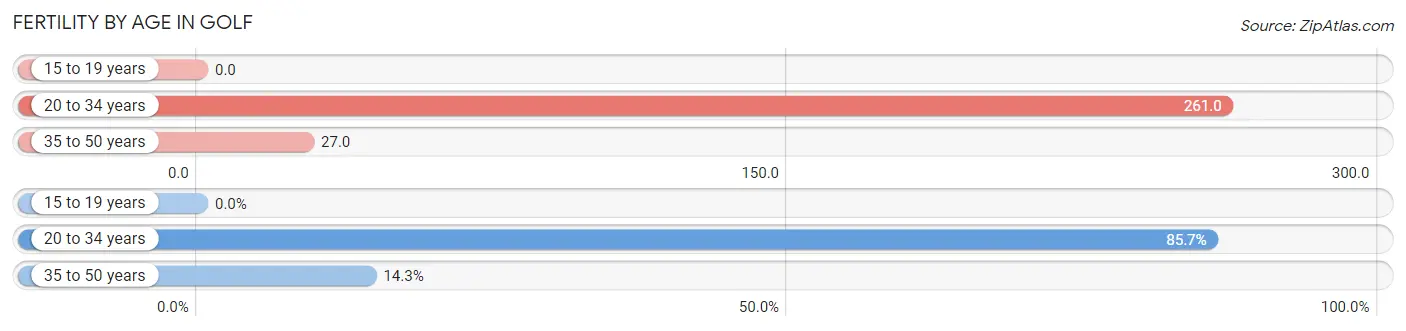
| Age Bracket | Women with Births | Births / 1,000 Women |
| 15 to 19 years | 0 (0.0%) | 0.0 |
| 20 to 34 years | 6 (85.7%) | 261.0 |
| 35 to 50 years | 1 (14.3%) | 27.0 |
| Total | 7 (100.0%) | 91.0 |
Fertility by Age by Marriage Status in Golf
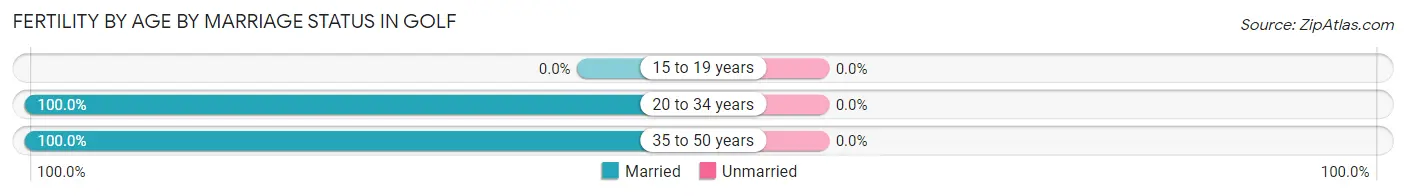
| Age Bracket | Married | Unmarried |
| 15 to 19 years | 0 (0.0%) | 0 (0.0%) |
| 20 to 34 years | 6 (100.0%) | 0 (0.0%) |
| 35 to 50 years | 1 (100.0%) | 0 (0.0%) |
| Total | 7 (100.0%) | 0 (0.0%) |
Fertility by Education in Golf
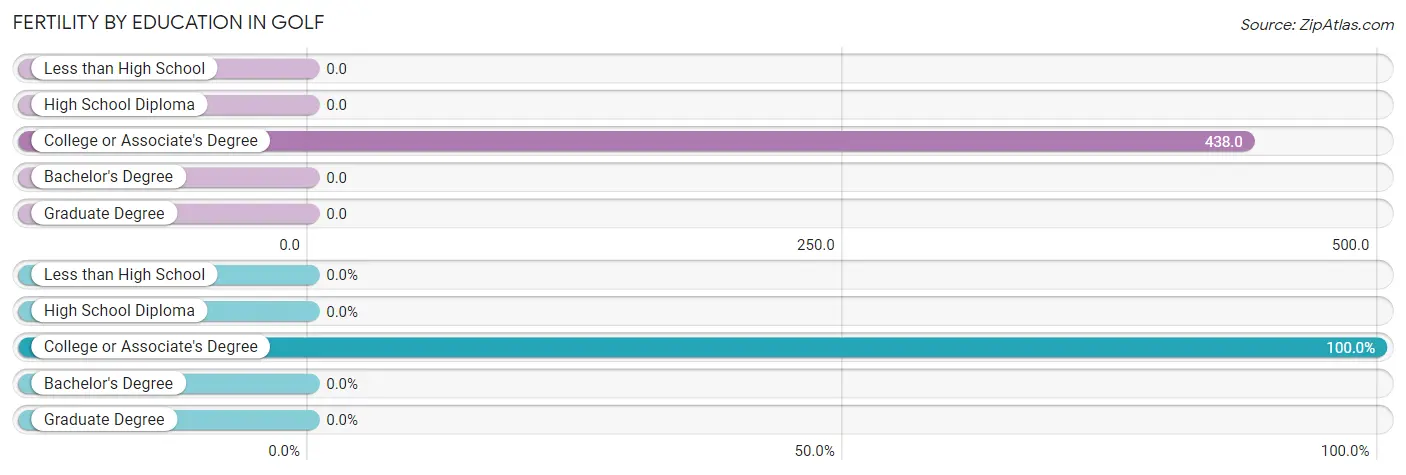
| Educational Attainment | Women with Births | Births / 1,000 Women |
| Less than High School | 0 (0.0%) | 0.0 |
| High School Diploma | 0 (0.0%) | 0.0 |
| College or Associate's Degree | 7 (100.0%) | 438.0 |
| Bachelor's Degree | 0 (0.0%) | 0.0 |
| Graduate Degree | 0 (0.0%) | 0.0 |
| Total | 7 (100.0%) | 91.0 |
Fertility by Education by Marriage Status in Golf
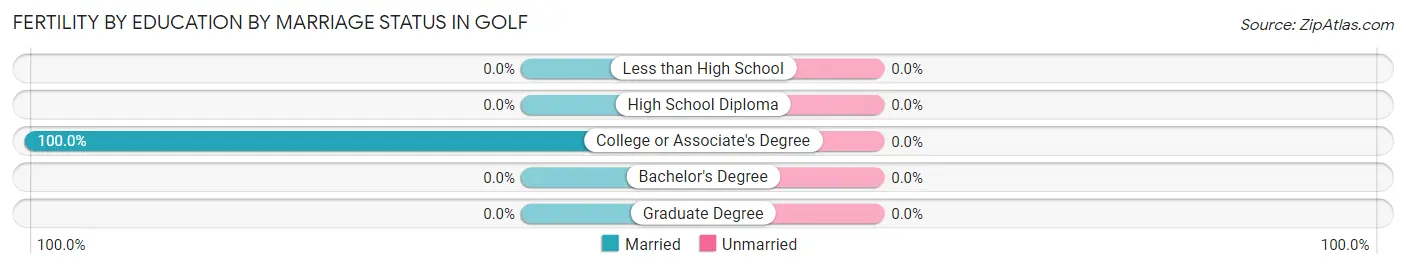
| Educational Attainment | Married | Unmarried |
| Less than High School | 0 (0.0%) | 0 (0.0%) |
| High School Diploma | 0 (0.0%) | 0 (0.0%) |
| College or Associate's Degree | 7 (100.0%) | 0 (0.0%) |
| Bachelor's Degree | 0 (0.0%) | 0 (0.0%) |
| Graduate Degree | 0 (0.0%) | 0 (0.0%) |
| Total | 7 (100.0%) | 0 (0.0%) |
Income in Golf
Income Overview in Golf
Per Capita Income in Golf is $121,116, while median incomes of families and households are $236,250 and $228,750 respectively.
| Characteristic | Number | Measure |
| Per Capita Income | 546 | $121,116 |
| Median Family Income | 160 | $236,250 |
| Mean Family Income | 160 | $389,774 |
| Median Household Income | 194 | $228,750 |
| Mean Household Income | 194 | $329,453 |
| Income Deficit | 160 | $0 |
| Wage / Income Gap (%) | 546 | 36.47% |
| Wage / Income Gap ($) | 546 | 63.53¢ per $1 |
| Gini / Inequality Index | 546 | 0.50 |
Earnings by Sex in Golf
Average Earnings in Golf are $106,071, $119,688 for men and $76,042 for women, a difference of 36.5%.
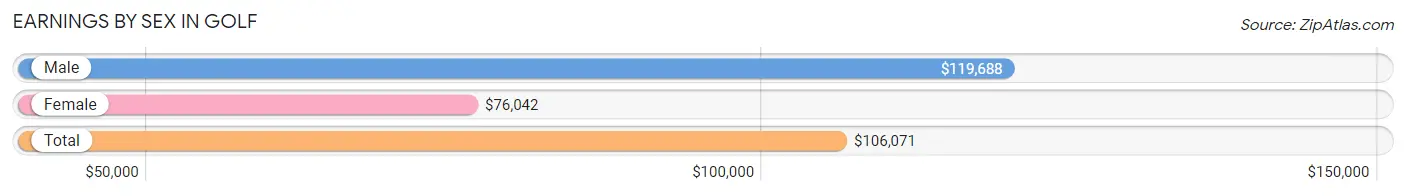
| Sex | Number | Average Earnings |
| Male | 173 (61.8%) | $119,688 |
| Female | 107 (38.2%) | $76,042 |
| Total | 280 (100.0%) | $106,071 |
Earnings by Sex by Income Bracket in Golf
The most common earnings brackets in Golf are $100,000+ for men (108 | 62.4%) and $100,000+ for women (42 | 39.3%).
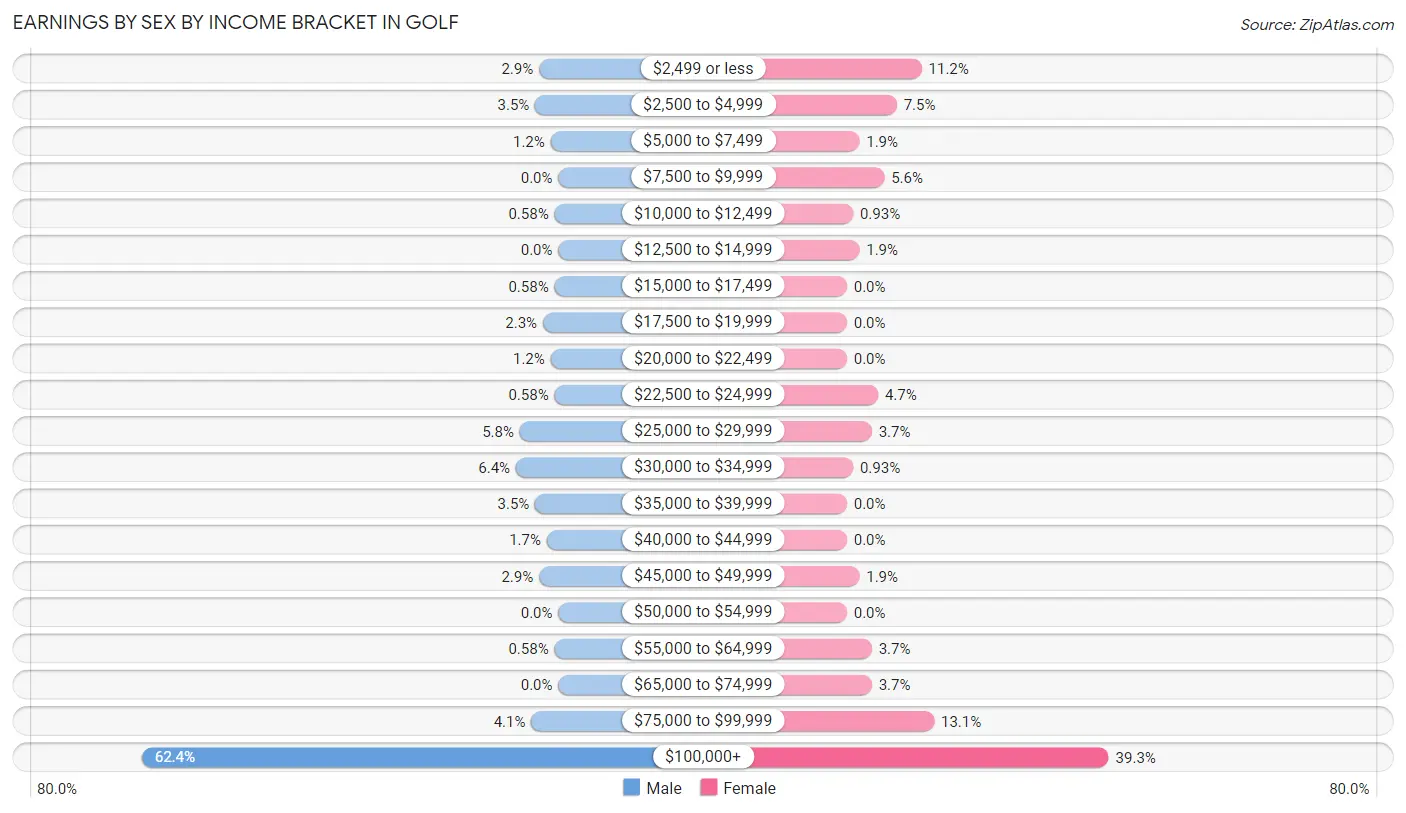
| Income | Male | Female |
| $2,499 or less | 5 (2.9%) | 12 (11.2%) |
| $2,500 to $4,999 | 6 (3.5%) | 8 (7.5%) |
| $5,000 to $7,499 | 2 (1.2%) | 2 (1.9%) |
| $7,500 to $9,999 | 0 (0.0%) | 6 (5.6%) |
| $10,000 to $12,499 | 1 (0.6%) | 1 (0.9%) |
| $12,500 to $14,999 | 0 (0.0%) | 2 (1.9%) |
| $15,000 to $17,499 | 1 (0.6%) | 0 (0.0%) |
| $17,500 to $19,999 | 4 (2.3%) | 0 (0.0%) |
| $20,000 to $22,499 | 2 (1.2%) | 0 (0.0%) |
| $22,500 to $24,999 | 1 (0.6%) | 5 (4.7%) |
| $25,000 to $29,999 | 10 (5.8%) | 4 (3.7%) |
| $30,000 to $34,999 | 11 (6.4%) | 1 (0.9%) |
| $35,000 to $39,999 | 6 (3.5%) | 0 (0.0%) |
| $40,000 to $44,999 | 3 (1.7%) | 0 (0.0%) |
| $45,000 to $49,999 | 5 (2.9%) | 2 (1.9%) |
| $50,000 to $54,999 | 0 (0.0%) | 0 (0.0%) |
| $55,000 to $64,999 | 1 (0.6%) | 4 (3.7%) |
| $65,000 to $74,999 | 0 (0.0%) | 4 (3.7%) |
| $75,000 to $99,999 | 7 (4.1%) | 14 (13.1%) |
| $100,000+ | 108 (62.4%) | 42 (39.3%) |
| Total | 173 (100.0%) | 107 (100.0%) |
Earnings by Sex by Educational Attainment in Golf
Average earnings in Golf are $156,250 for men and $88,750 for women, a difference of 43.2%. Men with an educational attainment of bachelor's degree enjoy the highest average annual earnings of $250,001, while those with less than high school education earn the least with $32,083. Women with an educational attainment of graduate degree earn the most with the average annual earnings of $136,250, while those with college or associate's degree education have the smallest earnings of $75,833.
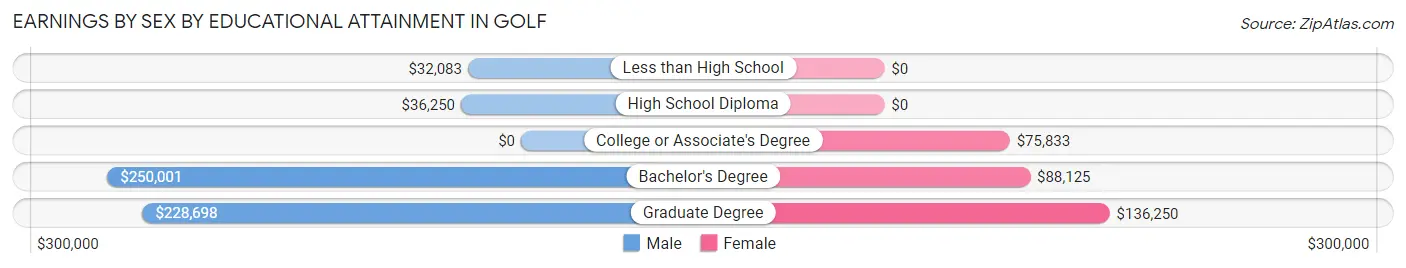
| Educational Attainment | Male Income | Female Income |
| Less than High School | $32,083 | $0 |
| High School Diploma | $36,250 | $0 |
| College or Associate's Degree | - | - |
| Bachelor's Degree | $250,001 | $88,125 |
| Graduate Degree | $228,698 | $136,250 |
| Total | $156,250 | $88,750 |
Family Income in Golf
Family Income Brackets in Golf
According to the Golf family income data, there are 114 families falling into the $200,000+ income range, which is the most common income bracket and makes up 71.3% of all families.
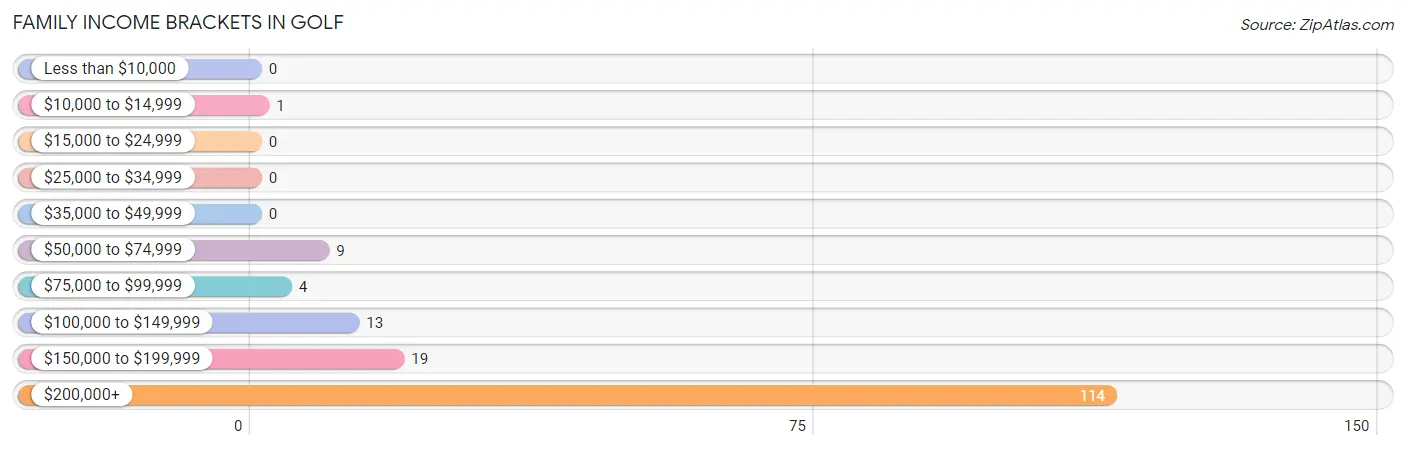
| Income Bracket | # Families | % Families |
| Less than $10,000 | 0 | 0.0% |
| $10,000 to $14,999 | 1 | 0.6% |
| $15,000 to $24,999 | 0 | 0.0% |
| $25,000 to $34,999 | 0 | 0.0% |
| $35,000 to $49,999 | 0 | 0.0% |
| $50,000 to $74,999 | 9 | 5.6% |
| $75,000 to $99,999 | 4 | 2.5% |
| $100,000 to $149,999 | 13 | 8.1% |
| $150,000 to $199,999 | 19 | 11.9% |
| $200,000+ | 114 | 71.3% |
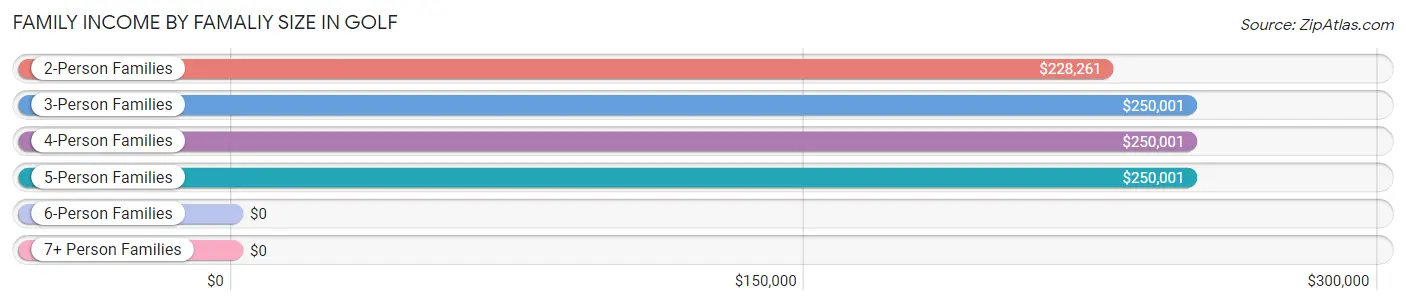
Family Income by Famaliy Size in Golf
3-person families (15 | 9.4%) account for the highest median family income in Golf with $250,001 per family, while 2-person families (88 | 55.0%) have the highest median income of $114,130 per family member.
| Income Bracket | # Families | Median Income |
| 2-Person Families | 88 (55.0%) | $228,261 |
| 3-Person Families | 15 (9.4%) | $250,001 |
| 4-Person Families | 34 (21.2%) | $250,001 |
| 5-Person Families | 17 (10.6%) | $250,001 |
| 6-Person Families | 4 (2.5%) | $0 |
| 7+ Person Families | 2 (1.3%) | $0 |
| Total | 160 (100.0%) | $236,250 |
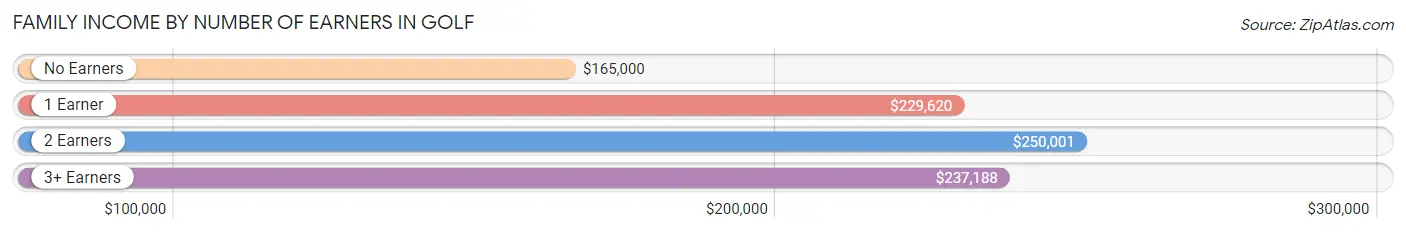
Family Income by Number of Earners in Golf
The median family income in Golf is $236,250, with families comprising 2 earners (74) having the highest median family income of $250,001, while families with no earners (16) have the lowest median family income of $165,000, accounting for 46.3% and 10.0% of families, respectively.
| Number of Earners | # Families | Median Income |
| No Earners | 16 (10.0%) | $165,000 |
| 1 Earner | 57 (35.6%) | $229,620 |
| 2 Earners | 74 (46.3%) | $250,001 |
| 3+ Earners | 13 (8.1%) | $237,188 |
| Total | 160 (100.0%) | $236,250 |
Household Income in Golf
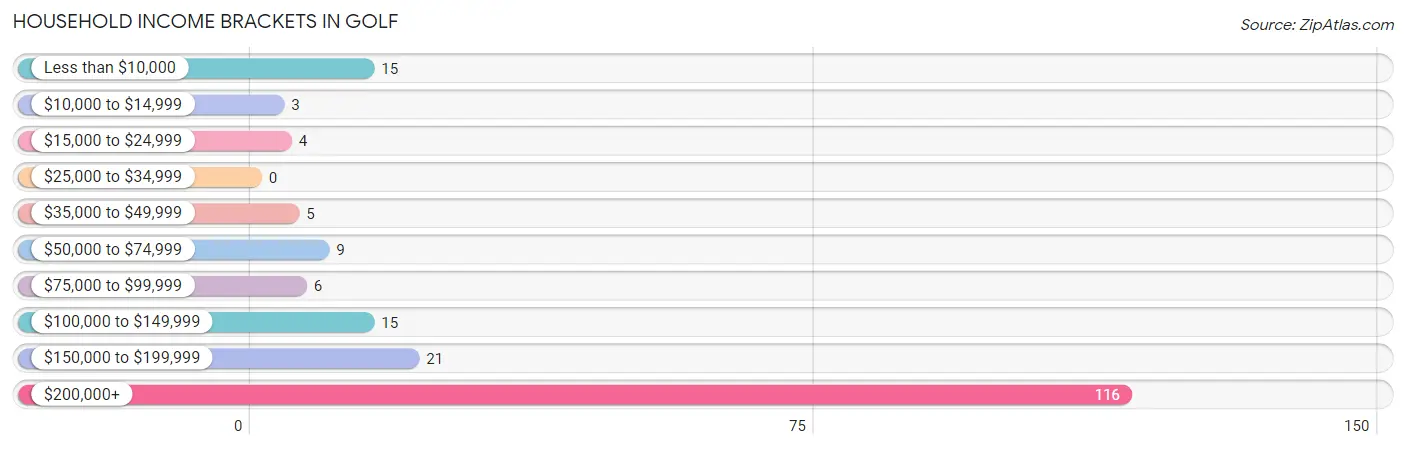
Household Income Brackets in Golf
With 116 households falling in the category, the $200,000+ income range is the most frequent in Golf, accounting for 59.8% of all households.
| Income Bracket | # Households | % Households |
| Less than $10,000 | 15 | 7.7% |
| $10,000 to $14,999 | 3 | 1.5% |
| $15,000 to $24,999 | 4 | 2.1% |
| $25,000 to $34,999 | 0 | 0.0% |
| $35,000 to $49,999 | 5 | 2.6% |
| $50,000 to $74,999 | 9 | 4.6% |
| $75,000 to $99,999 | 6 | 3.1% |
| $100,000 to $149,999 | 15 | 7.7% |
| $150,000 to $199,999 | 21 | 10.8% |
| $200,000+ | 116 | 59.8% |
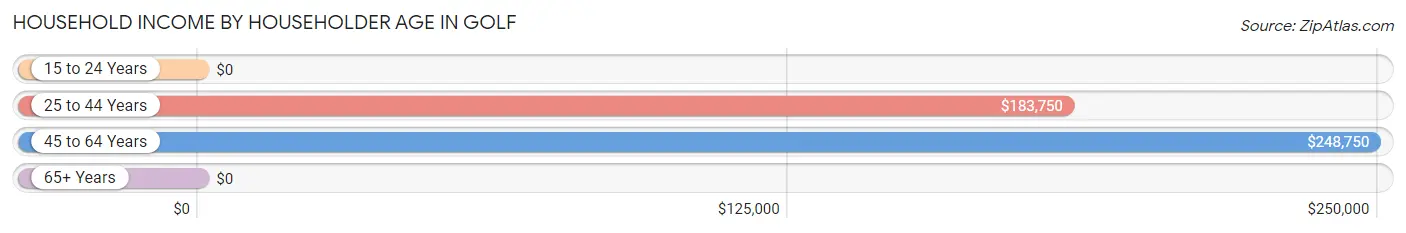
Household Income by Householder Age in Golf
The median household income in Golf is $228,750, with the highest median household income of $248,750 found in the 45 to 64 years age bracket for the primary householder. A total of 102 households (52.6%) fall into this category.
| Income Bracket | # Households | Median Income |
| 15 to 24 Years | 0 (0.0%) | $0 |
| 25 to 44 Years | 27 (13.9%) | $183,750 |
| 45 to 64 Years | 102 (52.6%) | $248,750 |
| 65+ Years | 65 (33.5%) | $0 |
| Total | 194 (100.0%) | $228,750 |
Poverty in Golf
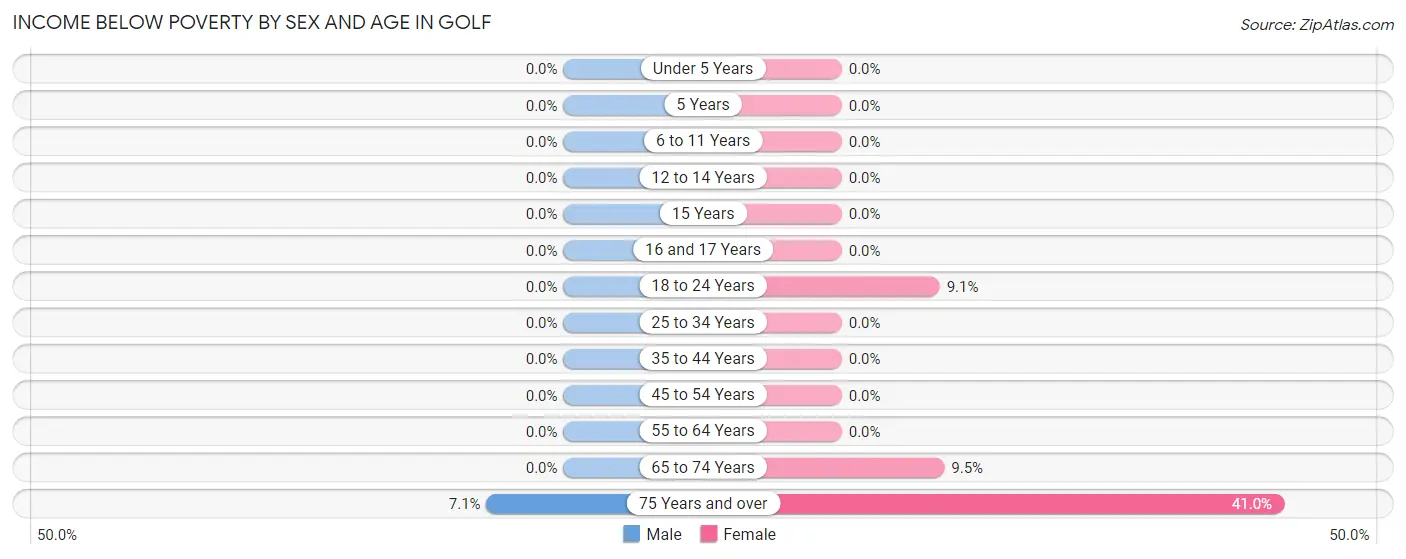
Income Below Poverty by Sex and Age in Golf
With 0.3% poverty level for males and 7.4% for females among the residents of Golf, 75 year old and over males and 75 year old and over females are the most vulnerable to poverty, with 1 males (7.1%) and 16 females (41.0%) in their respective age groups living below the poverty level.
| Age Bracket | Male | Female |
| Under 5 Years | 0 (0.0%) | 0 (0.0%) |
| 5 Years | 0 (0.0%) | 0 (0.0%) |
| 6 to 11 Years | 0 (0.0%) | 0 (0.0%) |
| 12 to 14 Years | 0 (0.0%) | 0 (0.0%) |
| 15 Years | 0 (0.0%) | 0 (0.0%) |
| 16 and 17 Years | 0 (0.0%) | 0 (0.0%) |
| 18 to 24 Years | 0 (0.0%) | 1 (9.1%) |
| 25 to 34 Years | 0 (0.0%) | 0 (0.0%) |
| 35 to 44 Years | 0 (0.0%) | 0 (0.0%) |
| 45 to 54 Years | 0 (0.0%) | 0 (0.0%) |
| 55 to 64 Years | 0 (0.0%) | 0 (0.0%) |
| 65 to 74 Years | 0 (0.0%) | 2 (9.5%) |
| 75 Years and over | 1 (7.1%) | 16 (41.0%) |
| Total | 1 (0.3%) | 19 (7.4%) |
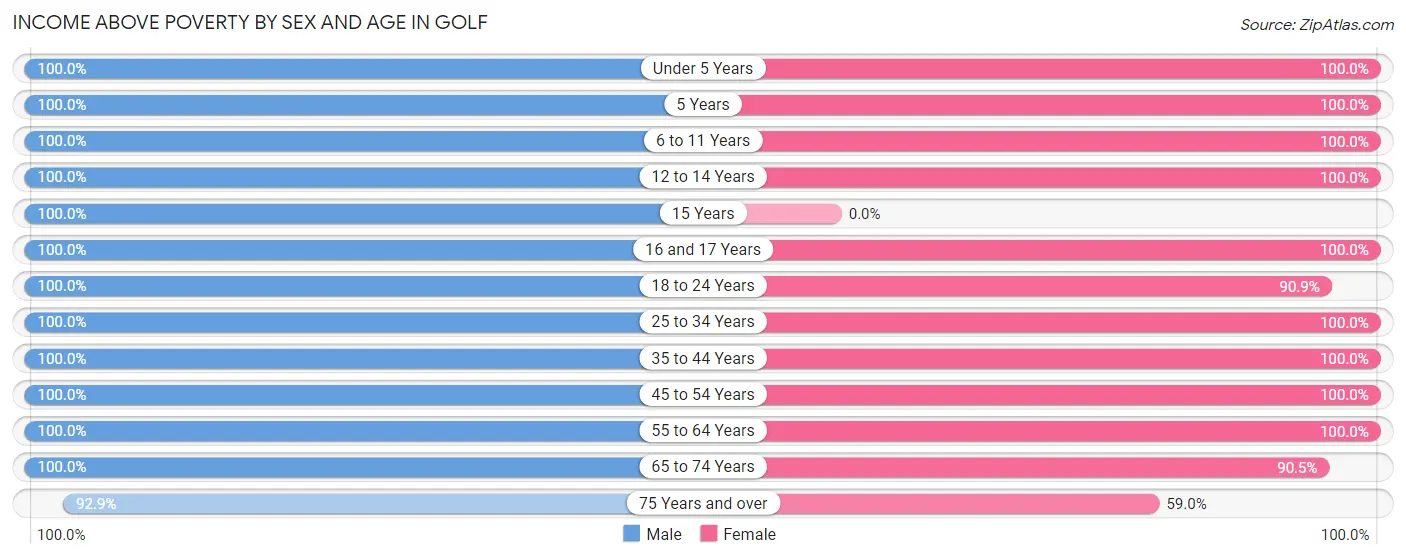
Income Above Poverty by Sex and Age in Golf
According to the poverty statistics in Golf, males aged under 5 years and females aged under 5 years are the age groups that are most secure financially, with 100.0% of males and 100.0% of females in these age groups living above the poverty line.
| Age Bracket | Male | Female |
| Under 5 Years | 7 (100.0%) | 5 (100.0%) |
| 5 Years | 3 (100.0%) | 1 (100.0%) |
| 6 to 11 Years | 28 (100.0%) | 10 (100.0%) |
| 12 to 14 Years | 15 (100.0%) | 22 (100.0%) |
| 15 Years | 11 (100.0%) | 0 (0.0%) |
| 16 and 17 Years | 11 (100.0%) | 17 (100.0%) |
| 18 to 24 Years | 30 (100.0%) | 10 (90.9%) |
| 25 to 34 Years | 19 (100.0%) | 12 (100.0%) |
| 35 to 44 Years | 21 (100.0%) | 19 (100.0%) |
| 45 to 54 Years | 40 (100.0%) | 39 (100.0%) |
| 55 to 64 Years | 64 (100.0%) | 59 (100.0%) |
| 65 to 74 Years | 28 (100.0%) | 19 (90.5%) |
| 75 Years and over | 13 (92.9%) | 23 (59.0%) |
| Total | 290 (99.7%) | 236 (92.5%) |
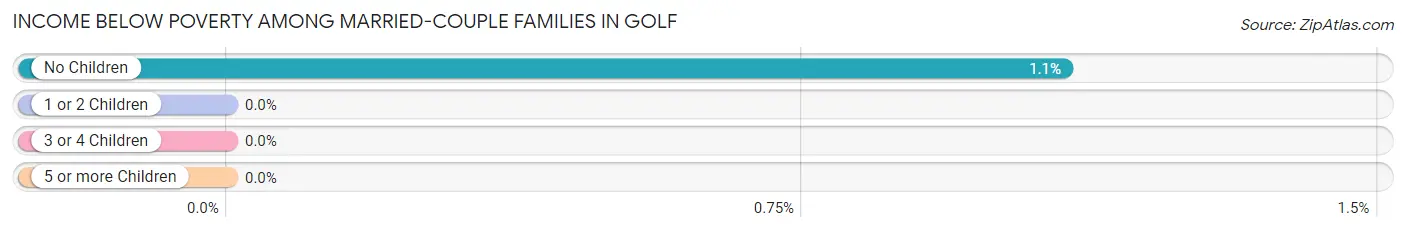
Income Below Poverty Among Married-Couple Families in Golf
The poverty statistics for married-couple families in Golf show that 0.6% or 1 of the total 153 families live below the poverty line. Families with no children have the highest poverty rate of 1.1%, comprising of 1 families. On the other hand, families with 1 or 2 children have the lowest poverty rate of 0.0%, which includes 0 families.
| Children | Above Poverty | Below Poverty |
| No Children | 91 (98.9%) | 1 (1.1%) |
| 1 or 2 Children | 47 (100.0%) | 0 (0.0%) |
| 3 or 4 Children | 14 (100.0%) | 0 (0.0%) |
| 5 or more Children | 0 (0.0%) | 0 (0.0%) |
| Total | 152 (99.4%) | 1 (0.6%) |
Income Below Poverty Among Single-Parent Households in Golf
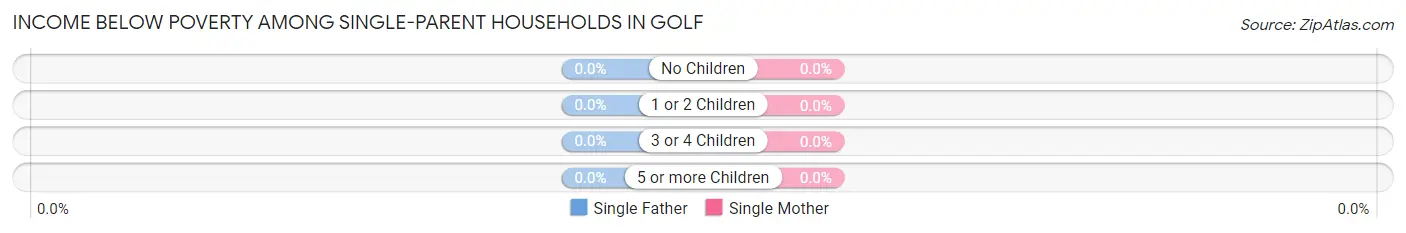
| Children | Single Father | Single Mother |
| No Children | 0 (0.0%) | 0 (0.0%) |
| 1 or 2 Children | 0 (0.0%) | 0 (0.0%) |
| 3 or 4 Children | 0 (0.0%) | 0 (0.0%) |
| 5 or more Children | 0 (0.0%) | 0 (0.0%) |
| Total | 0 (0.0%) | 0 (0.0%) |
Income Below Poverty Among Married-Couple vs Single-Parent Households in Golf
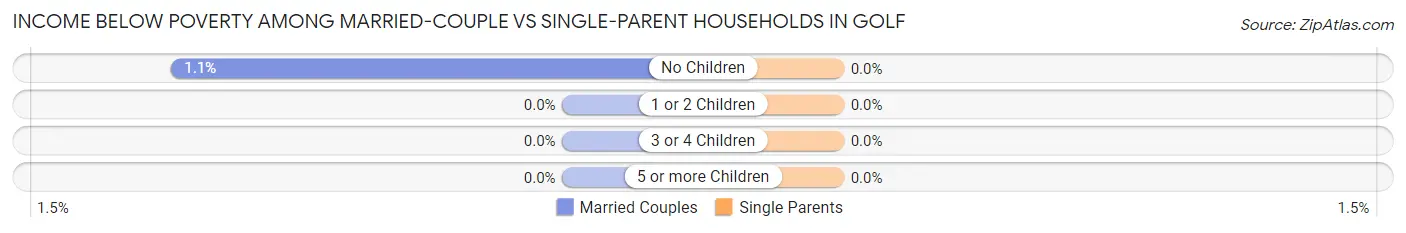
| Children | Married-Couple Families | Single-Parent Households |
| No Children | 1 (1.1%) | 0 (0.0%) |
| 1 or 2 Children | 0 (0.0%) | 0 (0.0%) |
| 3 or 4 Children | 0 (0.0%) | 0 (0.0%) |
| 5 or more Children | 0 (0.0%) | 0 (0.0%) |
| Total | 1 (0.6%) | 0 (0.0%) |
Employment Characteristics in Golf
Employment by Class of Employer in Golf
Among the 263 employed individuals in Golf, private company employees (159 | 60.5%), self-employed (incorporated) (42 | 16.0%), and not-for-profit organizations (28 | 10.6%) make up the most common classes of employment.
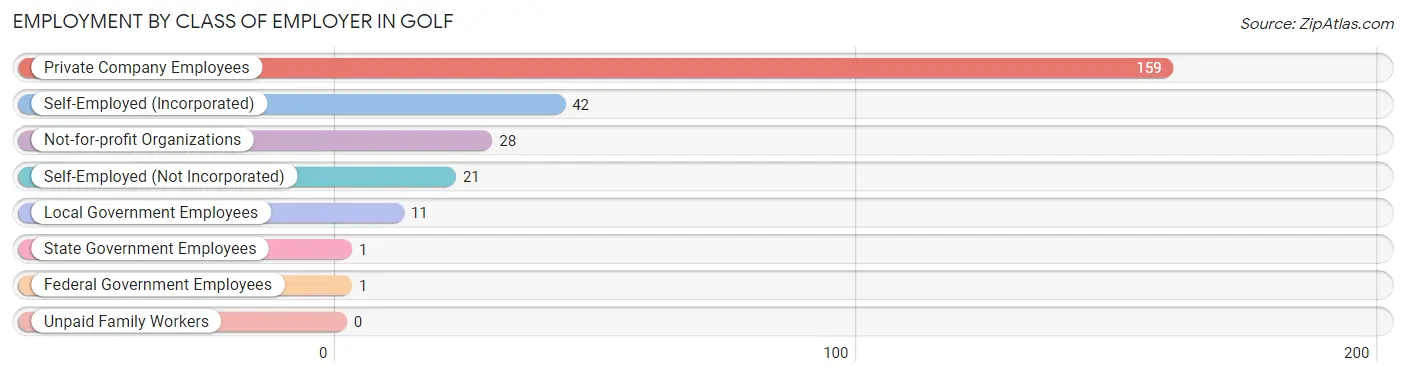
| Employer Class | # Employees | % Employees |
| Private Company Employees | 159 | 60.5% |
| Self-Employed (Incorporated) | 42 | 16.0% |
| Self-Employed (Not Incorporated) | 21 | 8.0% |
| Not-for-profit Organizations | 28 | 10.6% |
| Local Government Employees | 11 | 4.2% |
| State Government Employees | 1 | 0.4% |
| Federal Government Employees | 1 | 0.4% |
| Unpaid Family Workers | 0 | 0.0% |
| Total | 263 | 100.0% |
Employment Status by Age in Golf
According to the labor force statistics for Golf, out of the total population over 16 years of age (444), 63.7% or 283 individuals are in the labor force, with 6.7% or 19 of them unemployed. The age group with the highest labor force participation rate is 25 to 29 years, with 100.0% or 11 individuals in the labor force. Within the labor force, the 20 to 24 years age range has the highest percentage of unemployed individuals, with 46.7% or 7 of them being unemployed.
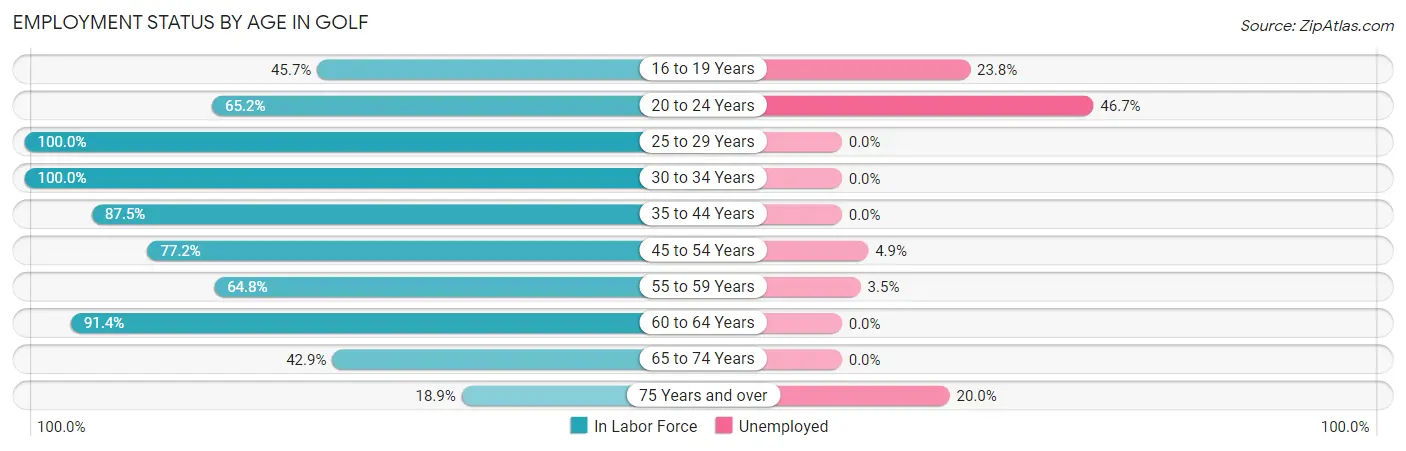
| Age Bracket | In Labor Force | Unemployed |
| 16 to 19 Years | 21 (45.7%) | 5 (23.8%) |
| 20 to 24 Years | 15 (65.2%) | 7 (46.7%) |
| 25 to 29 Years | 11 (100.0%) | 0 (0.0%) |
| 30 to 34 Years | 20 (100.0%) | 0 (0.0%) |
| 35 to 44 Years | 35 (87.5%) | 0 (0.0%) |
| 45 to 54 Years | 61 (77.2%) | 3 (4.9%) |
| 55 to 59 Years | 57 (64.8%) | 2 (3.5%) |
| 60 to 64 Years | 32 (91.4%) | 0 (0.0%) |
| 65 to 74 Years | 21 (42.9%) | 0 (0.0%) |
| 75 Years and over | 10 (18.9%) | 2 (20.0%) |
| Total | 283 (63.7%) | 19 (6.7%) |
Employment Status by Educational Attainment in Golf
According to labor force statistics for Golf, 79.1% of individuals (216) out of the total population between 25 and 64 years of age (273) are in the labor force, with 2.3% or 5 of them being unemployed. The group with the highest labor force participation rate are those with the educational attainment of less than high school, with 100.0% or 5 individuals in the labor force. Within the labor force, individuals with less than high school education have the highest percentage of unemployment, with 40.0% or 2 of them being unemployed.
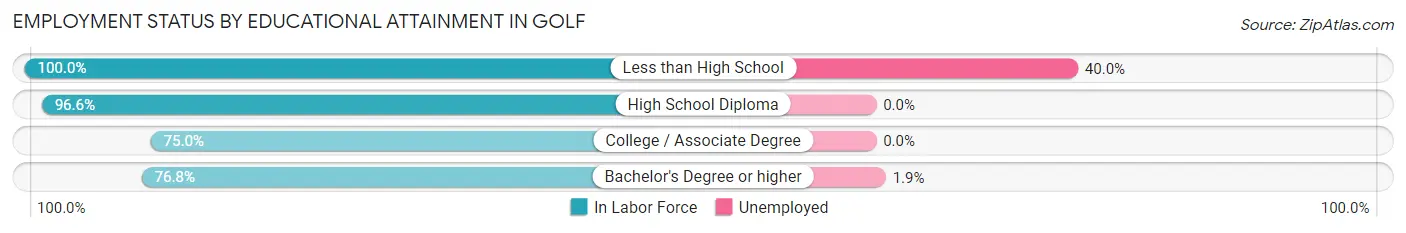
| Educational Attainment | In Labor Force | Unemployed |
| Less than High School | 5 (100.0%) | 2 (40.0%) |
| High School Diploma | 28 (96.6%) | 0 (0.0%) |
| College / Associate Degree | 24 (75.0%) | 0 (0.0%) |
| Bachelor's Degree or higher | 159 (76.8%) | 4 (1.9%) |
| Total | 216 (79.1%) | 6 (2.3%) |
Employment Occupations by Sex in Golf
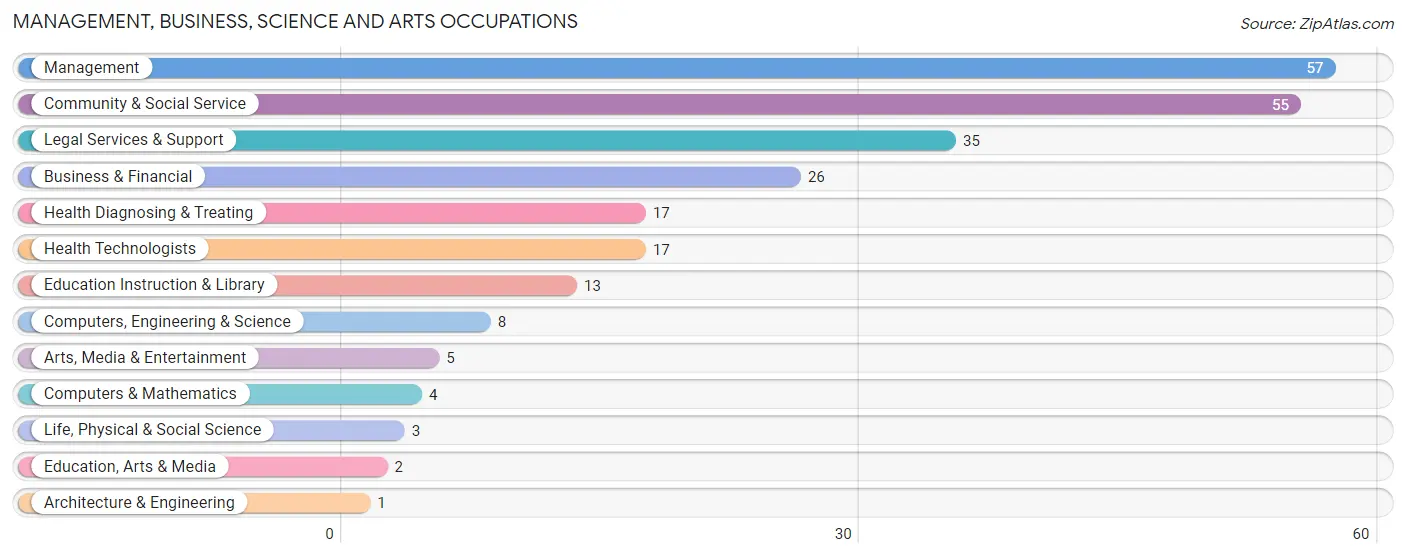
Management, Business, Science and Arts Occupations
The most common Management, Business, Science and Arts occupations in Golf are Management (57 | 21.6%), Community & Social Service (55 | 20.8%), Legal Services & Support (35 | 13.3%), Business & Financial (26 | 9.9%), and Health Diagnosing & Treating (17 | 6.4%).
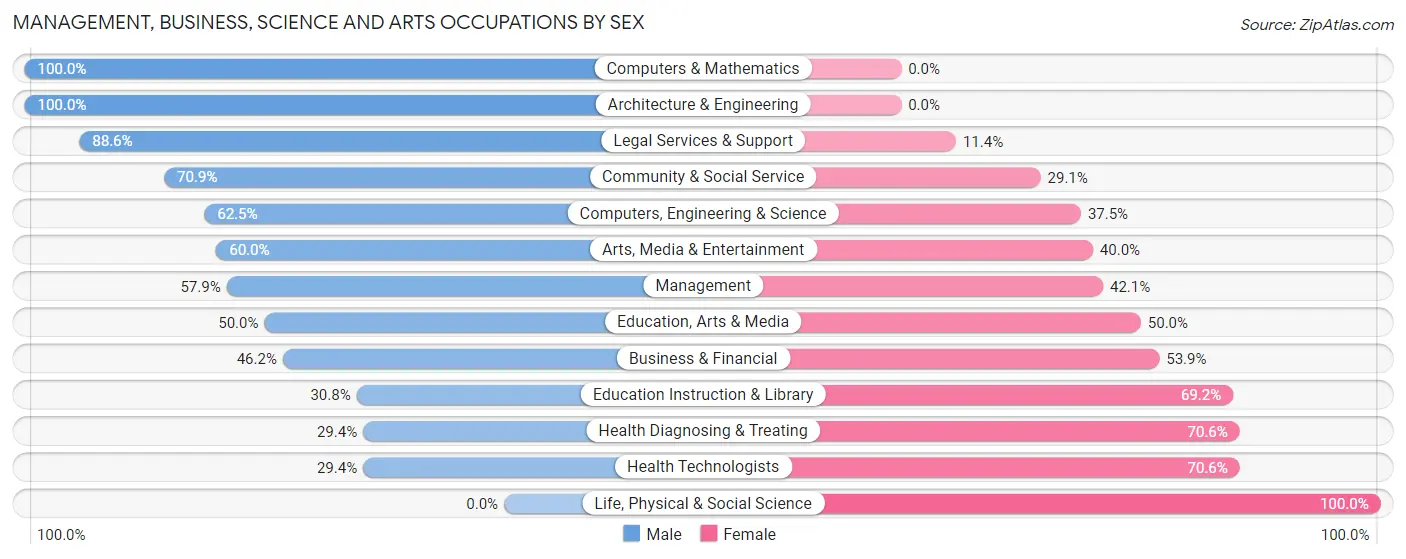
Management, Business, Science and Arts Occupations by Sex
Within the Management, Business, Science and Arts occupations in Golf, the most male-oriented occupations are Computers & Mathematics (100.0%), Architecture & Engineering (100.0%), and Legal Services & Support (88.6%), while the most female-oriented occupations are Life, Physical & Social Science (100.0%), Health Diagnosing & Treating (70.6%), and Health Technologists (70.6%).
| Occupation | Male | Female |
| Management | 33 (57.9%) | 24 (42.1%) |
| Business & Financial | 12 (46.2%) | 14 (53.8%) |
| Computers, Engineering & Science | 5 (62.5%) | 3 (37.5%) |
| Computers & Mathematics | 4 (100.0%) | 0 (0.0%) |
| Architecture & Engineering | 1 (100.0%) | 0 (0.0%) |
| Life, Physical & Social Science | 0 (0.0%) | 3 (100.0%) |
| Community & Social Service | 39 (70.9%) | 16 (29.1%) |
| Education, Arts & Media | 1 (50.0%) | 1 (50.0%) |
| Legal Services & Support | 31 (88.6%) | 4 (11.4%) |
| Education Instruction & Library | 4 (30.8%) | 9 (69.2%) |
| Arts, Media & Entertainment | 3 (60.0%) | 2 (40.0%) |
| Health Diagnosing & Treating | 5 (29.4%) | 12 (70.6%) |
| Health Technologists | 5 (29.4%) | 12 (70.6%) |
| Total (Category) | 94 (57.7%) | 69 (42.3%) |
| Total (Overall) | 170 (64.4%) | 94 (35.6%) |
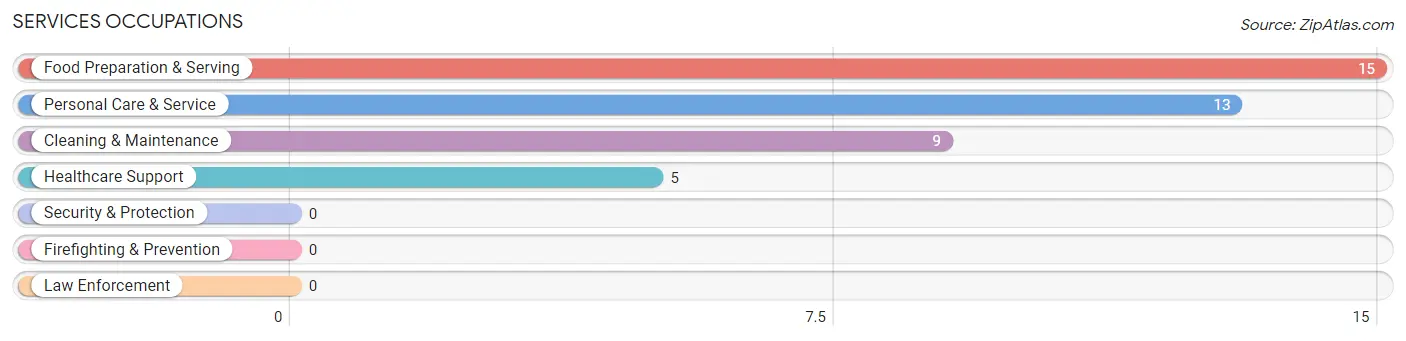
Services Occupations
The most common Services occupations in Golf are Food Preparation & Serving (15 | 5.7%), Personal Care & Service (13 | 4.9%), Cleaning & Maintenance (9 | 3.4%), and Healthcare Support (5 | 1.9%).
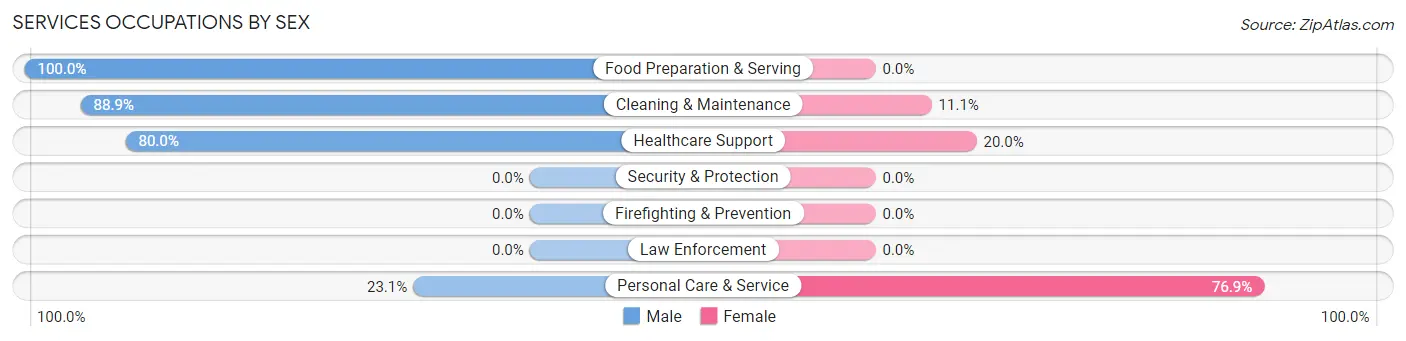
Services Occupations by Sex
Within the Services occupations in Golf, the most male-oriented occupations are Food Preparation & Serving (100.0%), Cleaning & Maintenance (88.9%), and Healthcare Support (80.0%), while the most female-oriented occupations are Personal Care & Service (76.9%), Healthcare Support (20.0%), and Cleaning & Maintenance (11.1%).
| Occupation | Male | Female |
| Healthcare Support | 4 (80.0%) | 1 (20.0%) |
| Security & Protection | 0 (0.0%) | 0 (0.0%) |
| Firefighting & Prevention | 0 (0.0%) | 0 (0.0%) |
| Law Enforcement | 0 (0.0%) | 0 (0.0%) |
| Food Preparation & Serving | 15 (100.0%) | 0 (0.0%) |
| Cleaning & Maintenance | 8 (88.9%) | 1 (11.1%) |
| Personal Care & Service | 3 (23.1%) | 10 (76.9%) |
| Total (Category) | 30 (71.4%) | 12 (28.6%) |
| Total (Overall) | 170 (64.4%) | 94 (35.6%) |
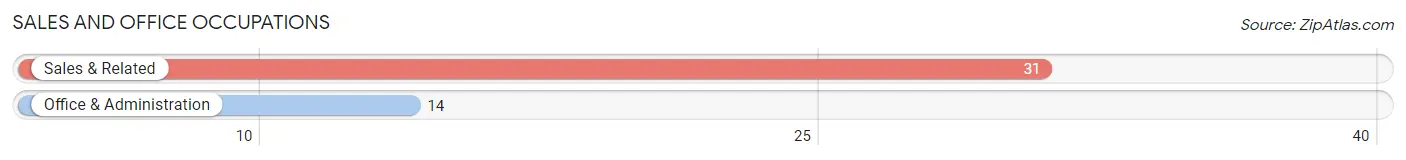
Sales and Office Occupations
The most common Sales and Office occupations in Golf are Sales & Related (31 | 11.7%), and Office & Administration (14 | 5.3%).
Sales and Office Occupations by Sex
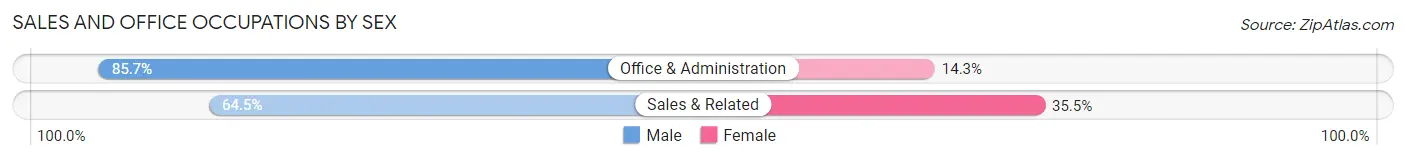
| Occupation | Male | Female |
| Sales & Related | 20 (64.5%) | 11 (35.5%) |
| Office & Administration | 12 (85.7%) | 2 (14.3%) |
| Total (Category) | 32 (71.1%) | 13 (28.9%) |
| Total (Overall) | 170 (64.4%) | 94 (35.6%) |
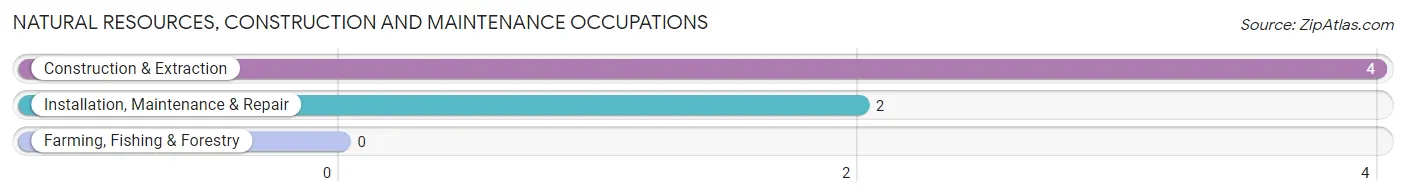
Natural Resources, Construction and Maintenance Occupations
The most common Natural Resources, Construction and Maintenance occupations in Golf are Construction & Extraction (4 | 1.5%), and Installation, Maintenance & Repair (2 | 0.8%).
Natural Resources, Construction and Maintenance Occupations by Sex
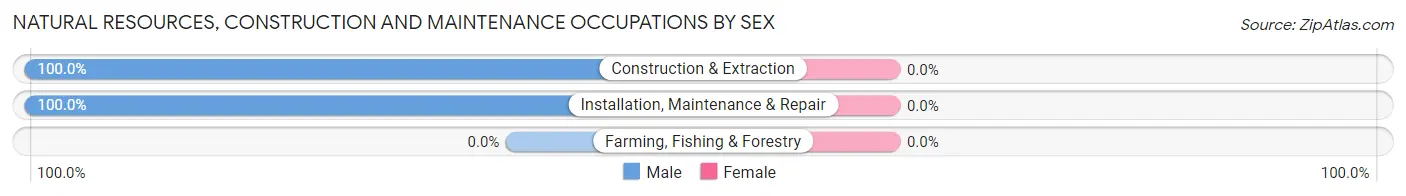
| Occupation | Male | Female |
| Farming, Fishing & Forestry | 0 (0.0%) | 0 (0.0%) |
| Construction & Extraction | 4 (100.0%) | 0 (0.0%) |
| Installation, Maintenance & Repair | 2 (100.0%) | 0 (0.0%) |
| Total (Category) | 6 (100.0%) | 0 (0.0%) |
| Total (Overall) | 170 (64.4%) | 94 (35.6%) |
Production, Transportation and Moving Occupations
The most common Production, Transportation and Moving occupations in Golf are Material Moving (5 | 1.9%), and Transportation (3 | 1.1%).
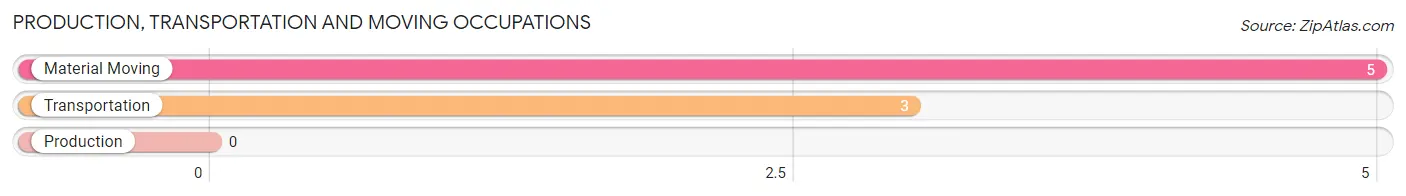
Production, Transportation and Moving Occupations by Sex
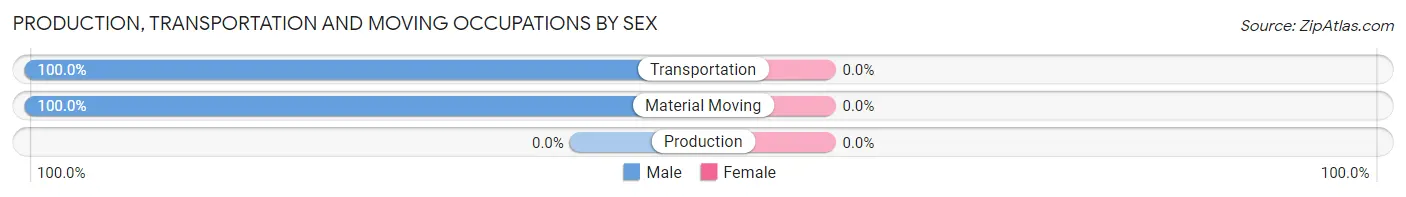
| Occupation | Male | Female |
| Production | 0 (0.0%) | 0 (0.0%) |
| Transportation | 3 (100.0%) | 0 (0.0%) |
| Material Moving | 5 (100.0%) | 0 (0.0%) |
| Total (Category) | 8 (100.0%) | 0 (0.0%) |
| Total (Overall) | 170 (64.4%) | 94 (35.6%) |
Employment Industries by Sex in Golf
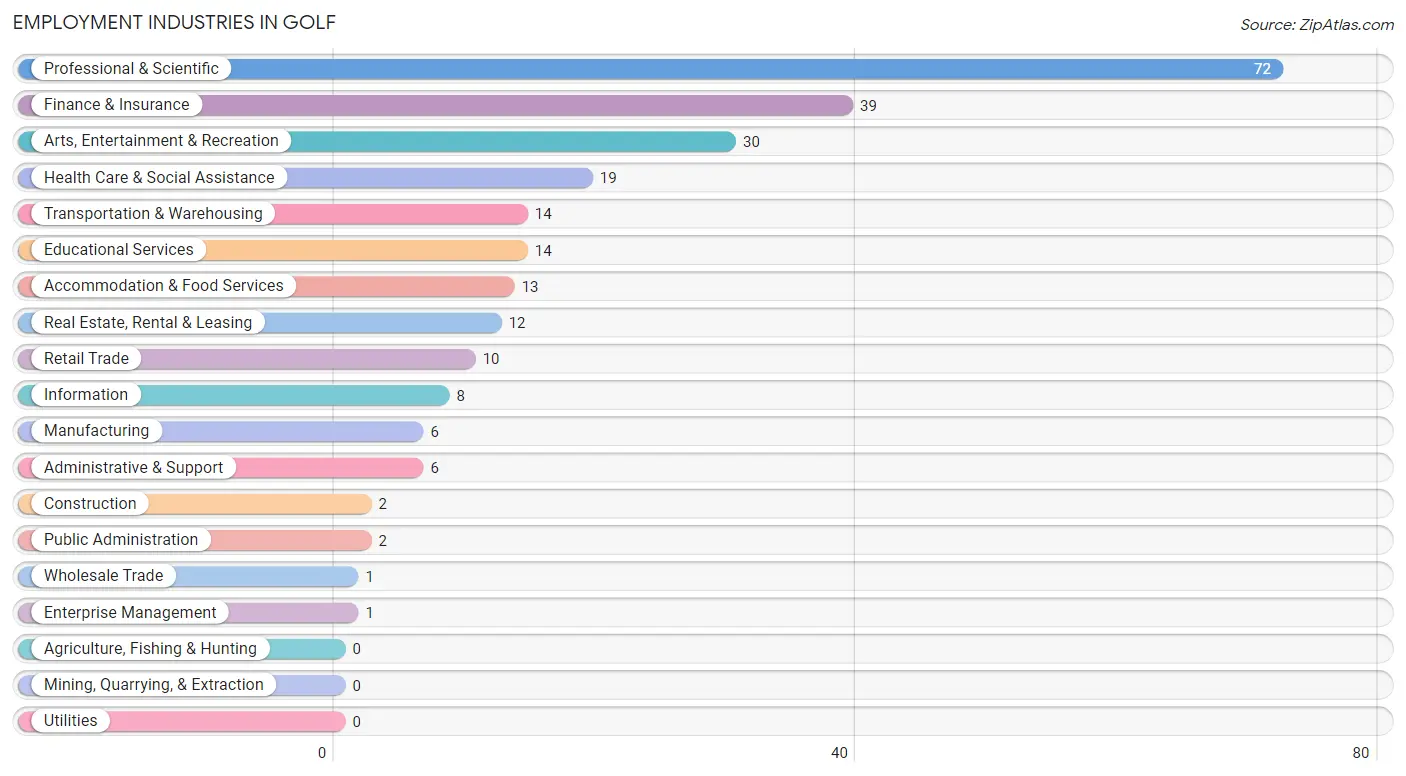
Employment Industries in Golf
The major employment industries in Golf include Professional & Scientific (72 | 27.3%), Finance & Insurance (39 | 14.8%), Arts, Entertainment & Recreation (30 | 11.4%), Health Care & Social Assistance (19 | 7.2%), and Transportation & Warehousing (14 | 5.3%).
Employment Industries by Sex in Golf
The Golf industries that see more men than women are Construction (100.0%), Manufacturing (100.0%), and Transportation & Warehousing (100.0%), whereas the industries that tend to have a higher number of women are Wholesale Trade (100.0%), Enterprise Management (100.0%), and Administrative & Support (100.0%).
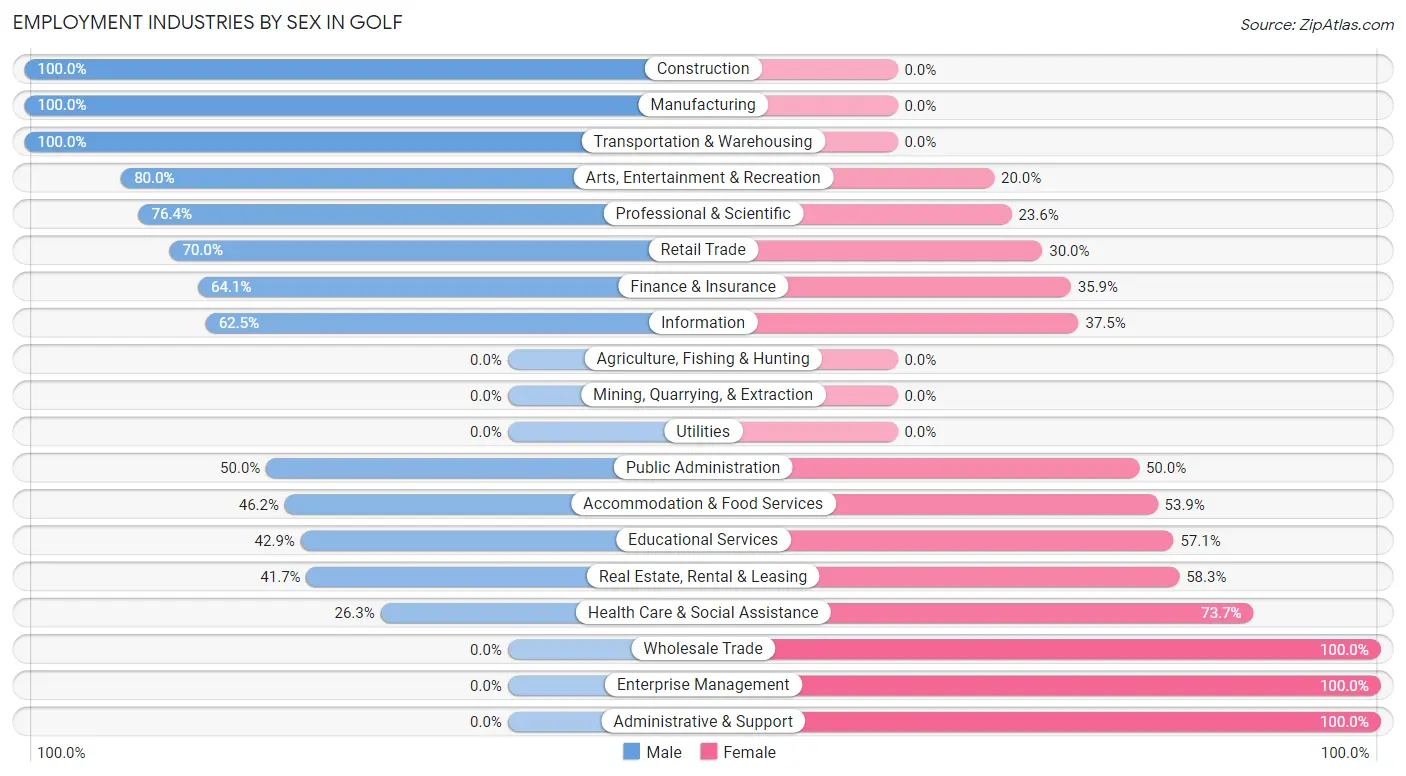
| Industry | Male | Female |
| Agriculture, Fishing & Hunting | 0 (0.0%) | 0 (0.0%) |
| Mining, Quarrying, & Extraction | 0 (0.0%) | 0 (0.0%) |
| Construction | 2 (100.0%) | 0 (0.0%) |
| Manufacturing | 6 (100.0%) | 0 (0.0%) |
| Wholesale Trade | 0 (0.0%) | 1 (100.0%) |
| Retail Trade | 7 (70.0%) | 3 (30.0%) |
| Transportation & Warehousing | 14 (100.0%) | 0 (0.0%) |
| Utilities | 0 (0.0%) | 0 (0.0%) |
| Information | 5 (62.5%) | 3 (37.5%) |
| Finance & Insurance | 25 (64.1%) | 14 (35.9%) |
| Real Estate, Rental & Leasing | 5 (41.7%) | 7 (58.3%) |
| Professional & Scientific | 55 (76.4%) | 17 (23.6%) |
| Enterprise Management | 0 (0.0%) | 1 (100.0%) |
| Administrative & Support | 0 (0.0%) | 6 (100.0%) |
| Educational Services | 6 (42.9%) | 8 (57.1%) |
| Health Care & Social Assistance | 5 (26.3%) | 14 (73.7%) |
| Arts, Entertainment & Recreation | 24 (80.0%) | 6 (20.0%) |
| Accommodation & Food Services | 6 (46.2%) | 7 (53.8%) |
| Public Administration | 1 (50.0%) | 1 (50.0%) |
| Total | 170 (64.4%) | 94 (35.6%) |
Education in Golf
School Enrollment in Golf
The most common levels of schooling among the 162 students in Golf are high school (53 | 32.7%), middle school (39 | 24.1%), and elementary school (27 | 16.7%).
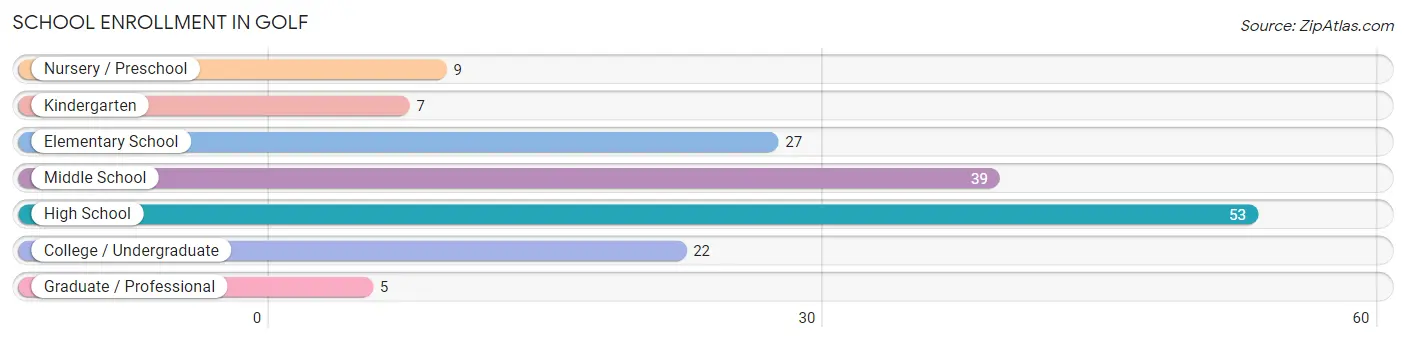
| School Level | # Students | % Students |
| Nursery / Preschool | 9 | 5.6% |
| Kindergarten | 7 | 4.3% |
| Elementary School | 27 | 16.7% |
| Middle School | 39 | 24.1% |
| High School | 53 | 32.7% |
| College / Undergraduate | 22 | 13.6% |
| Graduate / Professional | 5 | 3.1% |
| Total | 162 | 100.0% |
School Enrollment by Age by Funding Source in Golf
Out of a total of 162 students who are enrolled in schools in Golf, 61 (37.7%) attend a private institution, while the remaining 101 (62.3%) are enrolled in public schools. The age group of 3 to 4 year olds has the highest likelihood of being enrolled in private schools, with 7 (87.5% in the age bracket) enrolled. Conversely, the age group of 18 to 19 year olds has the lowest likelihood of being enrolled in a private school, with 14 (82.4% in the age bracket) attending a public institution.
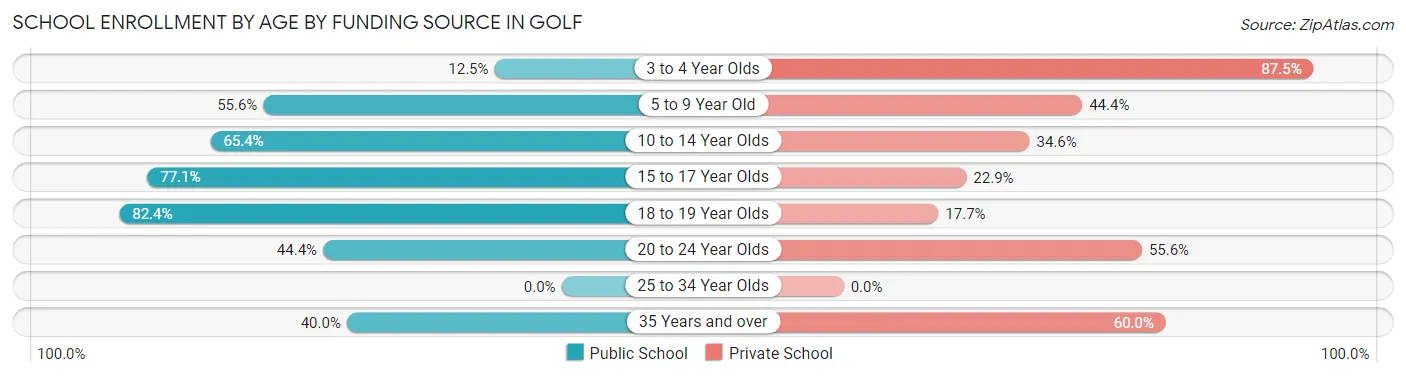
| Age Bracket | Public School | Private School |
| 3 to 4 Year Olds | 1 (12.5%) | 7 (87.5%) |
| 5 to 9 Year Old | 15 (55.6%) | 12 (44.4%) |
| 10 to 14 Year Olds | 34 (65.4%) | 18 (34.6%) |
| 15 to 17 Year Olds | 27 (77.1%) | 8 (22.9%) |
| 18 to 19 Year Olds | 14 (82.4%) | 3 (17.6%) |
| 20 to 24 Year Olds | 8 (44.4%) | 10 (55.6%) |
| 25 to 34 Year Olds | 0 (0.0%) | 0 (0.0%) |
| 35 Years and over | 2 (40.0%) | 3 (60.0%) |
| Total | 101 (62.3%) | 61 (37.7%) |
Educational Attainment by Field of Study in Golf
Business (86 | 29.3%), communications (33 | 11.3%), physical & health sciences (31 | 10.6%), science & technology (24 | 8.2%), and social sciences (23 | 7.9%) are the most common fields of study among 293 individuals in Golf who have obtained a bachelor's degree or higher.
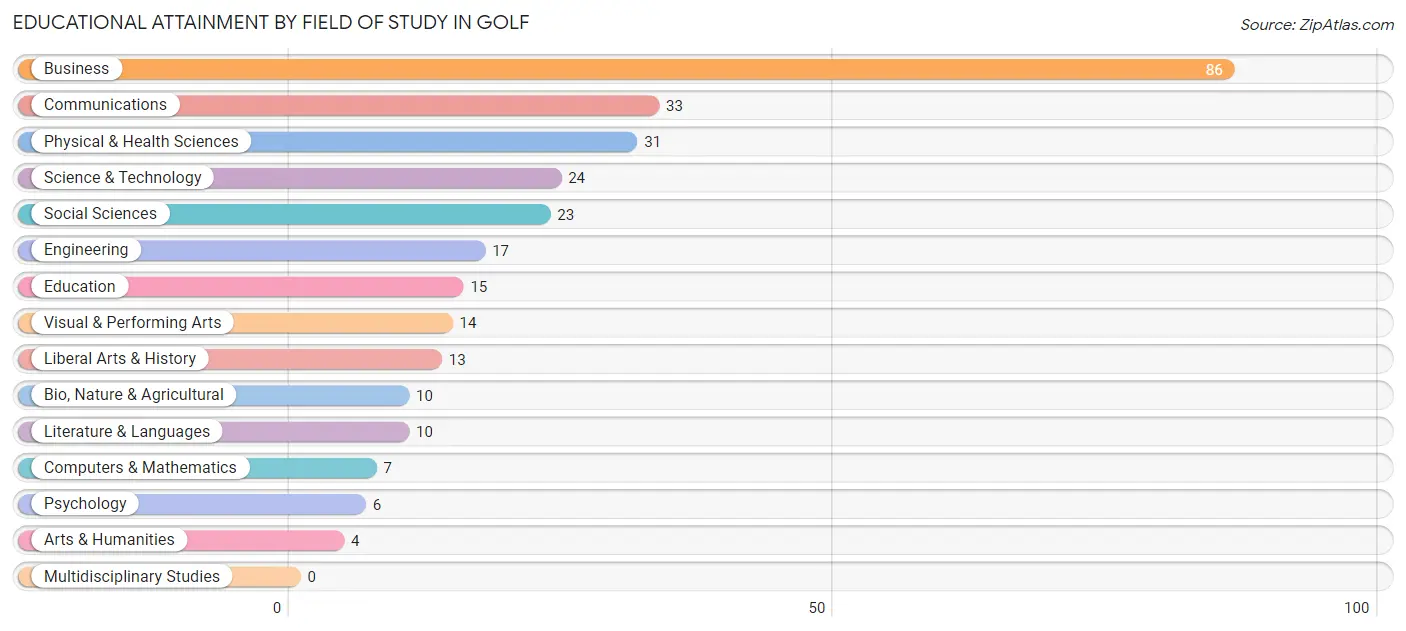
| Field of Study | # Graduates | % Graduates |
| Computers & Mathematics | 7 | 2.4% |
| Bio, Nature & Agricultural | 10 | 3.4% |
| Physical & Health Sciences | 31 | 10.6% |
| Psychology | 6 | 2.1% |
| Social Sciences | 23 | 7.9% |
| Engineering | 17 | 5.8% |
| Multidisciplinary Studies | 0 | 0.0% |
| Science & Technology | 24 | 8.2% |
| Business | 86 | 29.3% |
| Education | 15 | 5.1% |
| Literature & Languages | 10 | 3.4% |
| Liberal Arts & History | 13 | 4.4% |
| Visual & Performing Arts | 14 | 4.8% |
| Communications | 33 | 11.3% |
| Arts & Humanities | 4 | 1.4% |
| Total | 293 | 100.0% |
Transportation & Commute in Golf
Vehicle Availability by Sex in Golf
The most prevalent vehicle ownership categories in Golf are males with 2 vehicles (69, accounting for 46.6%) and females with 2 vehicles (51, making up 75.0%).
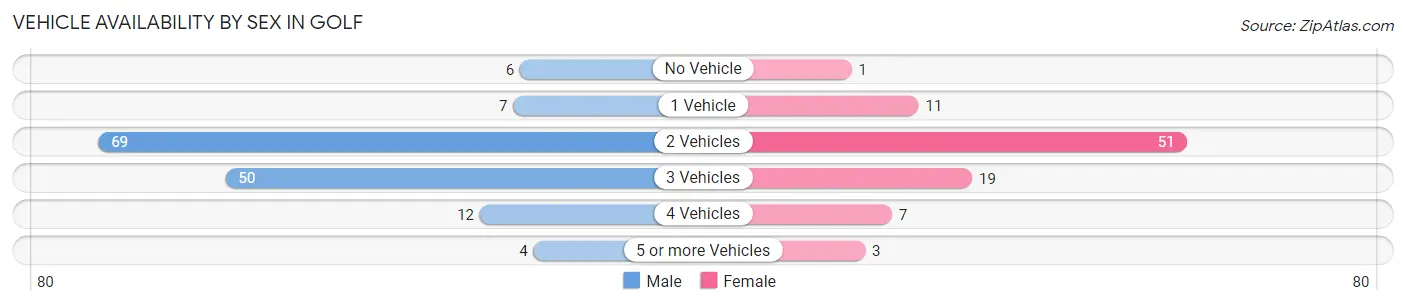
| Vehicles Available | Male | Female |
| No Vehicle | 6 (4.1%) | 1 (1.1%) |
| 1 Vehicle | 7 (4.7%) | 11 (12.0%) |
| 2 Vehicles | 69 (46.6%) | 51 (55.4%) |
| 3 Vehicles | 50 (33.8%) | 19 (20.6%) |
| 4 Vehicles | 12 (8.1%) | 7 (7.6%) |
| 5 or more Vehicles | 4 (2.7%) | 3 (3.3%) |
| Total | 148 (100.0%) | 92 (100.0%) |
Commute Time in Golf
The most frequently occuring commute durations in Golf are 45 to 59 minutes (55 commuters, 30.7%), 30 to 34 minutes (29 commuters, 16.2%), and 20 to 24 minutes (21 commuters, 11.7%).
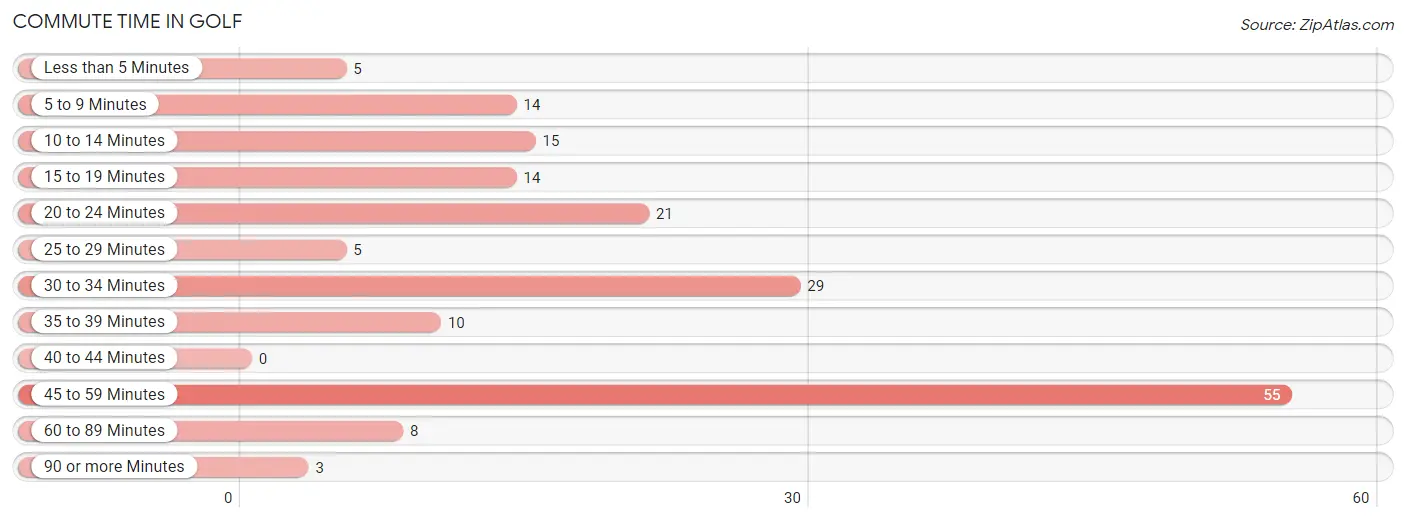
| Commute Time | # Commuters | % Commuters |
| Less than 5 Minutes | 5 | 2.8% |
| 5 to 9 Minutes | 14 | 7.8% |
| 10 to 14 Minutes | 15 | 8.4% |
| 15 to 19 Minutes | 14 | 7.8% |
| 20 to 24 Minutes | 21 | 11.7% |
| 25 to 29 Minutes | 5 | 2.8% |
| 30 to 34 Minutes | 29 | 16.2% |
| 35 to 39 Minutes | 10 | 5.6% |
| 40 to 44 Minutes | 0 | 0.0% |
| 45 to 59 Minutes | 55 | 30.7% |
| 60 to 89 Minutes | 8 | 4.5% |
| 90 or more Minutes | 3 | 1.7% |
Commute Time by Sex in Golf
The most common commute times in Golf are 45 to 59 minutes (52 commuters, 46.0%) for males and 20 to 24 minutes (14 commuters, 21.2%) for females.
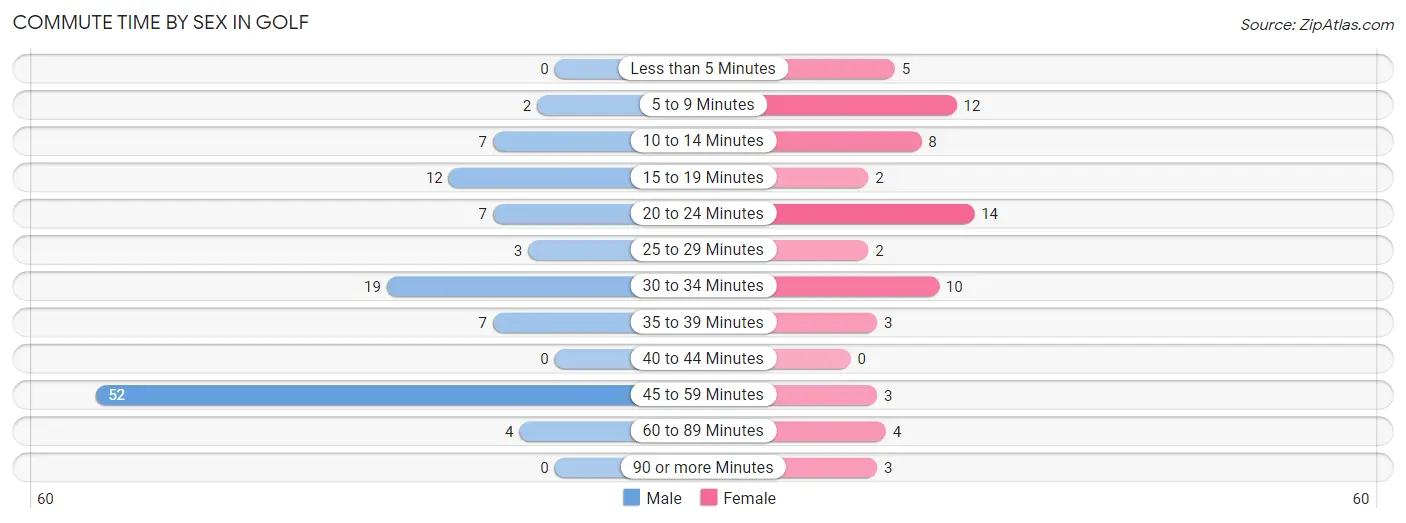
| Commute Time | Male | Female |
| Less than 5 Minutes | 0 (0.0%) | 5 (7.6%) |
| 5 to 9 Minutes | 2 (1.8%) | 12 (18.2%) |
| 10 to 14 Minutes | 7 (6.2%) | 8 (12.1%) |
| 15 to 19 Minutes | 12 (10.6%) | 2 (3.0%) |
| 20 to 24 Minutes | 7 (6.2%) | 14 (21.2%) |
| 25 to 29 Minutes | 3 (2.6%) | 2 (3.0%) |
| 30 to 34 Minutes | 19 (16.8%) | 10 (15.1%) |
| 35 to 39 Minutes | 7 (6.2%) | 3 (4.5%) |
| 40 to 44 Minutes | 0 (0.0%) | 0 (0.0%) |
| 45 to 59 Minutes | 52 (46.0%) | 3 (4.5%) |
| 60 to 89 Minutes | 4 (3.5%) | 4 (6.1%) |
| 90 or more Minutes | 0 (0.0%) | 3 (4.5%) |
Time of Departure to Work by Sex in Golf
The most frequent times of departure to work in Golf are 7:30 AM to 7:59 AM (39, 34.5%) for males and 9:00 AM to 9:59 AM (16, 24.2%) for females.
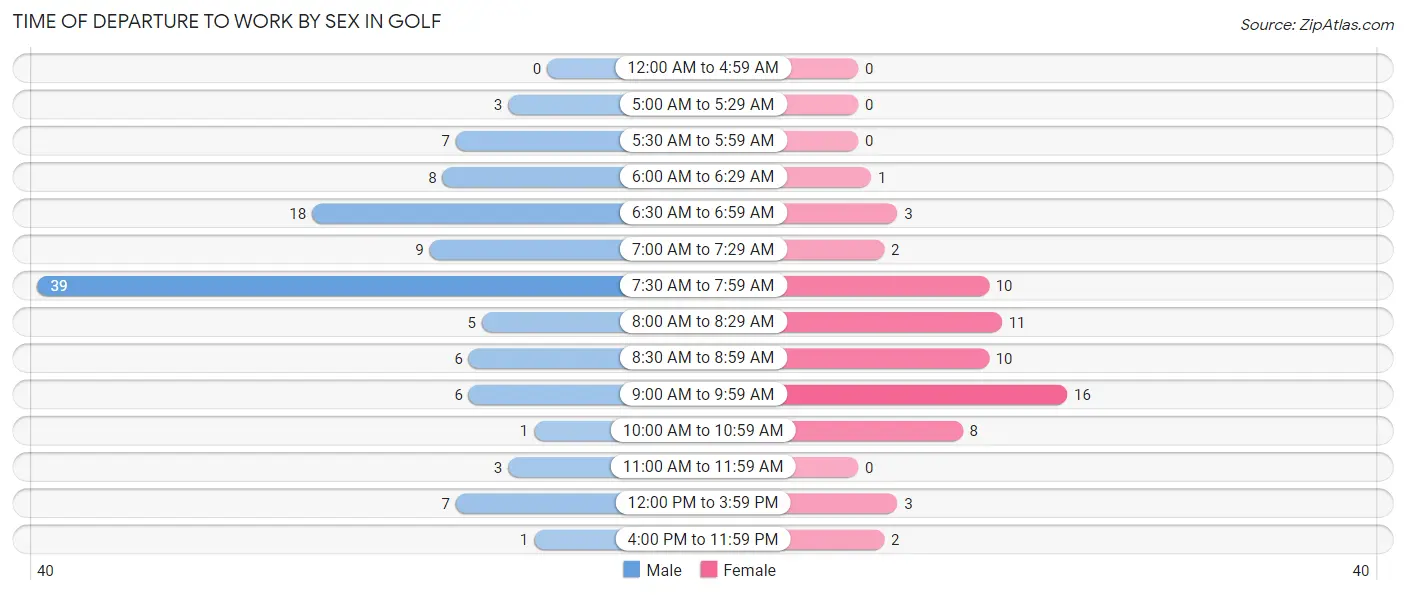
| Time of Departure | Male | Female |
| 12:00 AM to 4:59 AM | 0 (0.0%) | 0 (0.0%) |
| 5:00 AM to 5:29 AM | 3 (2.6%) | 0 (0.0%) |
| 5:30 AM to 5:59 AM | 7 (6.2%) | 0 (0.0%) |
| 6:00 AM to 6:29 AM | 8 (7.1%) | 1 (1.5%) |
| 6:30 AM to 6:59 AM | 18 (15.9%) | 3 (4.5%) |
| 7:00 AM to 7:29 AM | 9 (8.0%) | 2 (3.0%) |
| 7:30 AM to 7:59 AM | 39 (34.5%) | 10 (15.1%) |
| 8:00 AM to 8:29 AM | 5 (4.4%) | 11 (16.7%) |
| 8:30 AM to 8:59 AM | 6 (5.3%) | 10 (15.1%) |
| 9:00 AM to 9:59 AM | 6 (5.3%) | 16 (24.2%) |
| 10:00 AM to 10:59 AM | 1 (0.9%) | 8 (12.1%) |
| 11:00 AM to 11:59 AM | 3 (2.6%) | 0 (0.0%) |
| 12:00 PM to 3:59 PM | 7 (6.2%) | 3 (4.5%) |
| 4:00 PM to 11:59 PM | 1 (0.9%) | 2 (3.0%) |
| Total | 113 (100.0%) | 66 (100.0%) |
Housing Occupancy in Golf
Occupancy by Ownership in Golf
Of the total 194 dwellings in Golf, owner-occupied units account for 188 (96.9%), while renter-occupied units make up 6 (3.1%).
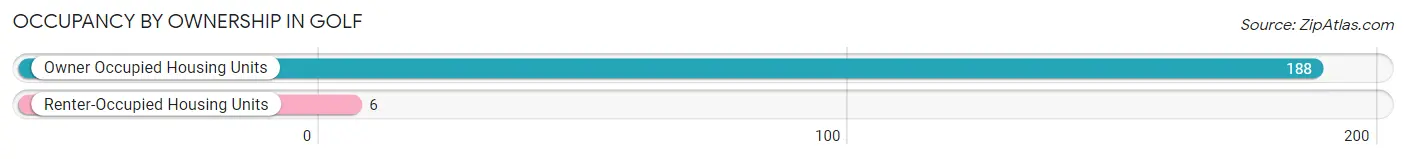
| Occupancy | # Housing Units | % Housing Units |
| Owner Occupied Housing Units | 188 | 96.9% |
| Renter-Occupied Housing Units | 6 | 3.1% |
| Total Occupied Housing Units | 194 | 100.0% |
Occupancy by Household Size in Golf
| Household Size | # Housing Units | % Housing Units |
| 1-Person Household | 34 | 17.5% |
| 2-Person Household | 87 | 44.9% |
| 3-Person Household | 16 | 8.3% |
| 4+ Person Household | 57 | 29.4% |
| Total Housing Units | 194 | 100.0% |
Occupancy by Ownership by Household Size in Golf
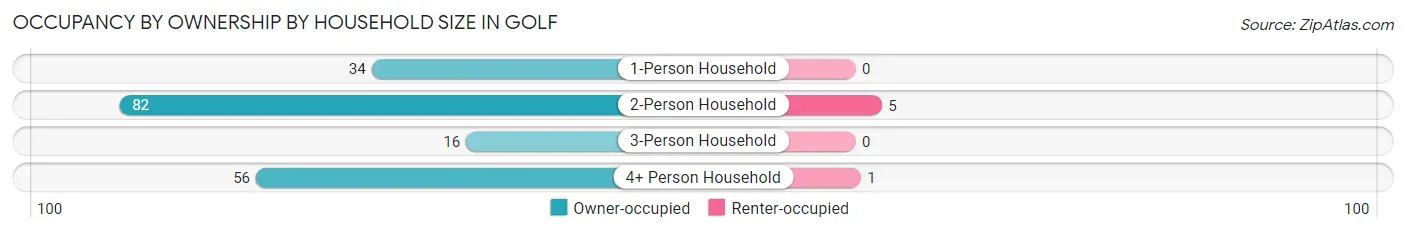
| Household Size | Owner-occupied | Renter-occupied |
| 1-Person Household | 34 (100.0%) | 0 (0.0%) |
| 2-Person Household | 82 (94.3%) | 5 (5.8%) |
| 3-Person Household | 16 (100.0%) | 0 (0.0%) |
| 4+ Person Household | 56 (98.3%) | 1 (1.8%) |
| Total Housing Units | 188 (96.9%) | 6 (3.1%) |
Occupancy by Educational Attainment in Golf
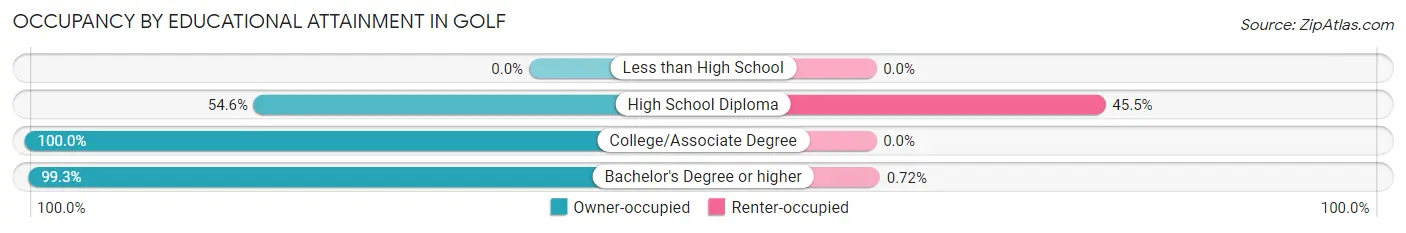
| Household Size | Owner-occupied | Renter-occupied |
| Less than High School | 0 (0.0%) | 0 (0.0%) |
| High School Diploma | 6 (54.5%) | 5 (45.5%) |
| College/Associate Degree | 45 (100.0%) | 0 (0.0%) |
| Bachelor's Degree or higher | 137 (99.3%) | 1 (0.7%) |
Occupancy by Age of Householder in Golf
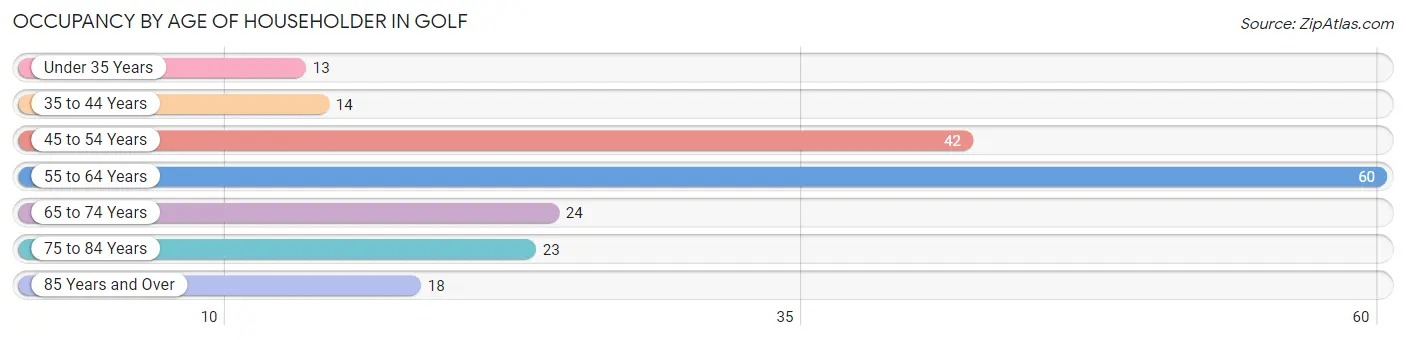
| Age Bracket | # Households | % Households |
| Under 35 Years | 13 | 6.7% |
| 35 to 44 Years | 14 | 7.2% |
| 45 to 54 Years | 42 | 21.6% |
| 55 to 64 Years | 60 | 30.9% |
| 65 to 74 Years | 24 | 12.4% |
| 75 to 84 Years | 23 | 11.9% |
| 85 Years and Over | 18 | 9.3% |
| Total | 194 | 100.0% |
Housing Finances in Golf
Median Income by Occupancy in Golf
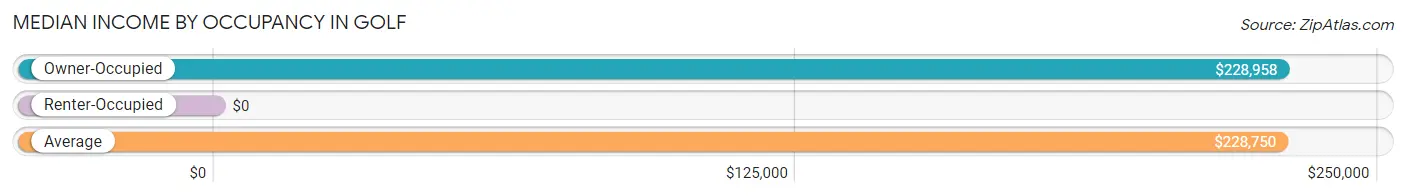
| Occupancy Type | # Households | Median Income |
| Owner-Occupied | 188 (96.9%) | $228,958 |
| Renter-Occupied | 6 (3.1%) | $0 |
| Average | 194 (100.0%) | $228,750 |
Occupancy by Householder Income Bracket in Golf
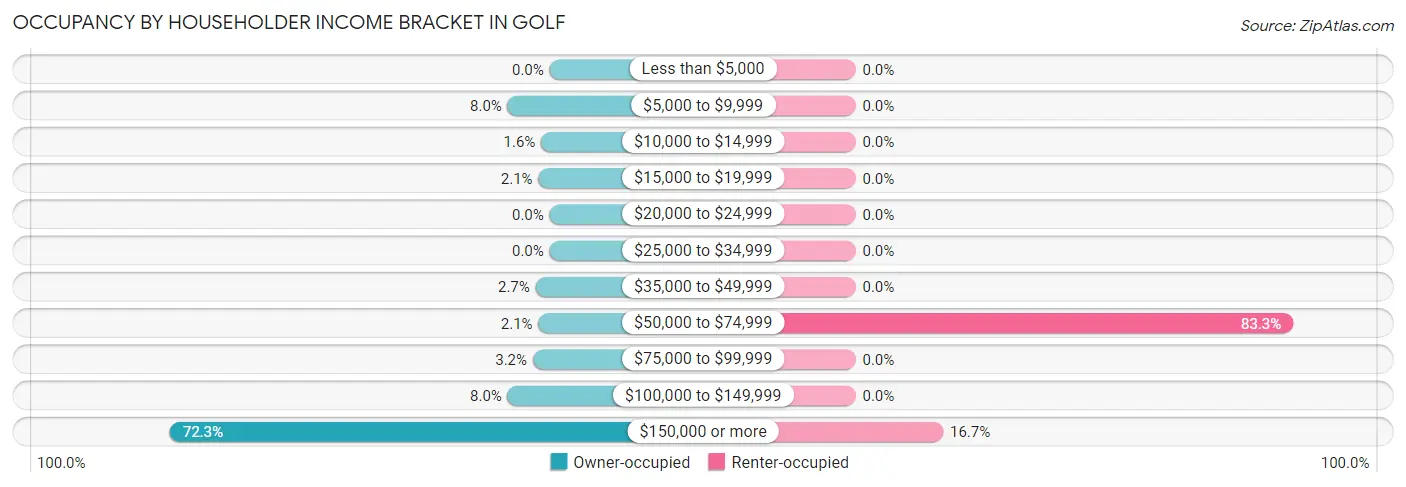
| Income Bracket | Owner-occupied | Renter-occupied |
| Less than $5,000 | 0 (0.0%) | 0 (0.0%) |
| $5,000 to $9,999 | 15 (8.0%) | 0 (0.0%) |
| $10,000 to $14,999 | 3 (1.6%) | 0 (0.0%) |
| $15,000 to $19,999 | 4 (2.1%) | 0 (0.0%) |
| $20,000 to $24,999 | 0 (0.0%) | 0 (0.0%) |
| $25,000 to $34,999 | 0 (0.0%) | 0 (0.0%) |
| $35,000 to $49,999 | 5 (2.7%) | 0 (0.0%) |
| $50,000 to $74,999 | 4 (2.1%) | 5 (83.3%) |
| $75,000 to $99,999 | 6 (3.2%) | 0 (0.0%) |
| $100,000 to $149,999 | 15 (8.0%) | 0 (0.0%) |
| $150,000 or more | 136 (72.3%) | 1 (16.7%) |
| Total | 188 (100.0%) | 6 (100.0%) |
Monthly Housing Cost Tiers in Golf
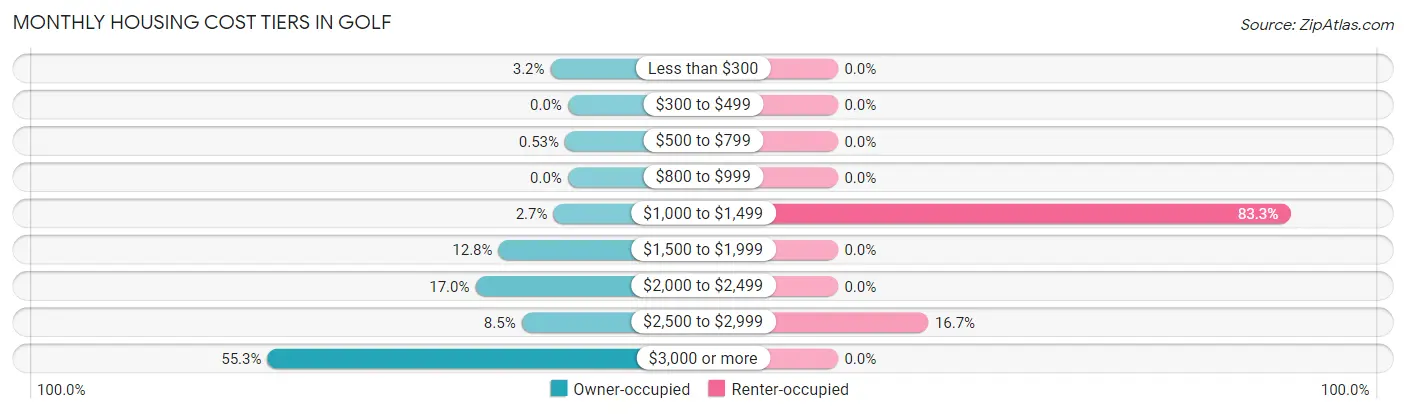
| Monthly Cost | Owner-occupied | Renter-occupied |
| Less than $300 | 6 (3.2%) | 0 (0.0%) |
| $300 to $499 | 0 (0.0%) | 0 (0.0%) |
| $500 to $799 | 1 (0.5%) | 0 (0.0%) |
| $800 to $999 | 0 (0.0%) | 0 (0.0%) |
| $1,000 to $1,499 | 5 (2.7%) | 5 (83.3%) |
| $1,500 to $1,999 | 24 (12.8%) | 0 (0.0%) |
| $2,000 to $2,499 | 32 (17.0%) | 0 (0.0%) |
| $2,500 to $2,999 | 16 (8.5%) | 1 (16.7%) |
| $3,000 or more | 104 (55.3%) | 0 (0.0%) |
| Total | 188 (100.0%) | 6 (100.0%) |
Physical Housing Characteristics in Golf
Housing Structures in Golf
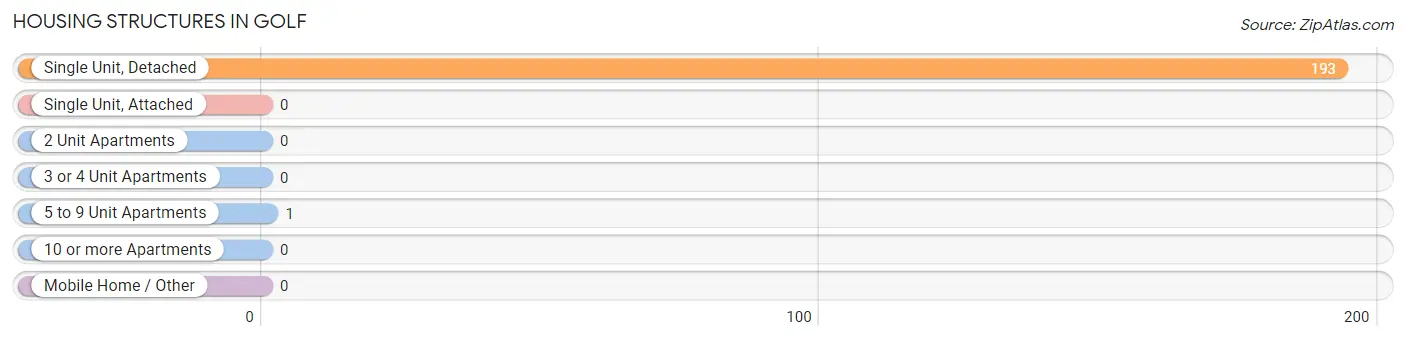
| Structure Type | # Housing Units | % Housing Units |
| Single Unit, Detached | 193 | 99.5% |
| Single Unit, Attached | 0 | 0.0% |
| 2 Unit Apartments | 0 | 0.0% |
| 3 or 4 Unit Apartments | 0 | 0.0% |
| 5 to 9 Unit Apartments | 1 | 0.5% |
| 10 or more Apartments | 0 | 0.0% |
| Mobile Home / Other | 0 | 0.0% |
| Total | 194 | 100.0% |
Housing Structures by Occupancy in Golf
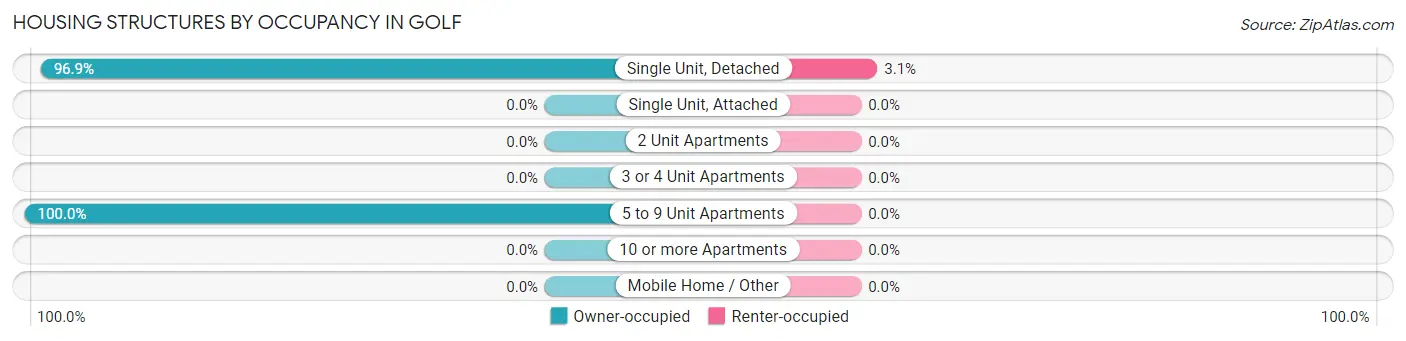
| Structure Type | Owner-occupied | Renter-occupied |
| Single Unit, Detached | 187 (96.9%) | 6 (3.1%) |
| Single Unit, Attached | 0 (0.0%) | 0 (0.0%) |
| 2 Unit Apartments | 0 (0.0%) | 0 (0.0%) |
| 3 or 4 Unit Apartments | 0 (0.0%) | 0 (0.0%) |
| 5 to 9 Unit Apartments | 1 (100.0%) | 0 (0.0%) |
| 10 or more Apartments | 0 (0.0%) | 0 (0.0%) |
| Mobile Home / Other | 0 (0.0%) | 0 (0.0%) |
| Total | 188 (96.9%) | 6 (3.1%) |
Housing Structures by Number of Rooms in Golf
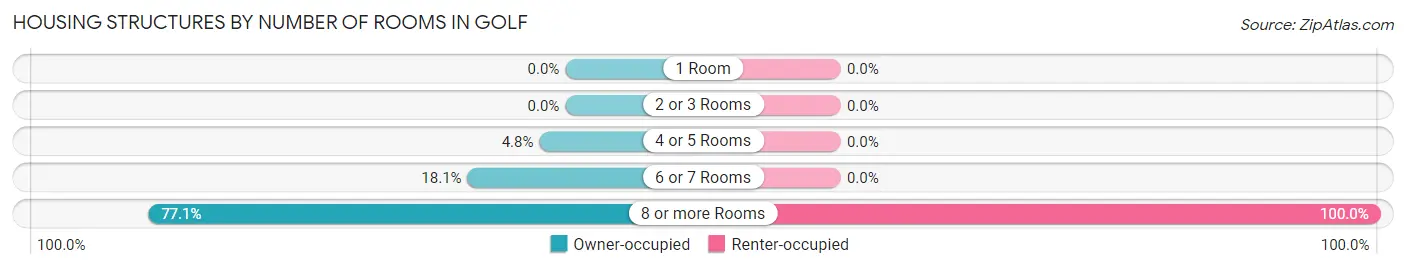
| Number of Rooms | Owner-occupied | Renter-occupied |
| 1 Room | 0 (0.0%) | 0 (0.0%) |
| 2 or 3 Rooms | 0 (0.0%) | 0 (0.0%) |
| 4 or 5 Rooms | 9 (4.8%) | 0 (0.0%) |
| 6 or 7 Rooms | 34 (18.1%) | 0 (0.0%) |
| 8 or more Rooms | 145 (77.1%) | 6 (100.0%) |
| Total | 188 (100.0%) | 6 (100.0%) |
Housing Structure by Heating Type in Golf
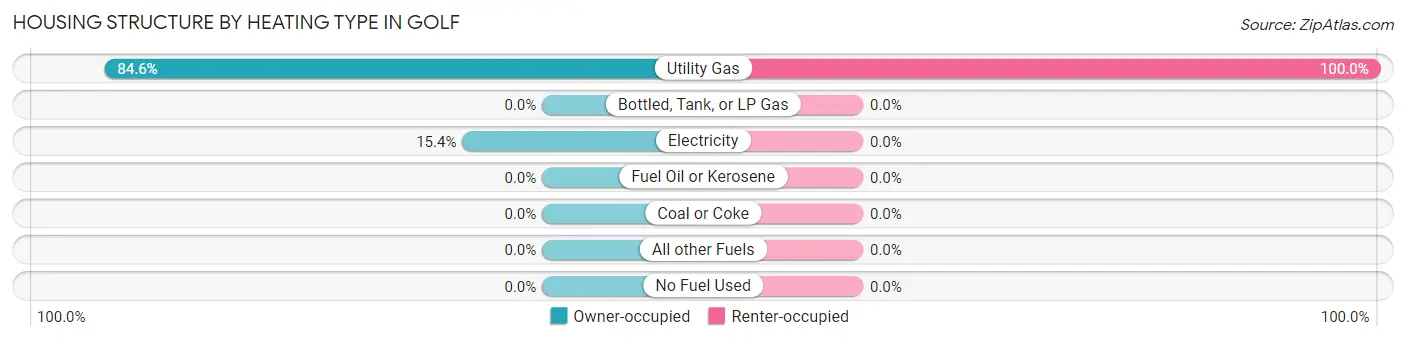
| Heating Type | Owner-occupied | Renter-occupied |
| Utility Gas | 159 (84.6%) | 6 (100.0%) |
| Bottled, Tank, or LP Gas | 0 (0.0%) | 0 (0.0%) |
| Electricity | 29 (15.4%) | 0 (0.0%) |
| Fuel Oil or Kerosene | 0 (0.0%) | 0 (0.0%) |
| Coal or Coke | 0 (0.0%) | 0 (0.0%) |
| All other Fuels | 0 (0.0%) | 0 (0.0%) |
| No Fuel Used | 0 (0.0%) | 0 (0.0%) |
| Total | 188 (100.0%) | 6 (100.0%) |
Household Vehicle Usage in Golf
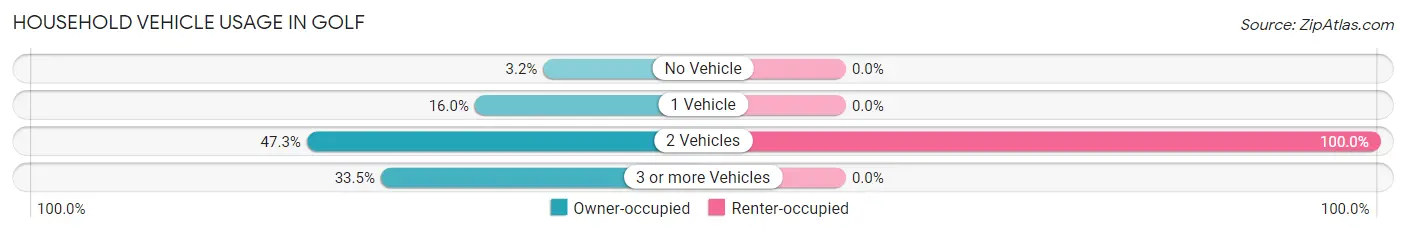
| Vehicles per Household | Owner-occupied | Renter-occupied |
| No Vehicle | 6 (3.2%) | 0 (0.0%) |
| 1 Vehicle | 30 (16.0%) | 0 (0.0%) |
| 2 Vehicles | 89 (47.3%) | 6 (100.0%) |
| 3 or more Vehicles | 63 (33.5%) | 0 (0.0%) |
| Total | 188 (100.0%) | 6 (100.0%) |
Real Estate & Mortgages in Golf
Real Estate and Mortgage Overview in Golf
| Characteristic | Without Mortgage | With Mortgage |
| Housing Units | 86 | 102 |
| Median Property Value | $828,100 | $1,225,000 |
| Median Household Income | $135,000 | $94 |
| Monthly Housing Costs | $1,501 | $96 |
| Real Estate Taxes | $10,001 | $0 |
Property Value by Mortgage Status in Golf
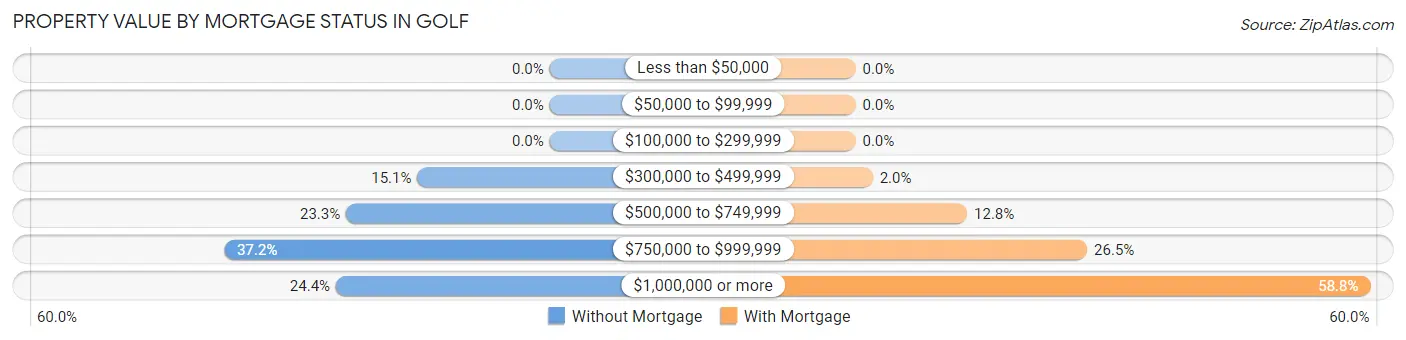
| Property Value | Without Mortgage | With Mortgage |
| Less than $50,000 | 0 (0.0%) | 0 (0.0%) |
| $50,000 to $99,999 | 0 (0.0%) | 0 (0.0%) |
| $100,000 to $299,999 | 0 (0.0%) | 0 (0.0%) |
| $300,000 to $499,999 | 13 (15.1%) | 2 (2.0%) |
| $500,000 to $749,999 | 20 (23.3%) | 13 (12.8%) |
| $750,000 to $999,999 | 32 (37.2%) | 27 (26.5%) |
| $1,000,000 or more | 21 (24.4%) | 60 (58.8%) |
| Total | 86 (100.0%) | 102 (100.0%) |
Household Income by Mortgage Status in Golf
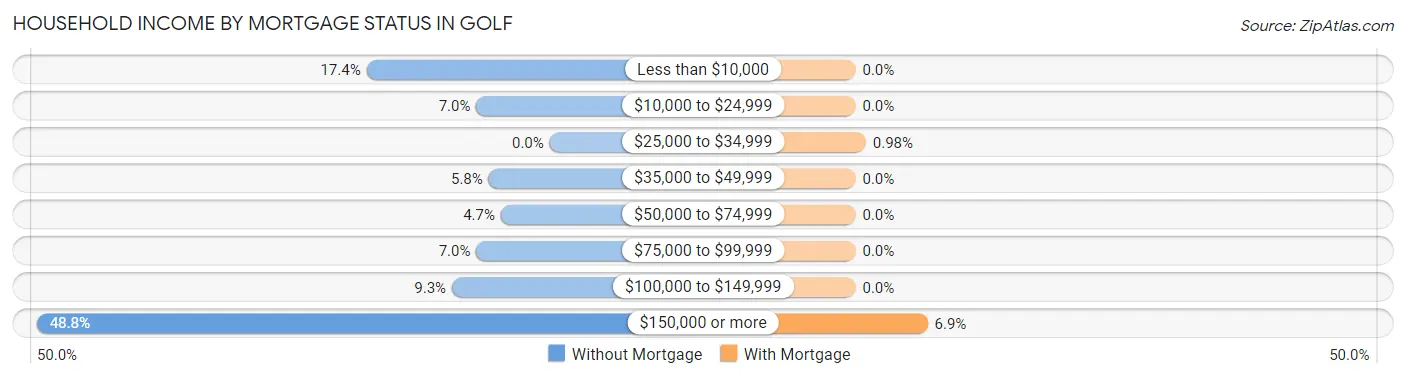
| Household Income | Without Mortgage | With Mortgage |
| Less than $10,000 | 15 (17.4%) | 0 (0.0%) |
| $10,000 to $24,999 | 6 (7.0%) | 0 (0.0%) |
| $25,000 to $34,999 | 0 (0.0%) | 1 (1.0%) |
| $35,000 to $49,999 | 5 (5.8%) | 0 (0.0%) |
| $50,000 to $74,999 | 4 (4.6%) | 0 (0.0%) |
| $75,000 to $99,999 | 6 (7.0%) | 0 (0.0%) |
| $100,000 to $149,999 | 8 (9.3%) | 0 (0.0%) |
| $150,000 or more | 42 (48.8%) | 7 (6.9%) |
| Total | 86 (100.0%) | 102 (100.0%) |
Property Value to Household Income Ratio in Golf
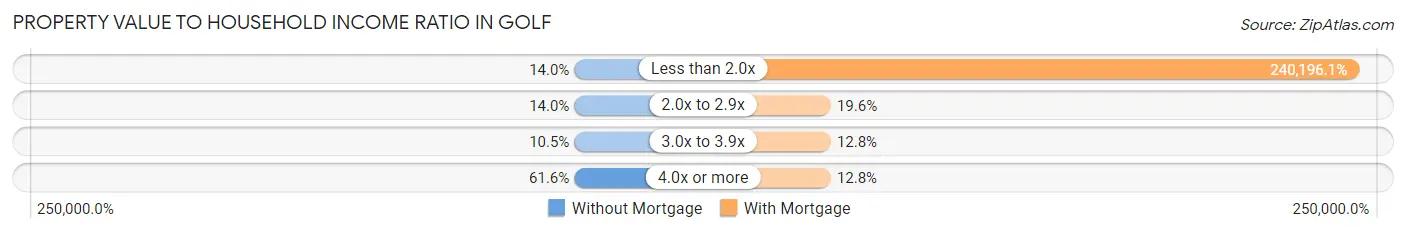
| Value-to-Income Ratio | Without Mortgage | With Mortgage |
| Less than 2.0x | 12 (14.0%) | 245,000 (240,196.1%) |
| 2.0x to 2.9x | 12 (14.0%) | 20 (19.6%) |
| 3.0x to 3.9x | 9 (10.5%) | 13 (12.8%) |
| 4.0x or more | 53 (61.6%) | 13 (12.8%) |
| Total | 86 (100.0%) | 102 (100.0%) |
Real Estate Taxes by Mortgage Status in Golf
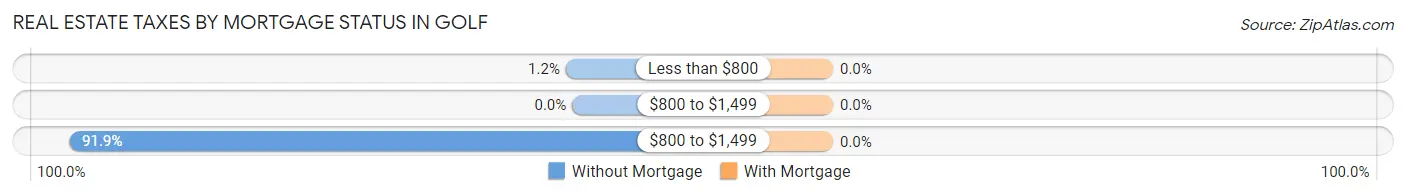
| Property Taxes | Without Mortgage | With Mortgage |
| Less than $800 | 1 (1.2%) | 0 (0.0%) |
| $800 to $1,499 | 0 (0.0%) | 0 (0.0%) |
| $800 to $1,499 | 79 (91.9%) | 0 (0.0%) |
| Total | 86 (100.0%) | 102 (100.0%) |
Health & Disability in Golf
Health Insurance Coverage by Age in Golf
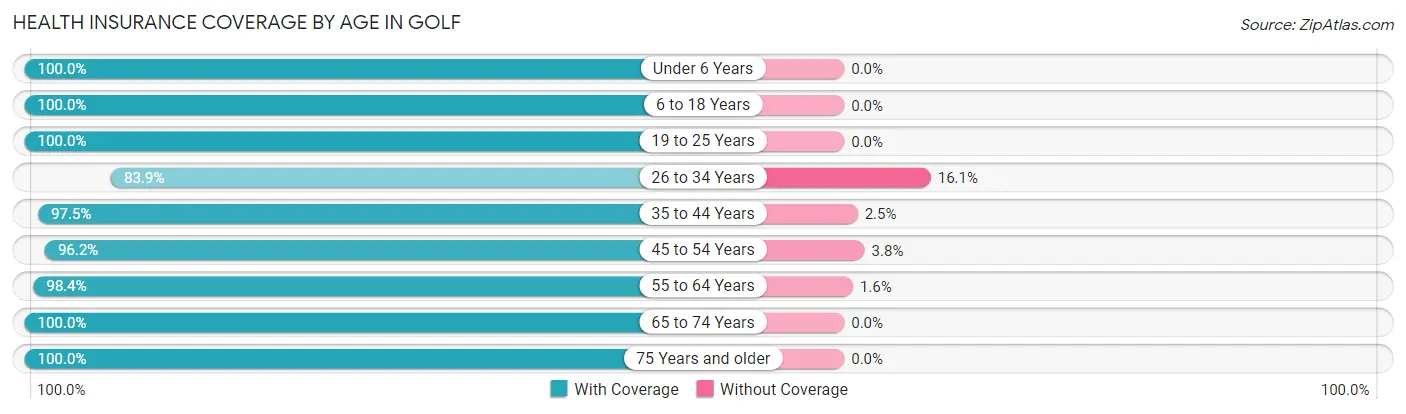
| Age Bracket | With Coverage | Without Coverage |
| Under 6 Years | 16 (100.0%) | 0 (0.0%) |
| 6 to 18 Years | 128 (100.0%) | 0 (0.0%) |
| 19 to 25 Years | 27 (100.0%) | 0 (0.0%) |
| 26 to 34 Years | 26 (83.9%) | 5 (16.1%) |
| 35 to 44 Years | 39 (97.5%) | 1 (2.5%) |
| 45 to 54 Years | 76 (96.2%) | 3 (3.8%) |
| 55 to 64 Years | 121 (98.4%) | 2 (1.6%) |
| 65 to 74 Years | 49 (100.0%) | 0 (0.0%) |
| 75 Years and older | 53 (100.0%) | 0 (0.0%) |
| Total | 535 (98.0%) | 11 (2.0%) |
Health Insurance Coverage by Citizenship Status in Golf
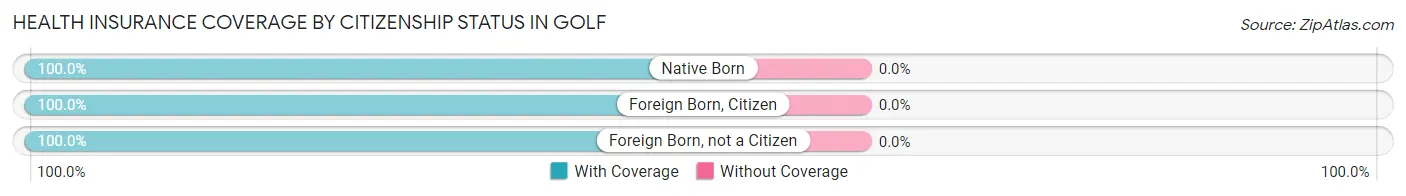
| Citizenship Status | With Coverage | Without Coverage |
| Native Born | 16 (100.0%) | 0 (0.0%) |
| Foreign Born, Citizen | 128 (100.0%) | 0 (0.0%) |
| Foreign Born, not a Citizen | 27 (100.0%) | 0 (0.0%) |
Health Insurance Coverage by Household Income in Golf
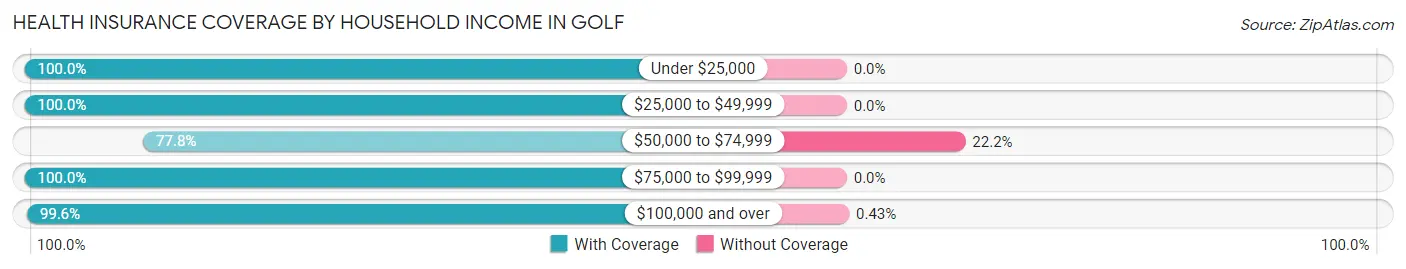
| Household Income | With Coverage | Without Coverage |
| Under $25,000 | 23 (100.0%) | 0 (0.0%) |
| $25,000 to $49,999 | 5 (100.0%) | 0 (0.0%) |
| $50,000 to $74,999 | 14 (77.8%) | 4 (22.2%) |
| $75,000 to $99,999 | 11 (100.0%) | 0 (0.0%) |
| $100,000 and over | 462 (99.6%) | 2 (0.4%) |
Public vs Private Health Insurance Coverage by Age in Golf
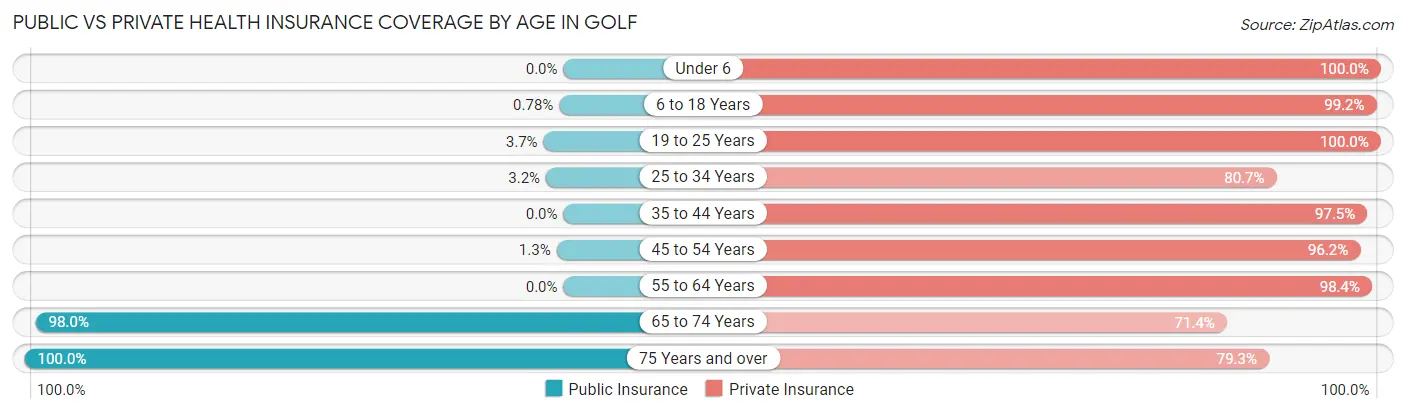
| Age Bracket | Public Insurance | Private Insurance |
| Under 6 | 0 (0.0%) | 16 (100.0%) |
| 6 to 18 Years | 1 (0.8%) | 127 (99.2%) |
| 19 to 25 Years | 1 (3.7%) | 27 (100.0%) |
| 25 to 34 Years | 1 (3.2%) | 25 (80.6%) |
| 35 to 44 Years | 0 (0.0%) | 39 (97.5%) |
| 45 to 54 Years | 1 (1.3%) | 76 (96.2%) |
| 55 to 64 Years | 0 (0.0%) | 121 (98.4%) |
| 65 to 74 Years | 48 (98.0%) | 35 (71.4%) |
| 75 Years and over | 53 (100.0%) | 42 (79.2%) |
| Total | 105 (19.2%) | 508 (93.0%) |
Disability Status by Sex by Age in Golf
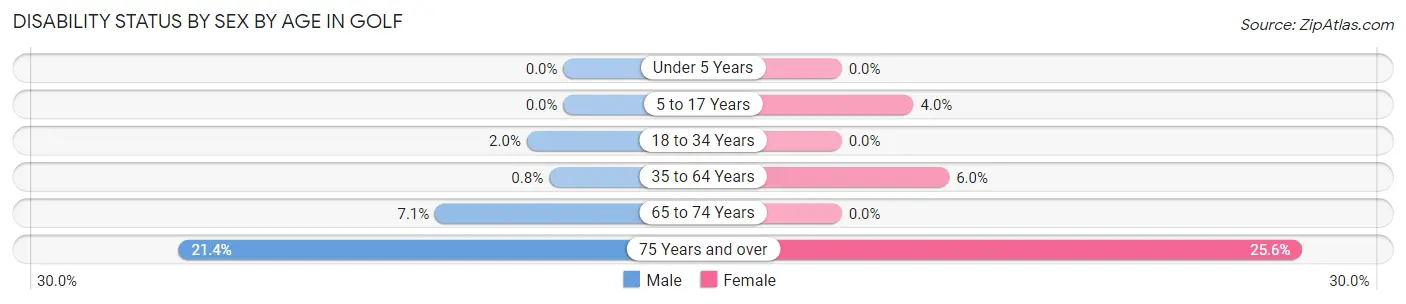
| Age Bracket | Male | Female |
| Under 5 Years | 0 (0.0%) | 0 (0.0%) |
| 5 to 17 Years | 0 (0.0%) | 2 (4.0%) |
| 18 to 34 Years | 1 (2.0%) | 0 (0.0%) |
| 35 to 64 Years | 1 (0.8%) | 7 (6.0%) |
| 65 to 74 Years | 2 (7.1%) | 0 (0.0%) |
| 75 Years and over | 3 (21.4%) | 10 (25.6%) |
Disability Class by Sex by Age in Golf
Disability Class: Hearing Difficulty
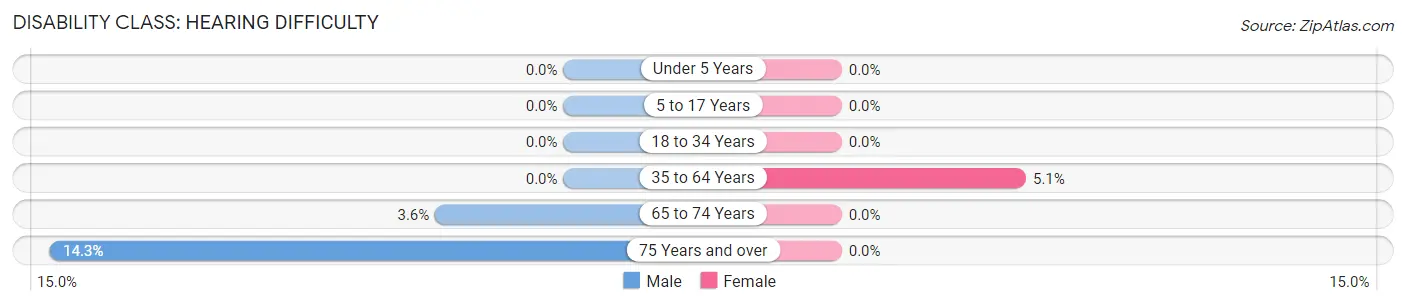
| Age Bracket | Male | Female |
| Under 5 Years | 0 (0.0%) | 0 (0.0%) |
| 5 to 17 Years | 0 (0.0%) | 0 (0.0%) |
| 18 to 34 Years | 0 (0.0%) | 0 (0.0%) |
| 35 to 64 Years | 0 (0.0%) | 6 (5.1%) |
| 65 to 74 Years | 1 (3.6%) | 0 (0.0%) |
| 75 Years and over | 2 (14.3%) | 0 (0.0%) |
Disability Class: Vision Difficulty
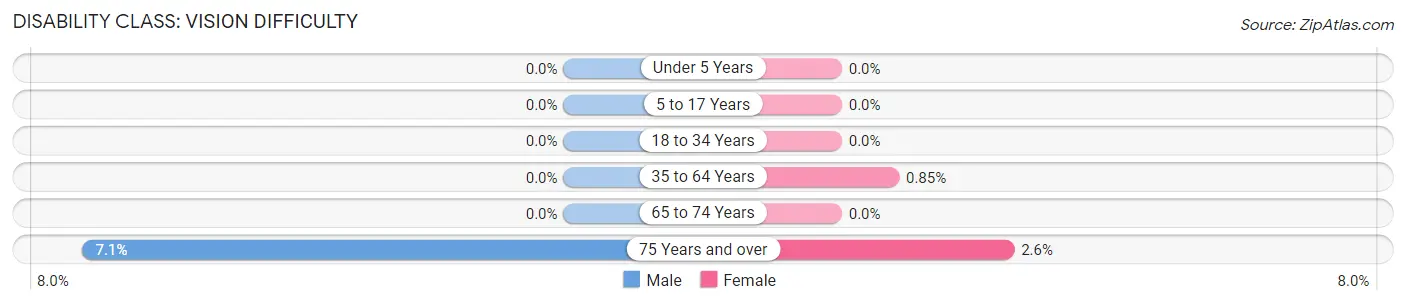
| Age Bracket | Male | Female |
| Under 5 Years | 0 (0.0%) | 0 (0.0%) |
| 5 to 17 Years | 0 (0.0%) | 0 (0.0%) |
| 18 to 34 Years | 0 (0.0%) | 0 (0.0%) |
| 35 to 64 Years | 0 (0.0%) | 1 (0.9%) |
| 65 to 74 Years | 0 (0.0%) | 0 (0.0%) |
| 75 Years and over | 1 (7.1%) | 1 (2.6%) |
Disability Class: Cognitive Difficulty
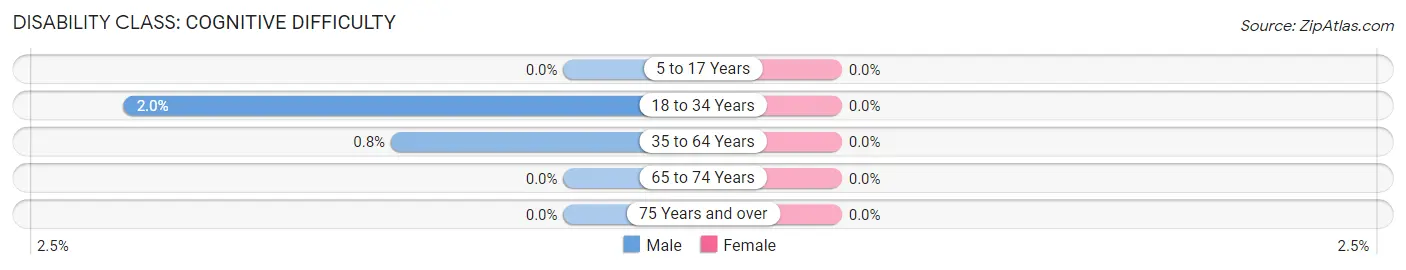
| Age Bracket | Male | Female |
| 5 to 17 Years | 0 (0.0%) | 0 (0.0%) |
| 18 to 34 Years | 1 (2.0%) | 0 (0.0%) |
| 35 to 64 Years | 1 (0.8%) | 0 (0.0%) |
| 65 to 74 Years | 0 (0.0%) | 0 (0.0%) |
| 75 Years and over | 0 (0.0%) | 0 (0.0%) |
Disability Class: Ambulatory Difficulty
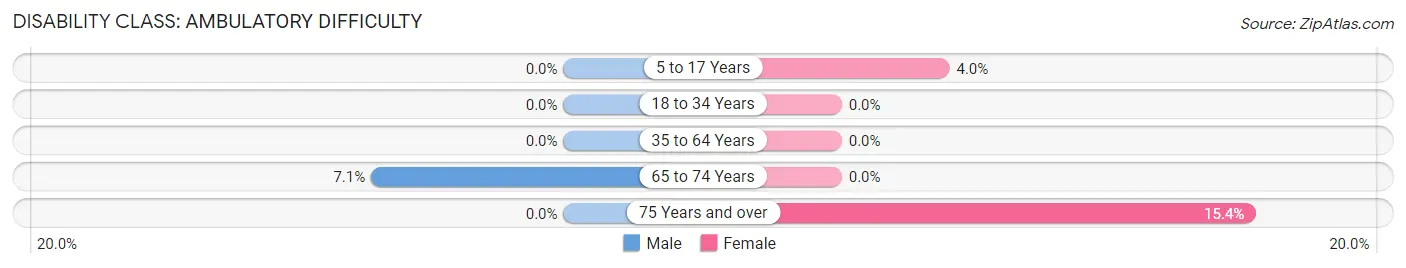
| Age Bracket | Male | Female |
| 5 to 17 Years | 0 (0.0%) | 2 (4.0%) |
| 18 to 34 Years | 0 (0.0%) | 0 (0.0%) |
| 35 to 64 Years | 0 (0.0%) | 0 (0.0%) |
| 65 to 74 Years | 2 (7.1%) | 0 (0.0%) |
| 75 Years and over | 0 (0.0%) | 6 (15.4%) |
Disability Class: Self-Care Difficulty
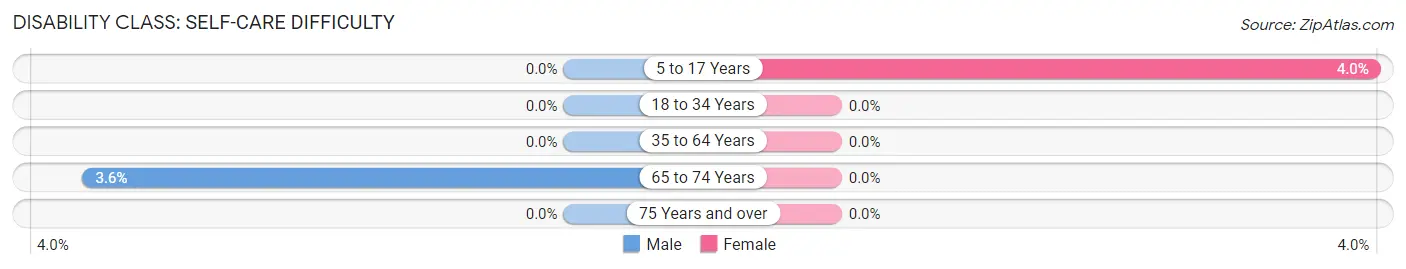
| Age Bracket | Male | Female |
| 5 to 17 Years | 0 (0.0%) | 2 (4.0%) |
| 18 to 34 Years | 0 (0.0%) | 0 (0.0%) |
| 35 to 64 Years | 0 (0.0%) | 0 (0.0%) |
| 65 to 74 Years | 1 (3.6%) | 0 (0.0%) |
| 75 Years and over | 0 (0.0%) | 0 (0.0%) |
Technology Access in Golf
Computing Device Access in Golf
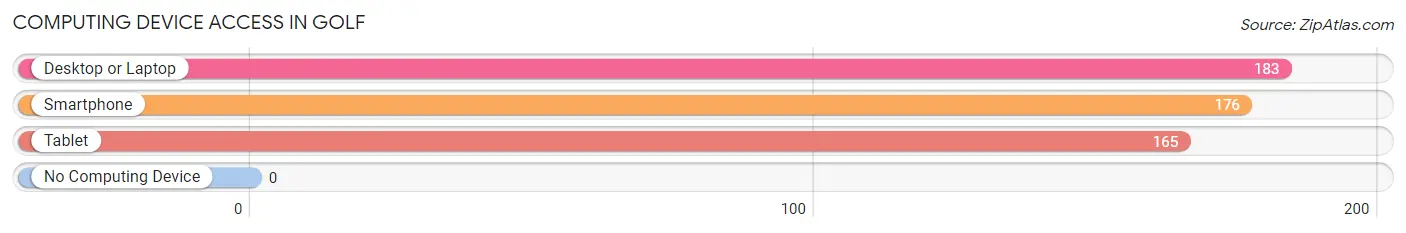
| Device Type | # Households | % Households |
| Desktop or Laptop | 183 | 94.3% |
| Smartphone | 176 | 90.7% |
| Tablet | 165 | 85.1% |
| No Computing Device | 0 | 0.0% |
| Total | 194 | 100.0% |
Internet Access in Golf
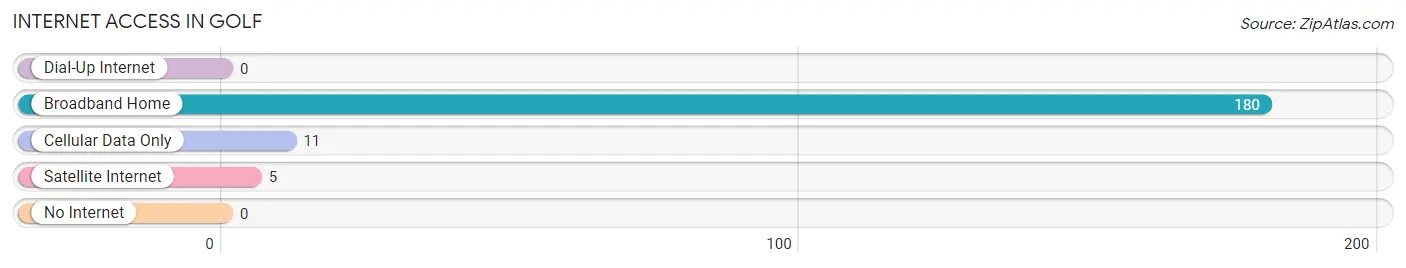
| Internet Type | # Households | % Households |
| Dial-Up Internet | 0 | 0.0% |
| Broadband Home | 180 | 92.8% |
| Cellular Data Only | 11 | 5.7% |
| Satellite Internet | 5 | 2.6% |
| No Internet | 0 | 0.0% |
| Total | 194 | 100.0% |
Golf Summary
Golf, Illinois is a small village located in Cook County, Illinois. It is a part of the Chicago metropolitan area and is located approximately 25 miles northwest of downtown Chicago. The village has a population of approximately 500 people and covers an area of 0.6 square miles.
History
Golf, Illinois was founded in 1892 by a group of German immigrants. The village was named after the game of golf, which was popular among the settlers. The village was incorporated in 1895 and was home to a variety of businesses, including a hotel, a general store, a blacksmith shop, and a post office.
In the early 1900s, Golf, Illinois was a popular destination for golfers from all over the country. The village was home to several golf courses, including the Golf Club of Illinois, which was founded in 1904. The village also hosted the first professional golf tournament in the United States in 1916.
Geography
Golf, Illinois is located in Cook County, Illinois. It is situated on the Des Plaines River and is bordered by the villages of Niles, Morton Grove, and Glenview. The village is located approximately 25 miles northwest of downtown Chicago and is part of the Chicago metropolitan area.
The village has a total area of 0.6 square miles, all of which is land. The village is located at an elevation of 645 feet above sea level. The climate in Golf, Illinois is classified as humid continental, with hot summers and cold winters.
Economy
Golf, Illinois is a small village with a population of approximately 500 people. The village is home to a variety of businesses, including a hotel, a general store, a blacksmith shop, and a post office. The village is also home to several golf courses, including the Golf Club of Illinois, which was founded in 1904.
The village is also home to a variety of manufacturing and industrial businesses. The village is home to several factories, including a paper mill, a steel mill, and a plastics factory. The village is also home to a variety of retail businesses, including a grocery store, a hardware store, and a pharmacy.
Demographics
Golf, Illinois has a population of approximately 500 people. The village is predominantly white, with approximately 95% of the population identifying as white. The village is also home to a small Hispanic population, with approximately 4% of the population identifying as Hispanic. The village is also home to a small African American population, with approximately 1% of the population identifying as African American. The median household income in Golf, Illinois is approximately $50,000.
Common Questions
What is the Total Population of Golf?
Total Population of Golf is 546.
What is the Total Male Population of Golf?
Total Male Population of Golf is 291.
What is the Total Female Population of Golf?
Total Female Population of Golf is 255.
What is the Ratio of Males per 100 Females in Golf?
There are 114.12 Males per 100 Females in Golf.
What is the Ratio of Females per 100 Males in Golf?
There are 87.63 Females per 100 Males in Golf.
What is the Median Population Age in Golf?
Median Population Age in Golf is 50.1 Years.
What is the Average Family Size in Golf
Average Family Size in Golf is 3.0 People.
What is the Average Household Size in Golf
Average Household Size in Golf is 2.7 People.
What is Per Capita Income in Golf?
Per Capita income in Golf is $121,116.
What is the Median Family Income in Golf?
Median Family Income in Golf is $236,250.
What is the Median Household income in Golf?
Median Household Income in Golf is $228,750.
What is Income or Wage Gap in Golf?
Income or Wage Gap in Golf is 36.5%.
Women in Golf earn 63.5 cents for every dollar earned by a man.
What is Inequality or Gini Index in Golf?
Inequality or Gini Index in Golf is 0.50.
How Large is the Labor Force in Golf?
There are 283 People in the Labor Forcein in Golf.
What is the Percentage of People in the Labor Force in Golf?
63.7% of People are in the Labor Force in Golf.
What is the Unemployment Rate in Golf?
Unemployment Rate in Golf is 6.7%.