Northfield, IL
Northfield Map
Northfield Overview
5,707
TOTAL POPULATION
2,622
MALE POPULATION
3,085
FEMALE POPULATION
84.99
MALES / 100 FEMALES
117.66
FEMALES / 100 MALES
49.9
MEDIAN AGE
2.9
AVG FAMILY SIZE
2.4
AVG HOUSEHOLD SIZE
$106,266
PER CAPITA INCOME
$205,481
AVG FAMILY INCOME
$146,538
AVG HOUSEHOLD INCOME
42.8%
WAGE / INCOME GAP [ % ]
57.2¢/ $1
WAGE / INCOME GAP [ $ ]
0.56
INEQUALITY / GINI INDEX
2,684
LABOR FORCE [ PEOPLE ]
59.1%
PERCENT IN LABOR FORCE
1.5%
UNEMPLOYMENT RATE
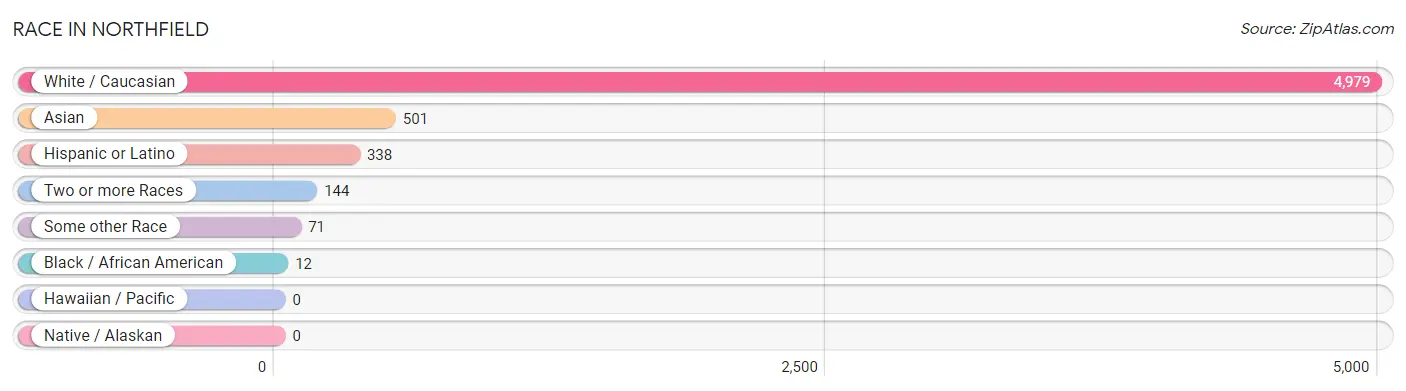
Race in Northfield
The most populous races in Northfield are White / Caucasian (4,979 | 87.2%), Asian (501 | 8.8%), and Hispanic or Latino (338 | 5.9%).
| Race | # Population | % Population |
| Asian | 501 | 8.8% |
| Black / African American | 12 | 0.2% |
| Hawaiian / Pacific | 0 | 0.0% |
| Hispanic or Latino | 338 | 5.9% |
| Native / Alaskan | 0 | 0.0% |
| White / Caucasian | 4,979 | 87.2% |
| Two or more Races | 144 | 2.5% |
| Some other Race | 71 | 1.2% |
| Total | 5,707 | 100.0% |
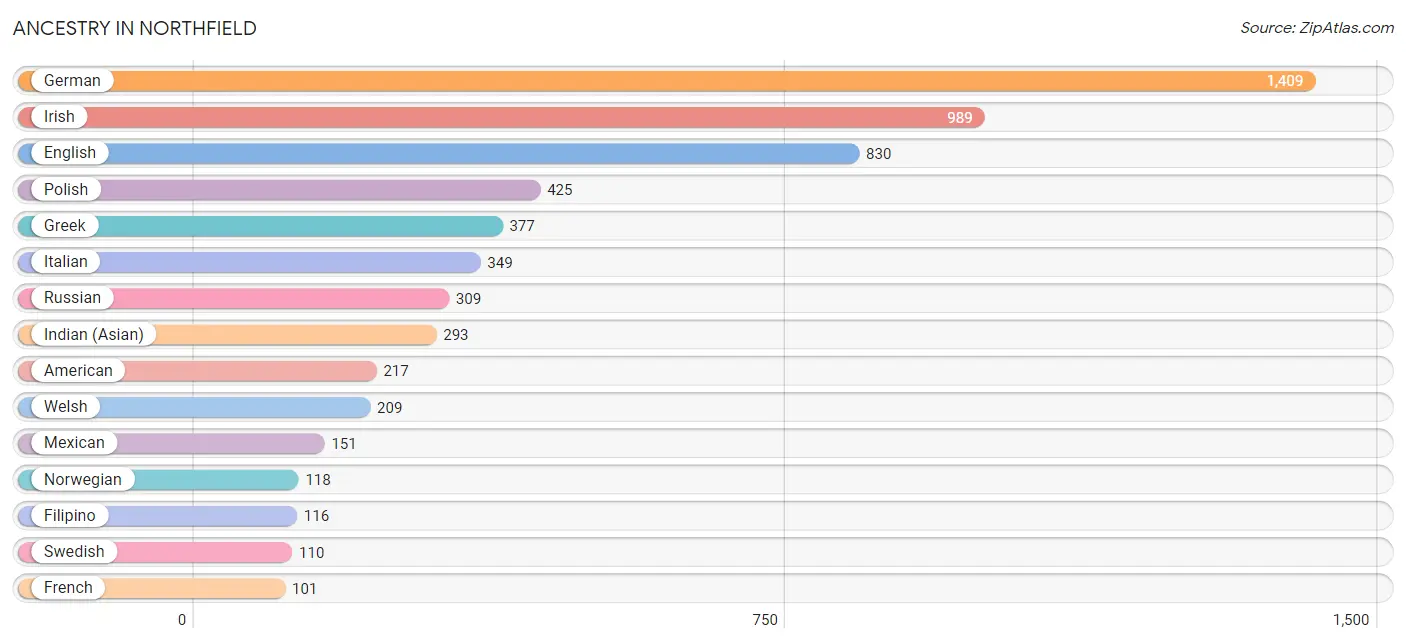
Ancestry in Northfield
The most populous ancestries reported in Northfield are German (1,409 | 24.7%), Irish (989 | 17.3%), English (830 | 14.5%), Polish (425 | 7.4%), and Greek (377 | 6.6%), together accounting for 70.6% of all Northfield residents.
| Ancestry | # Population | % Population |
| African | 11 | 0.2% |
| American | 217 | 3.8% |
| Arab | 12 | 0.2% |
| Armenian | 7 | 0.1% |
| Assyrian / Chaldean / Syriac | 29 | 0.5% |
| Australian | 12 | 0.2% |
| Austrian | 22 | 0.4% |
| Belgian | 13 | 0.2% |
| Bhutanese | 26 | 0.5% |
| British | 22 | 0.4% |
| Burmese | 54 | 0.9% |
| Canadian | 35 | 0.6% |
| Central American | 15 | 0.3% |
| Chilean | 11 | 0.2% |
| Croatian | 12 | 0.2% |
| Cuban | 93 | 1.6% |
| Czech | 21 | 0.4% |
| Czechoslovakian | 8 | 0.1% |
| Danish | 48 | 0.8% |
| Dutch | 31 | 0.5% |
| Eastern European | 49 | 0.9% |
| English | 830 | 14.5% |
| Estonian | 13 | 0.2% |
| European | 84 | 1.5% |
| Filipino | 116 | 2.0% |
| Finnish | 21 | 0.4% |
| French | 101 | 1.8% |
| French Canadian | 21 | 0.4% |
| German | 1,409 | 24.7% |
| Greek | 377 | 6.6% |
| Indian (Asian) | 293 | 5.1% |
| Irish | 989 | 17.3% |
| Italian | 349 | 6.1% |
| Lithuanian | 25 | 0.4% |
| Macedonian | 12 | 0.2% |
| Mexican | 151 | 2.6% |
| Mongolian | 32 | 0.6% |
| Norwegian | 118 | 2.1% |
| Polish | 425 | 7.4% |
| Portuguese | 8 | 0.1% |
| Puerto Rican | 55 | 1.0% |
| Russian | 309 | 5.4% |
| Salvadoran | 15 | 0.3% |
| Scandinavian | 33 | 0.6% |
| Scotch-Irish | 25 | 0.4% |
| Scottish | 88 | 1.5% |
| Slovak | 20 | 0.4% |
| South American | 11 | 0.2% |
| Spanish | 13 | 0.2% |
| Subsaharan African | 11 | 0.2% |
| Swedish | 110 | 1.9% |
| Swiss | 17 | 0.3% |
| Syrian | 12 | 0.2% |
| Thai | 23 | 0.4% |
| Turkish | 8 | 0.1% |
| Ukrainian | 21 | 0.4% |
| Welsh | 209 | 3.7% |
| Yugoslavian | 8 | 0.1% | View All 58 Rows |
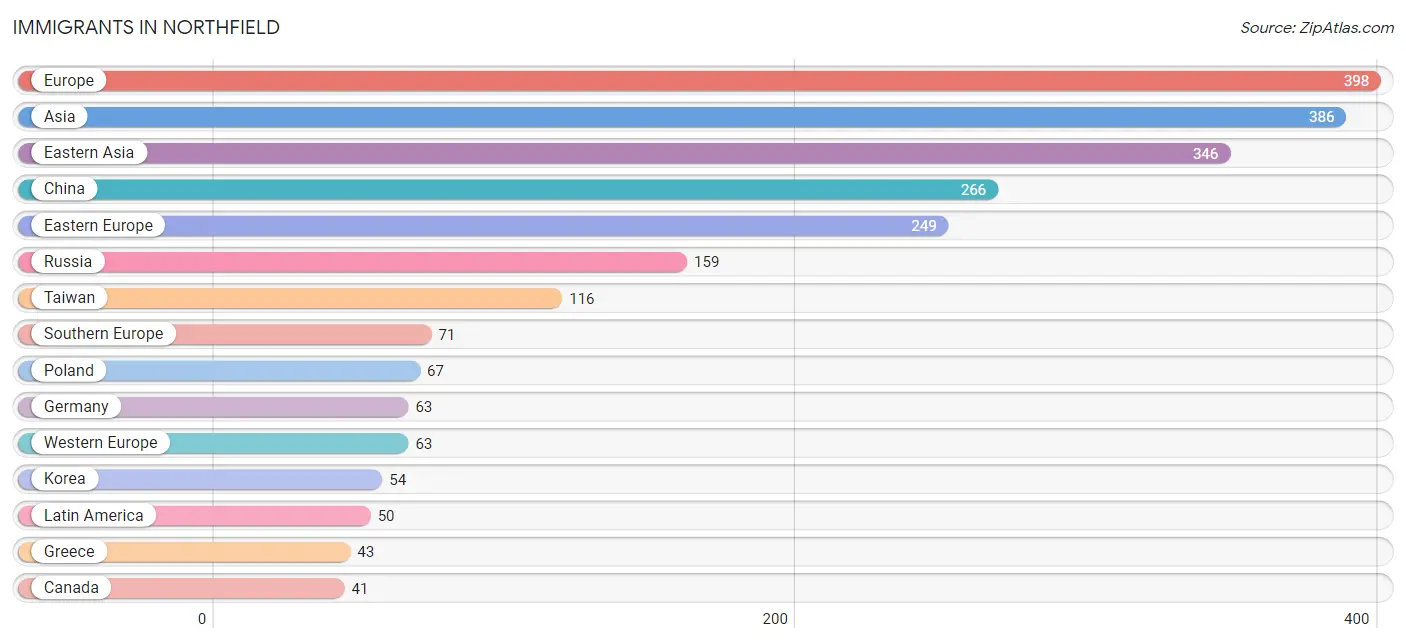
Immigrants in Northfield
The most numerous immigrant groups reported in Northfield came from Europe (398 | 7.0%), Asia (386 | 6.8%), Eastern Asia (346 | 6.1%), China (266 | 4.7%), and Eastern Europe (249 | 4.4%), together accounting for 28.8% of all Northfield residents.
| Immigration Origin | # Population | % Population |
| Africa | 11 | 0.2% |
| Asia | 386 | 6.8% |
| Australia | 22 | 0.4% |
| Canada | 41 | 0.7% |
| Central America | 39 | 0.7% |
| Chile | 11 | 0.2% |
| China | 266 | 4.7% |
| Eastern Asia | 346 | 6.1% |
| Eastern Europe | 249 | 4.4% |
| Europe | 398 | 7.0% |
| Germany | 63 | 1.1% |
| Greece | 43 | 0.7% |
| Hong Kong | 7 | 0.1% |
| Hungary | 14 | 0.3% |
| Italy | 28 | 0.5% |
| Japan | 26 | 0.5% |
| Korea | 54 | 0.9% |
| Latin America | 50 | 0.9% |
| Malaysia | 32 | 0.6% |
| Mexico | 39 | 0.7% |
| Northern Europe | 15 | 0.3% |
| Oceania | 22 | 0.4% |
| Poland | 67 | 1.2% |
| Russia | 159 | 2.8% |
| South America | 11 | 0.2% |
| South Eastern Asia | 32 | 0.6% |
| Southern Europe | 71 | 1.2% |
| Taiwan | 116 | 2.0% |
| Turkey | 8 | 0.1% |
| Ukraine | 9 | 0.2% |
| Western Africa | 11 | 0.2% |
| Western Asia | 8 | 0.1% |
| Western Europe | 63 | 1.1% | View All 33 Rows |
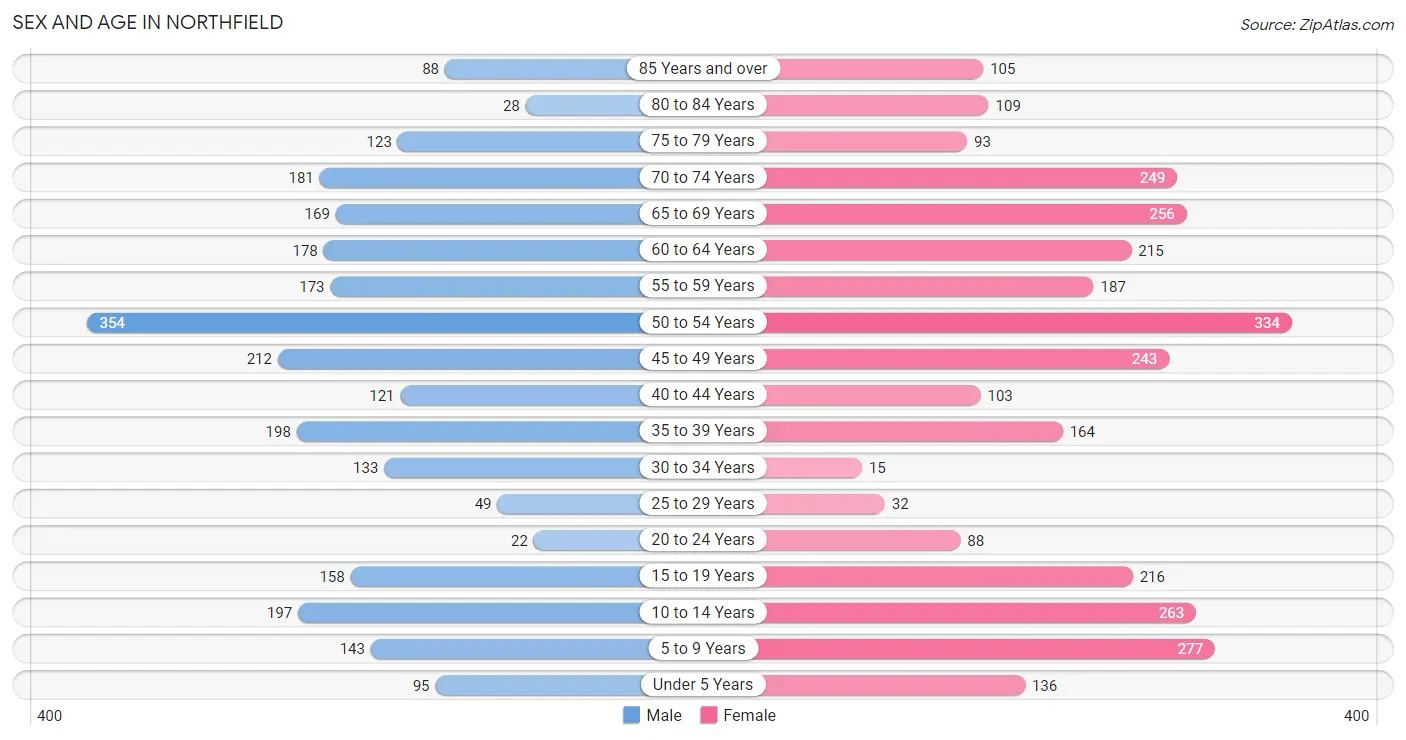
Sex and Age in Northfield
Sex and Age in Northfield
The most populous age groups in Northfield are 50 to 54 Years (354 | 13.5%) for men and 50 to 54 Years (334 | 10.8%) for women.
| Age Bracket | Male | Female |
| Under 5 Years | 95 (3.6%) | 136 (4.4%) |
| 5 to 9 Years | 143 (5.4%) | 277 (9.0%) |
| 10 to 14 Years | 197 (7.5%) | 263 (8.5%) |
| 15 to 19 Years | 158 (6.0%) | 216 (7.0%) |
| 20 to 24 Years | 22 (0.8%) | 88 (2.9%) |
| 25 to 29 Years | 49 (1.9%) | 32 (1.0%) |
| 30 to 34 Years | 133 (5.1%) | 15 (0.5%) |
| 35 to 39 Years | 198 (7.5%) | 164 (5.3%) |
| 40 to 44 Years | 121 (4.6%) | 103 (3.3%) |
| 45 to 49 Years | 212 (8.1%) | 243 (7.9%) |
| 50 to 54 Years | 354 (13.5%) | 334 (10.8%) |
| 55 to 59 Years | 173 (6.6%) | 187 (6.1%) |
| 60 to 64 Years | 178 (6.8%) | 215 (7.0%) |
| 65 to 69 Years | 169 (6.5%) | 256 (8.3%) |
| 70 to 74 Years | 181 (6.9%) | 249 (8.1%) |
| 75 to 79 Years | 123 (4.7%) | 93 (3.0%) |
| 80 to 84 Years | 28 (1.1%) | 109 (3.5%) |
| 85 Years and over | 88 (3.4%) | 105 (3.4%) |
| Total | 2,622 (100.0%) | 3,085 (100.0%) |
Families and Households in Northfield
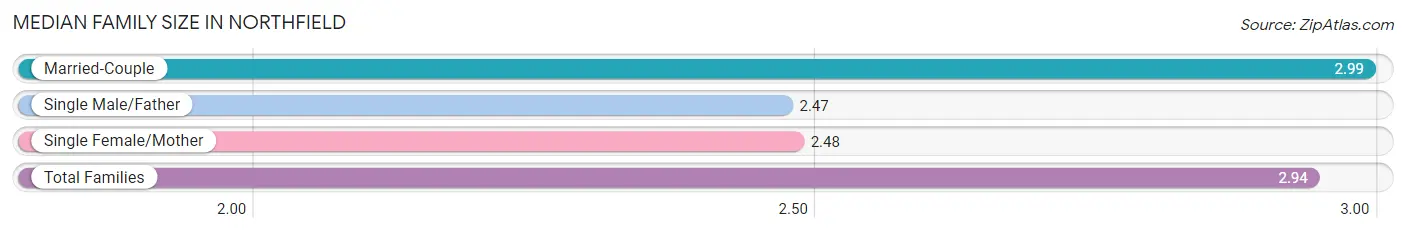
Median Family Size in Northfield
The median family size in Northfield is 2.94 persons per family, with married-couple families (1,527 | 90.1%) accounting for the largest median family size of 2.99 persons per family. On the other hand, single male/father families (43 | 2.5%) represent the smallest median family size with 2.47 persons per family.
| Family Type | # Families | Family Size |
| Married-Couple | 1,527 (90.1%) | 2.99 |
| Single Male/Father | 43 (2.5%) | 2.47 |
| Single Female/Mother | 125 (7.4%) | 2.48 |
| Total Families | 1,695 (100.0%) | 2.94 |
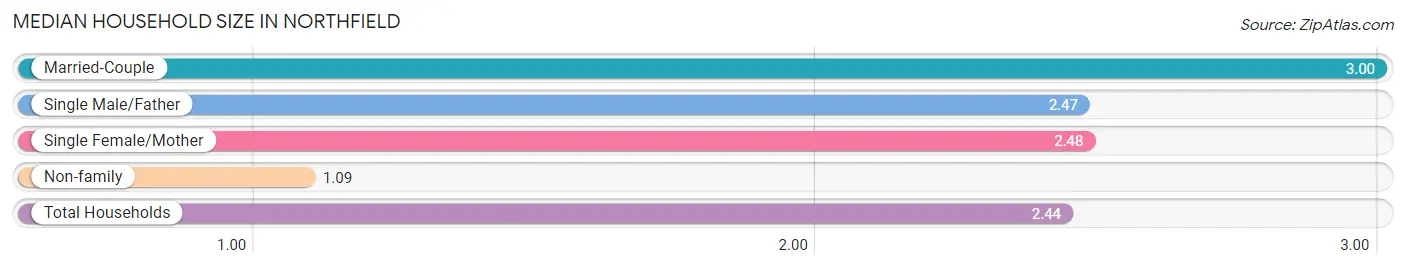
Median Household Size in Northfield
The median household size in Northfield is 2.44 persons per household, with married-couple households (1,527 | 65.3%) accounting for the largest median household size of 3 persons per household. non-family households (645 | 27.6%) represent the smallest median household size with 1.09 persons per household.
| Household Type | # Households | Household Size |
| Married-Couple | 1,527 (65.3%) | 3.00 |
| Single Male/Father | 43 (1.8%) | 2.47 |
| Single Female/Mother | 125 (5.3%) | 2.48 |
| Non-family | 645 (27.6%) | 1.09 |
| Total Households | 2,340 (100.0%) | 2.44 |
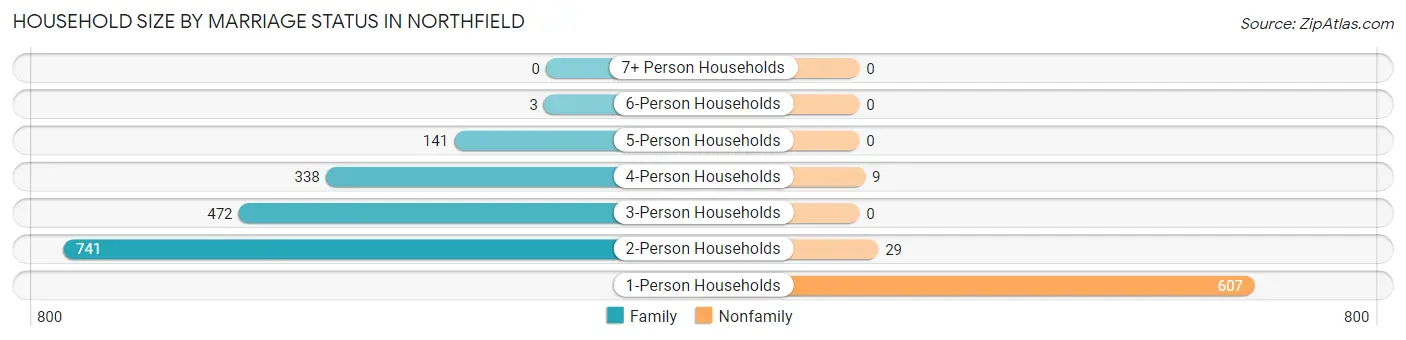
Household Size by Marriage Status in Northfield
Out of a total of 2,340 households in Northfield, 1,695 (72.4%) are family households, while 645 (27.6%) are nonfamily households. The most numerous type of family households are 2-person households, comprising 741, and the most common type of nonfamily households are 1-person households, comprising 607.
| Household Size | Family Households | Nonfamily Households |
| 1-Person Households | - | 607 (25.9%) |
| 2-Person Households | 741 (31.7%) | 29 (1.2%) |
| 3-Person Households | 472 (20.2%) | 0 (0.0%) |
| 4-Person Households | 338 (14.4%) | 9 (0.4%) |
| 5-Person Households | 141 (6.0%) | 0 (0.0%) |
| 6-Person Households | 3 (0.1%) | 0 (0.0%) |
| 7+ Person Households | 0 (0.0%) | 0 (0.0%) |
| Total | 1,695 (72.4%) | 645 (27.6%) |
Female Fertility in Northfield
Fertility by Age in Northfield
Average fertility rate in Northfield is 98.0 births per 1,000 women. Women in the age bracket of 35 to 50 years have the highest fertility rate with 132.0 births per 1,000 women. Women in the age bracket of 35 to 50 years acount for 83.0% of all women with births.
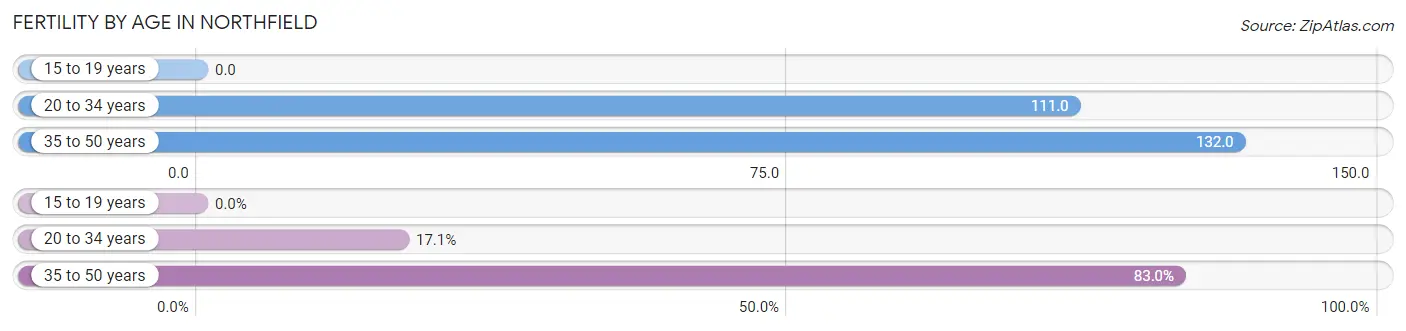
| Age Bracket | Women with Births | Births / 1,000 Women |
| 15 to 19 years | 0 (0.0%) | 0.0 |
| 20 to 34 years | 15 (17.1%) | 111.0 |
| 35 to 50 years | 73 (83.0%) | 132.0 |
| Total | 88 (100.0%) | 98.0 |
Fertility by Age by Marriage Status in Northfield
78.4% of women with births (88) in Northfield are married. The highest percentage of unmarried women with births falls into 35 to 50 years age bracket with 26.0% of them unmarried at the time of birth, while the lowest percentage of unmarried women with births belong to 20 to 34 years age bracket with 0.0% of them unmarried.
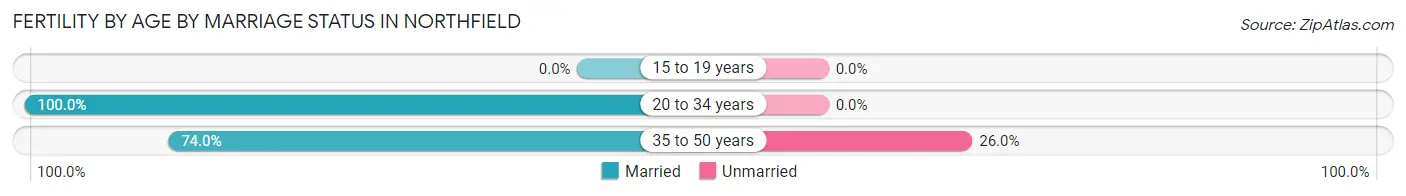
| Age Bracket | Married | Unmarried |
| 15 to 19 years | 0 (0.0%) | 0 (0.0%) |
| 20 to 34 years | 15 (100.0%) | 0 (0.0%) |
| 35 to 50 years | 54 (74.0%) | 19 (26.0%) |
| Total | 69 (78.4%) | 19 (21.6%) |
Fertility by Education in Northfield
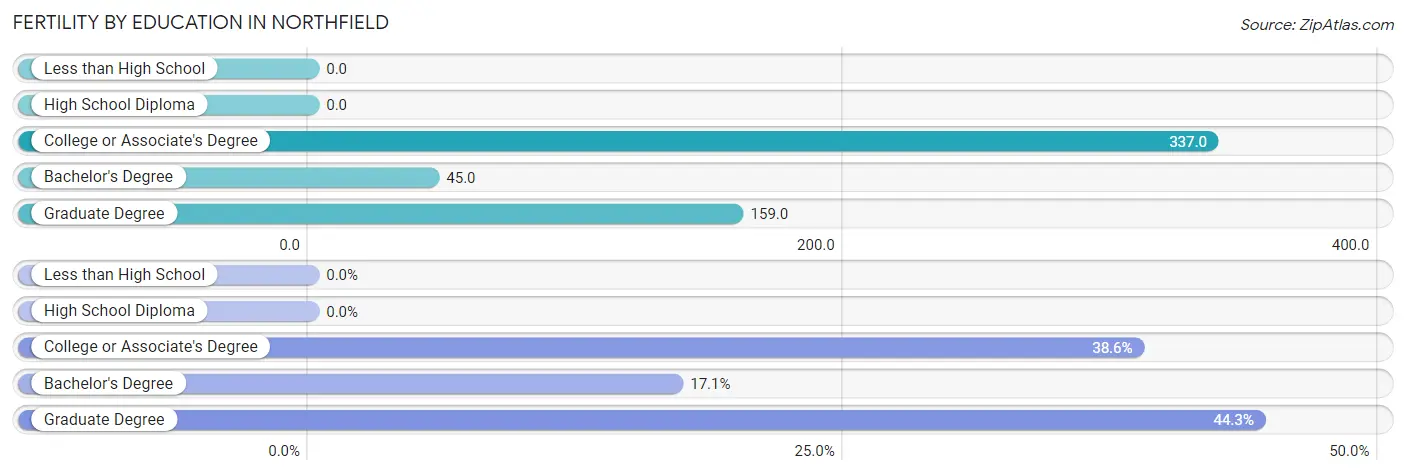
| Educational Attainment | Women with Births | Births / 1,000 Women |
| Less than High School | 0 (0.0%) | 0.0 |
| High School Diploma | 0 (0.0%) | 0.0 |
| College or Associate's Degree | 34 (38.6%) | 337.0 |
| Bachelor's Degree | 15 (17.1%) | 45.0 |
| Graduate Degree | 39 (44.3%) | 159.0 |
| Total | 88 (100.0%) | 98.0 |
Fertility by Education by Marriage Status in Northfield
21.6% of women with births in Northfield are unmarried. Women with the educational attainment of college or associate's degree are most likely to be married with 100.0% of them married at childbirth, while women with the educational attainment of graduate degree are least likely to be married with 48.7% of them unmarried at childbirth.
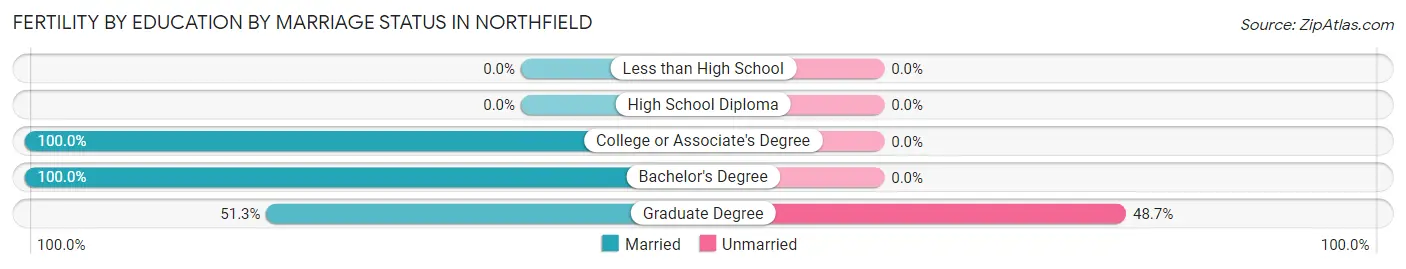
| Educational Attainment | Married | Unmarried |
| Less than High School | 0 (0.0%) | 0 (0.0%) |
| High School Diploma | 0 (0.0%) | 0 (0.0%) |
| College or Associate's Degree | 34 (100.0%) | 0 (0.0%) |
| Bachelor's Degree | 15 (100.0%) | 0 (0.0%) |
| Graduate Degree | 20 (51.3%) | 19 (48.7%) |
| Total | 69 (78.4%) | 19 (21.6%) |
Income in Northfield
Income Overview in Northfield
Per Capita Income in Northfield is $106,266, while median incomes of families and households are $205,481 and $146,538 respectively.
| Characteristic | Number | Measure |
| Per Capita Income | 5,707 | $106,266 |
| Median Family Income | 1,695 | $205,481 |
| Mean Family Income | 1,695 | $319,378 |
| Median Household Income | 2,340 | $146,538 |
| Mean Household Income | 2,340 | $256,129 |
| Income Deficit | 1,695 | $0 |
| Wage / Income Gap (%) | 5,707 | 42.80% |
| Wage / Income Gap ($) | 5,707 | 57.20¢ per $1 |
| Gini / Inequality Index | 5,707 | 0.56 |
Earnings by Sex in Northfield
Average Earnings in Northfield are $81,167, $102,443 for men and $58,598 for women, a difference of 42.8%.
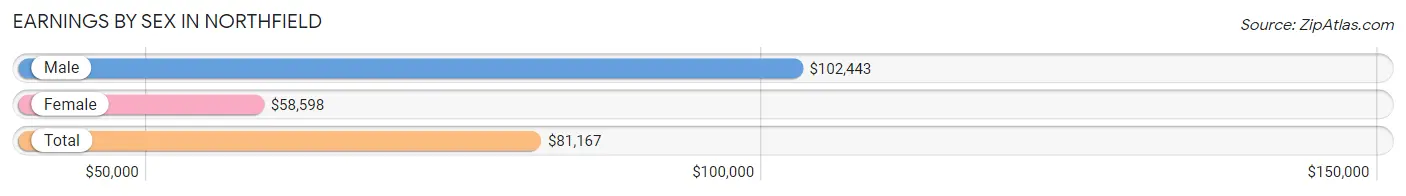
| Sex | Number | Average Earnings |
| Male | 1,640 (56.0%) | $102,443 |
| Female | 1,286 (44.0%) | $58,598 |
| Total | 2,926 (100.0%) | $81,167 |
Earnings by Sex by Income Bracket in Northfield
The most common earnings brackets in Northfield are $100,000+ for men (863 | 52.6%) and $100,000+ for women (357 | 27.8%).
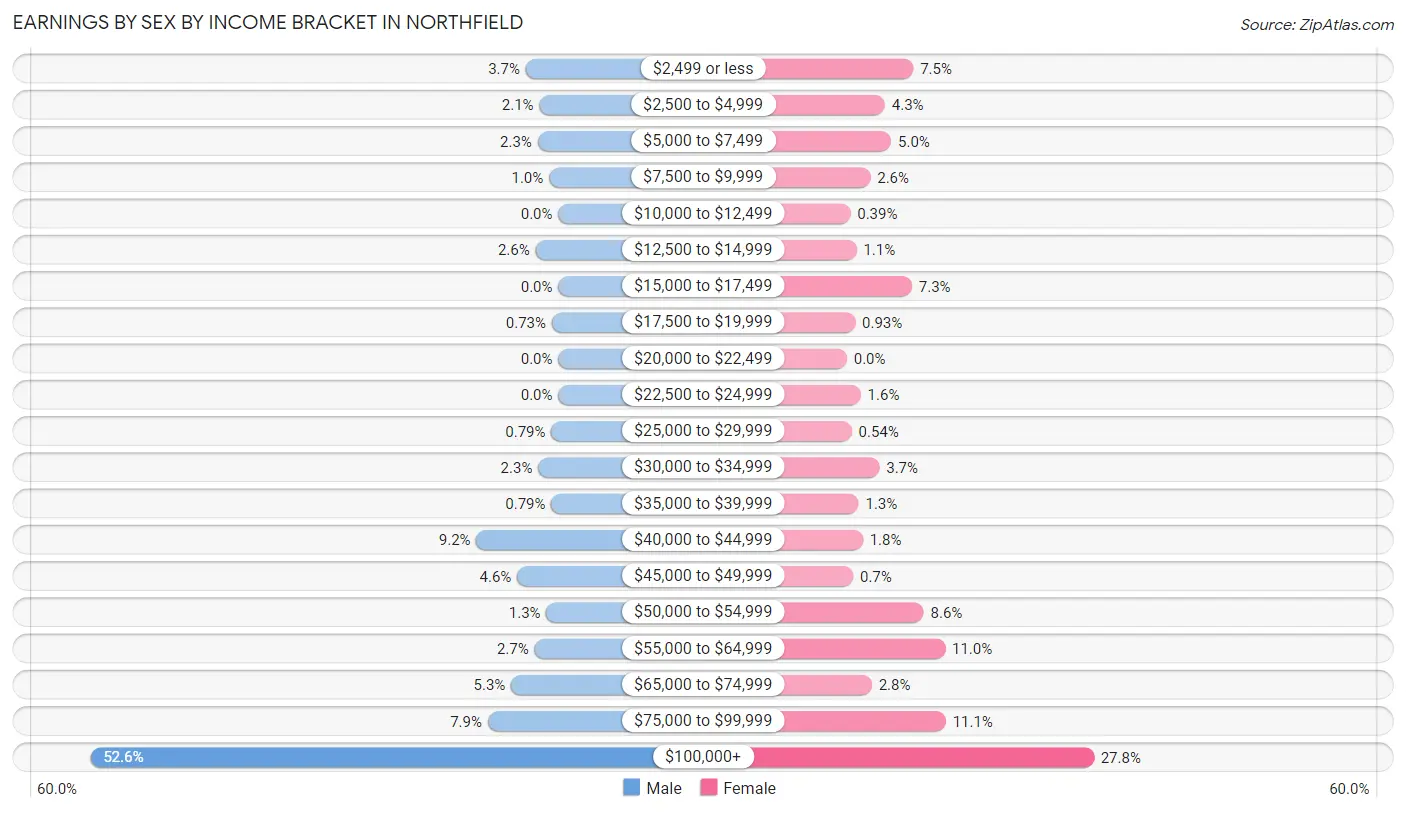
| Income | Male | Female |
| $2,499 or less | 60 (3.7%) | 96 (7.5%) |
| $2,500 to $4,999 | 35 (2.1%) | 55 (4.3%) |
| $5,000 to $7,499 | 38 (2.3%) | 64 (5.0%) |
| $7,500 to $9,999 | 17 (1.0%) | 34 (2.6%) |
| $10,000 to $12,499 | 0 (0.0%) | 5 (0.4%) |
| $12,500 to $14,999 | 42 (2.6%) | 14 (1.1%) |
| $15,000 to $17,499 | 0 (0.0%) | 94 (7.3%) |
| $17,500 to $19,999 | 12 (0.7%) | 12 (0.9%) |
| $20,000 to $22,499 | 0 (0.0%) | 0 (0.0%) |
| $22,500 to $24,999 | 0 (0.0%) | 20 (1.6%) |
| $25,000 to $29,999 | 13 (0.8%) | 7 (0.5%) |
| $30,000 to $34,999 | 37 (2.3%) | 47 (3.6%) |
| $35,000 to $39,999 | 13 (0.8%) | 17 (1.3%) |
| $40,000 to $44,999 | 151 (9.2%) | 23 (1.8%) |
| $45,000 to $49,999 | 76 (4.6%) | 9 (0.7%) |
| $50,000 to $54,999 | 22 (1.3%) | 111 (8.6%) |
| $55,000 to $64,999 | 44 (2.7%) | 142 (11.0%) |
| $65,000 to $74,999 | 87 (5.3%) | 36 (2.8%) |
| $75,000 to $99,999 | 130 (7.9%) | 143 (11.1%) |
| $100,000+ | 863 (52.6%) | 357 (27.8%) |
| Total | 1,640 (100.0%) | 1,286 (100.0%) |
Earnings by Sex by Educational Attainment in Northfield
Average earnings in Northfield are $112,917 for men and $63,512 for women, a difference of 43.8%. Men with an educational attainment of graduate degree enjoy the highest average annual earnings of $170,069, while those with college or associate's degree education earn the least with $47,824. Women with an educational attainment of graduate degree earn the most with the average annual earnings of $91,111, while those with bachelor's degree education have the smallest earnings of $63,555.
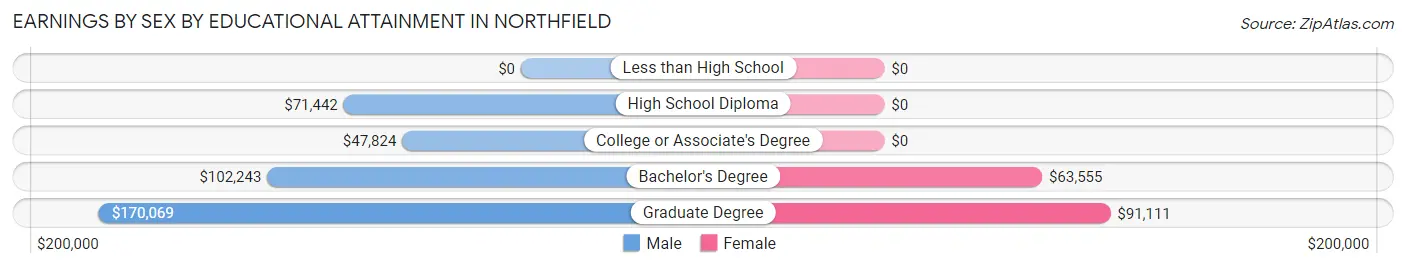
| Educational Attainment | Male Income | Female Income |
| Less than High School | - | - |
| High School Diploma | $71,442 | $0 |
| College or Associate's Degree | $47,824 | $0 |
| Bachelor's Degree | $102,243 | $63,555 |
| Graduate Degree | $170,069 | $91,111 |
| Total | $112,917 | $63,512 |
Family Income in Northfield
Family Income Brackets in Northfield
According to the Northfield family income data, there are 880 families falling into the $200,000+ income range, which is the most common income bracket and makes up 51.9% of all families.
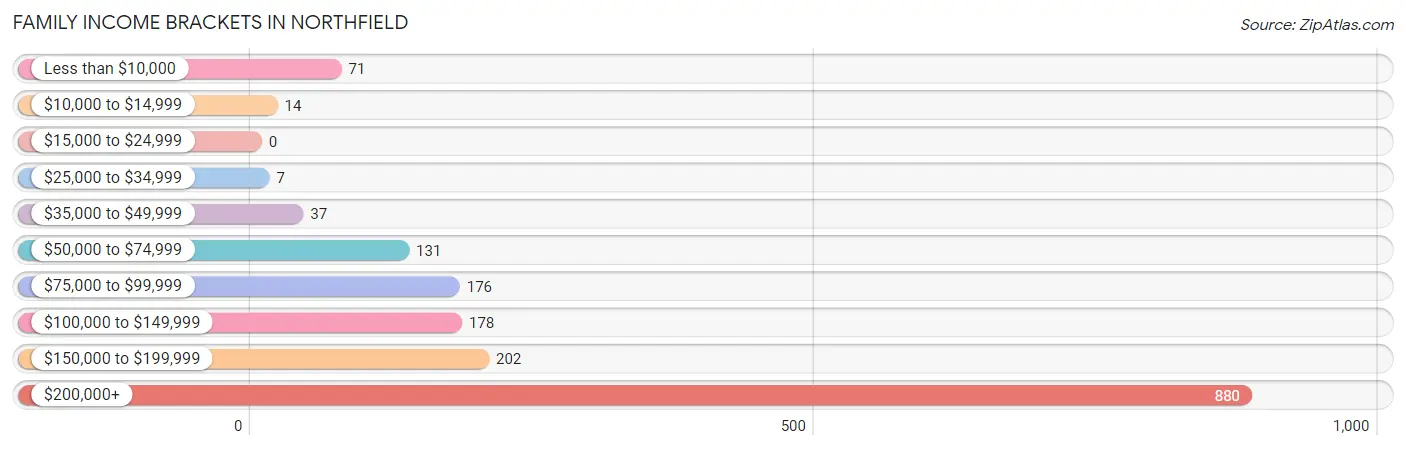
| Income Bracket | # Families | % Families |
| Less than $10,000 | 71 | 4.2% |
| $10,000 to $14,999 | 14 | 0.8% |
| $15,000 to $24,999 | 0 | 0.0% |
| $25,000 to $34,999 | 7 | 0.4% |
| $35,000 to $49,999 | 37 | 2.2% |
| $50,000 to $74,999 | 131 | 7.7% |
| $75,000 to $99,999 | 176 | 10.4% |
| $100,000 to $149,999 | 178 | 10.5% |
| $150,000 to $199,999 | 202 | 11.9% |
| $200,000+ | 880 | 51.9% |
Family Income by Famaliy Size in Northfield
4-person families (352 | 20.8%) account for the highest median family income in Northfield with $250,001 per family, while 2-person families (741 | 43.7%) have the highest median income of $88,096 per family member.
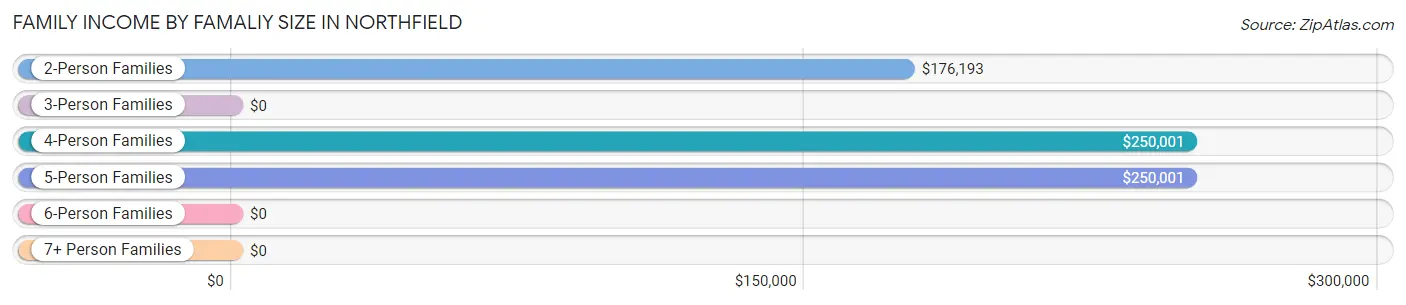
| Income Bracket | # Families | Median Income |
| 2-Person Families | 741 (43.7%) | $176,193 |
| 3-Person Families | 472 (27.9%) | $0 |
| 4-Person Families | 352 (20.8%) | $250,001 |
| 5-Person Families | 127 (7.5%) | $250,001 |
| 6-Person Families | 3 (0.2%) | $0 |
| 7+ Person Families | 0 (0.0%) | $0 |
| Total | 1,695 (100.0%) | $205,481 |
Family Income by Number of Earners in Northfield
The median family income in Northfield is $205,481, with families comprising 3+ earners (134) having the highest median family income of $250,001, while families with no earners (289) have the lowest median family income of $138,438, accounting for 7.9% and 17.1% of families, respectively.
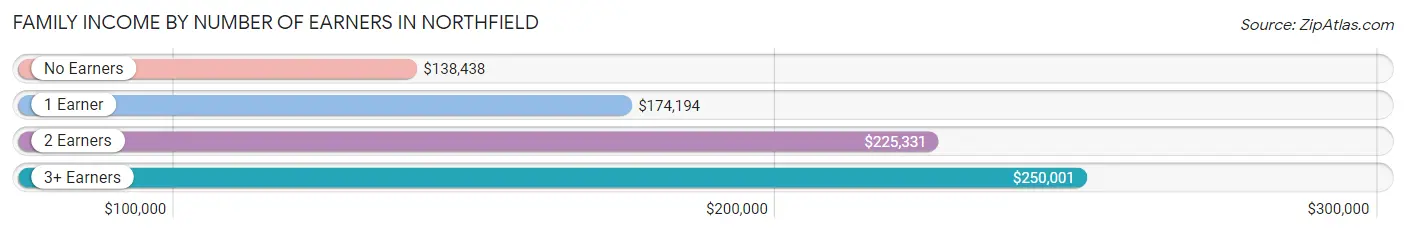
| Number of Earners | # Families | Median Income |
| No Earners | 289 (17.1%) | $138,438 |
| 1 Earner | 435 (25.7%) | $174,194 |
| 2 Earners | 837 (49.4%) | $225,331 |
| 3+ Earners | 134 (7.9%) | $250,001 |
| Total | 1,695 (100.0%) | $205,481 |
Household Income in Northfield
Household Income Brackets in Northfield
With 943 households falling in the category, the $200,000+ income range is the most frequent in Northfield, accounting for 40.3% of all households. In contrast, only 35 households (1.5%) fall into the $10,000 to $14,999 income bracket, making it the least populous group.
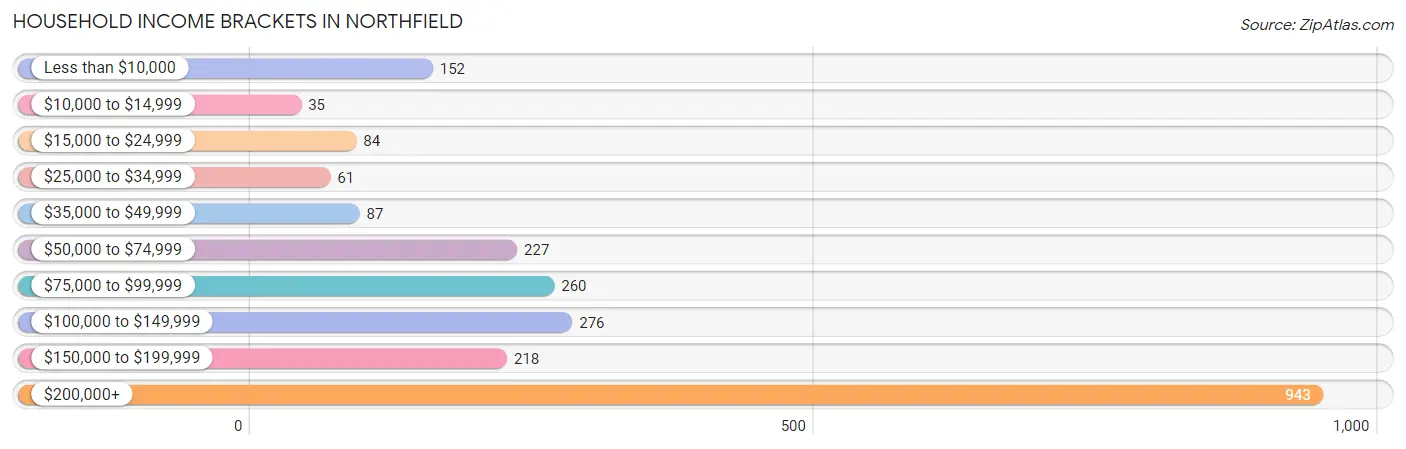
| Income Bracket | # Households | % Households |
| Less than $10,000 | 152 | 6.5% |
| $10,000 to $14,999 | 35 | 1.5% |
| $15,000 to $24,999 | 84 | 3.6% |
| $25,000 to $34,999 | 61 | 2.6% |
| $35,000 to $49,999 | 87 | 3.7% |
| $50,000 to $74,999 | 227 | 9.7% |
| $75,000 to $99,999 | 260 | 11.1% |
| $100,000 to $149,999 | 276 | 11.8% |
| $150,000 to $199,999 | 218 | 9.3% |
| $200,000+ | 943 | 40.3% |
Household Income by Householder Age in Northfield
The median household income in Northfield is $146,538, with the highest median household income of $173,799 found in the 45 to 64 years age bracket for the primary householder. A total of 971 households (41.5%) fall into this category. Meanwhile, the 15 to 24 years age bracket for the primary householder has the lowest median household income of $0, with 25 households (1.1%) in this group.
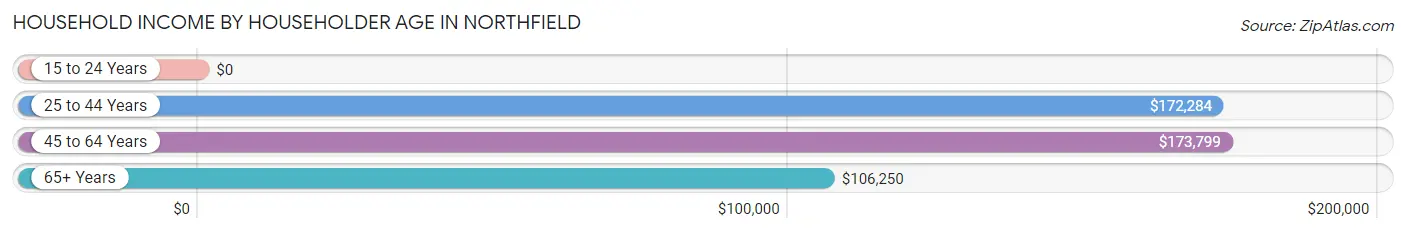
| Income Bracket | # Households | Median Income |
| 15 to 24 Years | 25 (1.1%) | $0 |
| 25 to 44 Years | 395 (16.9%) | $172,284 |
| 45 to 64 Years | 971 (41.5%) | $173,799 |
| 65+ Years | 949 (40.6%) | $106,250 |
| Total | 2,340 (100.0%) | $146,538 |
Poverty in Northfield
Income Below Poverty by Sex and Age in Northfield
With 6.5% poverty level for males and 5.3% for females among the residents of Northfield, 16 and 17 year old males and 18 to 24 year old females are the most vulnerable to poverty, with 23 males (36.5%) and 15 females (10.1%) in their respective age groups living below the poverty level.
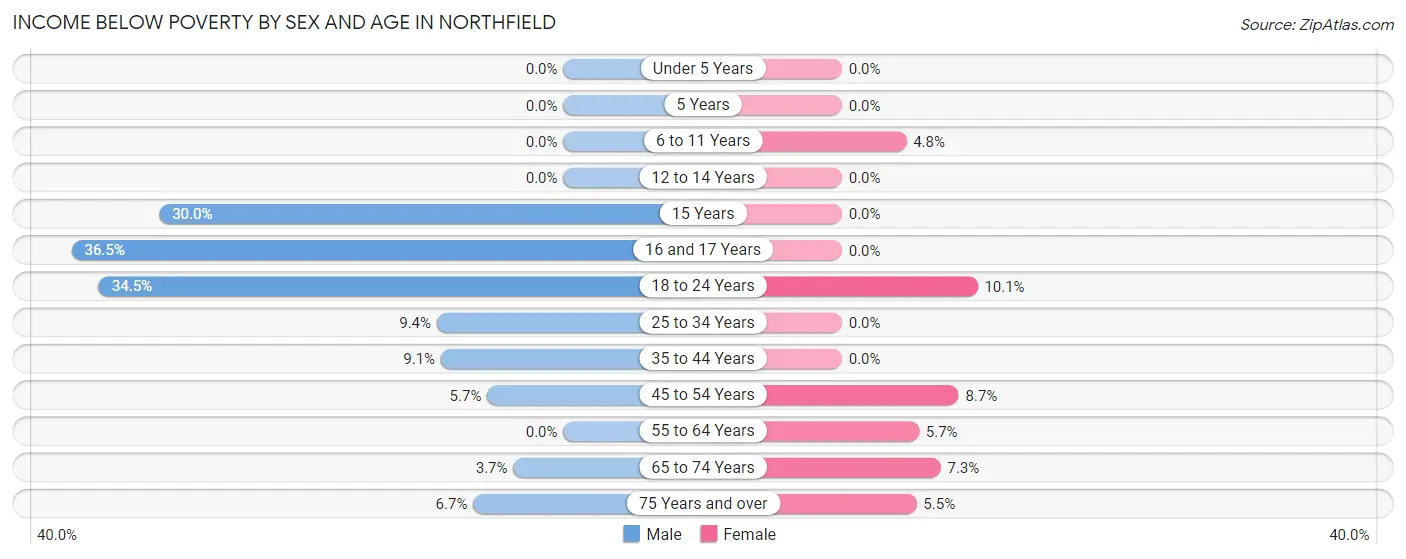
| Age Bracket | Male | Female |
| Under 5 Years | 0 (0.0%) | 0 (0.0%) |
| 5 Years | 0 (0.0%) | 0 (0.0%) |
| 6 to 11 Years | 0 (0.0%) | 20 (4.8%) |
| 12 to 14 Years | 0 (0.0%) | 0 (0.0%) |
| 15 Years | 9 (30.0%) | 0 (0.0%) |
| 16 and 17 Years | 23 (36.5%) | 0 (0.0%) |
| 18 to 24 Years | 30 (34.5%) | 15 (10.1%) |
| 25 to 34 Years | 17 (9.4%) | 0 (0.0%) |
| 35 to 44 Years | 29 (9.1%) | 0 (0.0%) |
| 45 to 54 Years | 32 (5.7%) | 50 (8.7%) |
| 55 to 64 Years | 0 (0.0%) | 23 (5.7%) |
| 65 to 74 Years | 13 (3.7%) | 37 (7.3%) |
| 75 Years and over | 16 (6.7%) | 17 (5.5%) |
| Total | 169 (6.5%) | 162 (5.3%) |
Income Above Poverty by Sex and Age in Northfield
According to the poverty statistics in Northfield, males aged under 5 years and females aged under 5 years are the age groups that are most secure financially, with 100.0% of males and 100.0% of females in these age groups living above the poverty line.
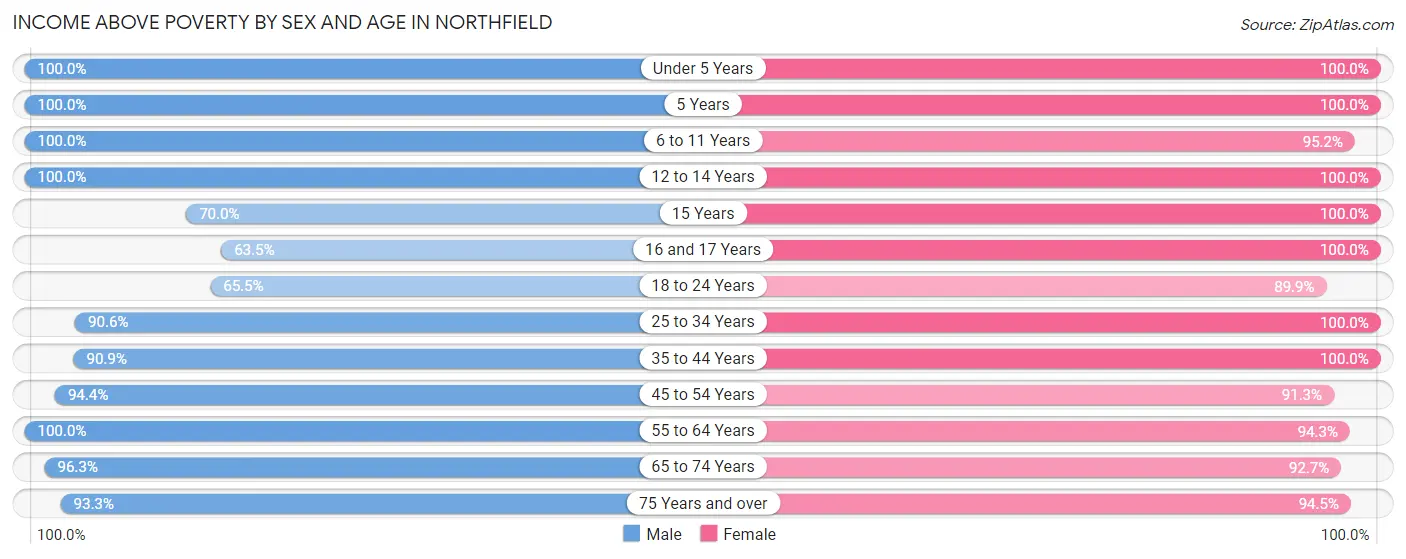
| Age Bracket | Male | Female |
| Under 5 Years | 95 (100.0%) | 136 (100.0%) |
| 5 Years | 65 (100.0%) | 17 (100.0%) |
| 6 to 11 Years | 109 (100.0%) | 398 (95.2%) |
| 12 to 14 Years | 166 (100.0%) | 96 (100.0%) |
| 15 Years | 21 (70.0%) | 24 (100.0%) |
| 16 and 17 Years | 40 (63.5%) | 131 (100.0%) |
| 18 to 24 Years | 57 (65.5%) | 134 (89.9%) |
| 25 to 34 Years | 164 (90.6%) | 47 (100.0%) |
| 35 to 44 Years | 290 (90.9%) | 267 (100.0%) |
| 45 to 54 Years | 534 (94.4%) | 527 (91.3%) |
| 55 to 64 Years | 351 (100.0%) | 379 (94.3%) |
| 65 to 74 Years | 337 (96.3%) | 468 (92.7%) |
| 75 Years and over | 223 (93.3%) | 290 (94.5%) |
| Total | 2,452 (93.5%) | 2,914 (94.7%) |
Income Below Poverty Among Married-Couple Families in Northfield
The poverty statistics for married-couple families in Northfield show that 2.9% or 44 of the total 1,527 families live below the poverty line. Families with no children have the highest poverty rate of 5.1%, comprising of 44 families. On the other hand, families with 1 or 2 children have the lowest poverty rate of 0.0%, which includes 0 families.
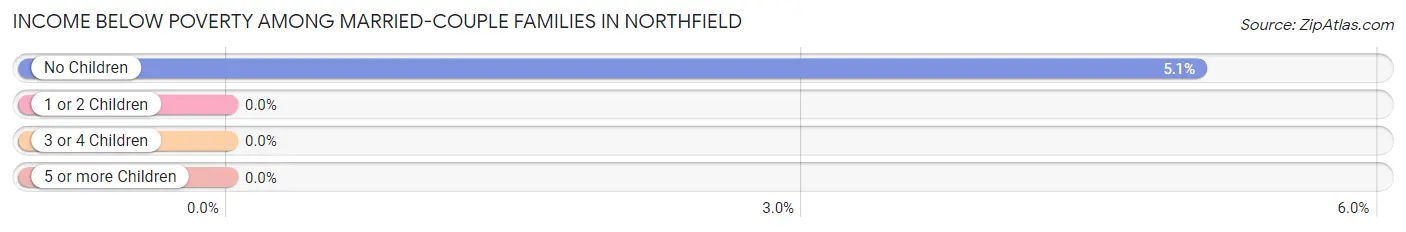
| Children | Above Poverty | Below Poverty |
| No Children | 825 (94.9%) | 44 (5.1%) |
| 1 or 2 Children | 536 (100.0%) | 0 (0.0%) |
| 3 or 4 Children | 122 (100.0%) | 0 (0.0%) |
| 5 or more Children | 0 (0.0%) | 0 (0.0%) |
| Total | 1,483 (97.1%) | 44 (2.9%) |
Income Below Poverty Among Single-Parent Households in Northfield
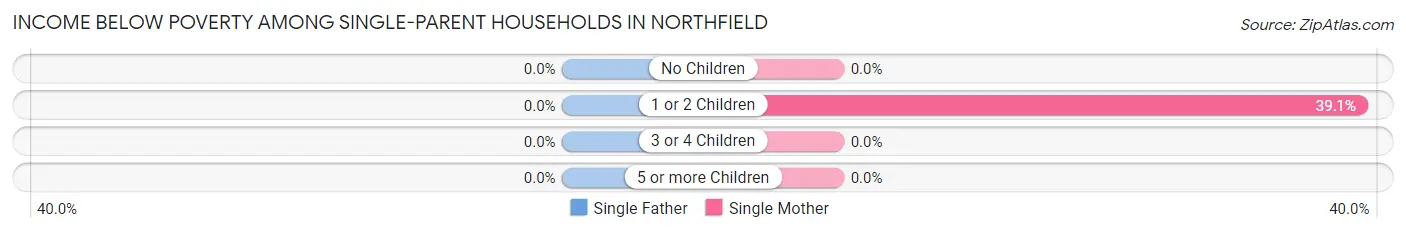
| Children | Single Father | Single Mother |
| No Children | 0 (0.0%) | 0 (0.0%) |
| 1 or 2 Children | 0 (0.0%) | 41 (39.1%) |
| 3 or 4 Children | 0 (0.0%) | 0 (0.0%) |
| 5 or more Children | 0 (0.0%) | 0 (0.0%) |
| Total | 0 (0.0%) | 41 (32.8%) |
Income Below Poverty Among Married-Couple vs Single-Parent Households in Northfield
The poverty data for Northfield shows that 44 of the married-couple family households (2.9%) and 41 of the single-parent households (24.4%) are living below the poverty level. Within the married-couple family households, those with no children have the highest poverty rate, with 44 households (5.1%) falling below the poverty line. Among the single-parent households, those with 1 or 2 children have the highest poverty rate, with 41 household (35.3%) living below poverty.
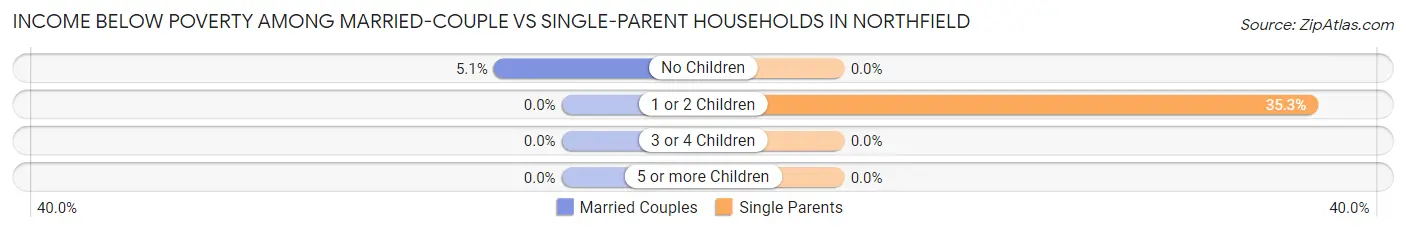
| Children | Married-Couple Families | Single-Parent Households |
| No Children | 44 (5.1%) | 0 (0.0%) |
| 1 or 2 Children | 0 (0.0%) | 41 (35.3%) |
| 3 or 4 Children | 0 (0.0%) | 0 (0.0%) |
| 5 or more Children | 0 (0.0%) | 0 (0.0%) |
| Total | 44 (2.9%) | 41 (24.4%) |
Employment Characteristics in Northfield
Employment by Class of Employer in Northfield
Among the 2,544 employed individuals in Northfield, private company employees (1,463 | 57.5%), self-employed (incorporated) (387 | 15.2%), and self-employed (not incorporated) (274 | 10.8%) make up the most common classes of employment.
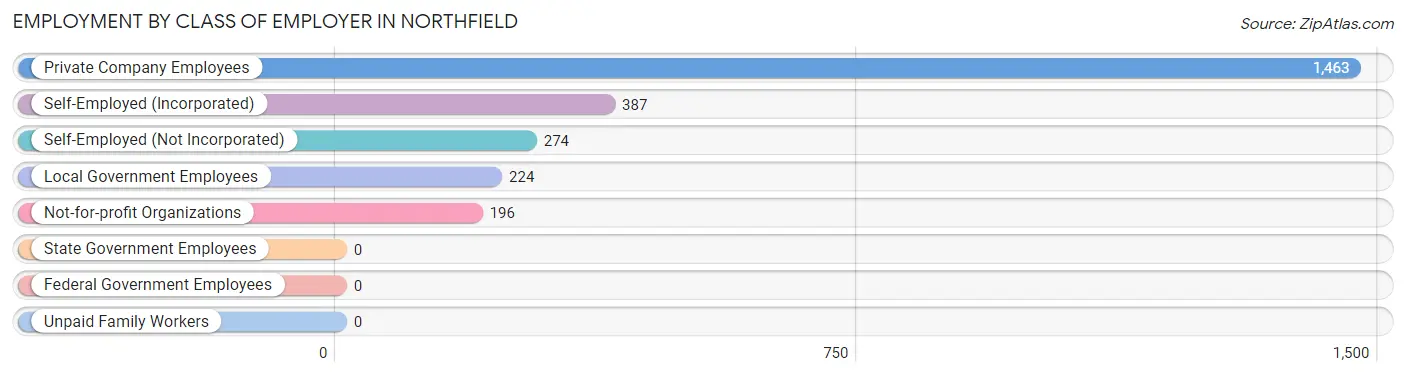
| Employer Class | # Employees | % Employees |
| Private Company Employees | 1,463 | 57.5% |
| Self-Employed (Incorporated) | 387 | 15.2% |
| Self-Employed (Not Incorporated) | 274 | 10.8% |
| Not-for-profit Organizations | 196 | 7.7% |
| Local Government Employees | 224 | 8.8% |
| State Government Employees | 0 | 0.0% |
| Federal Government Employees | 0 | 0.0% |
| Unpaid Family Workers | 0 | 0.0% |
| Total | 2,544 | 100.0% |
Employment Status by Age in Northfield
According to the labor force statistics for Northfield, out of the total population over 16 years of age (4,542), 59.1% or 2,684 individuals are in the labor force, with 1.5% or 40 of them unemployed. The age group with the highest labor force participation rate is 25 to 29 years, with 93.8% or 76 individuals in the labor force. Within the labor force, the 25 to 29 years age range has the highest percentage of unemployed individuals, with 11.8% or 9 of them being unemployed.
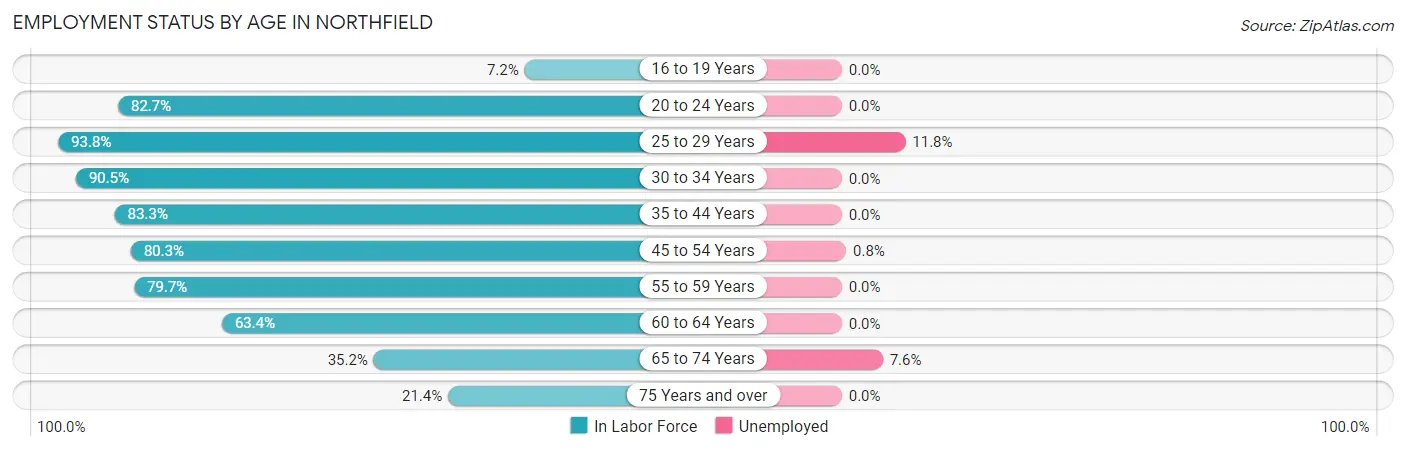
| Age Bracket | In Labor Force | Unemployed |
| 16 to 19 Years | 23 (7.2%) | 0 (0.0%) |
| 20 to 24 Years | 91 (82.7%) | 0 (0.0%) |
| 25 to 29 Years | 76 (93.8%) | 9 (11.8%) |
| 30 to 34 Years | 134 (90.5%) | 0 (0.0%) |
| 35 to 44 Years | 488 (83.3%) | 0 (0.0%) |
| 45 to 54 Years | 918 (80.3%) | 7 (0.8%) |
| 55 to 59 Years | 287 (79.7%) | 0 (0.0%) |
| 60 to 64 Years | 249 (63.4%) | 0 (0.0%) |
| 65 to 74 Years | 301 (35.2%) | 23 (7.6%) |
| 75 Years and over | 117 (21.4%) | 0 (0.0%) |
| Total | 2,684 (59.1%) | 40 (1.5%) |
Employment Status by Educational Attainment in Northfield
According to labor force statistics for Northfield, 79.4% of individuals (2,153) out of the total population between 25 and 64 years of age (2,711) are in the labor force, with 0.7% or 15 of them being unemployed. The group with the highest labor force participation rate are those with the educational attainment of college / associate degree, with 90.2% or 379 individuals in the labor force. Within the labor force, individuals with bachelor's degree or higher education have the highest percentage of unemployment, with 0.9% or 16 of them being unemployed.
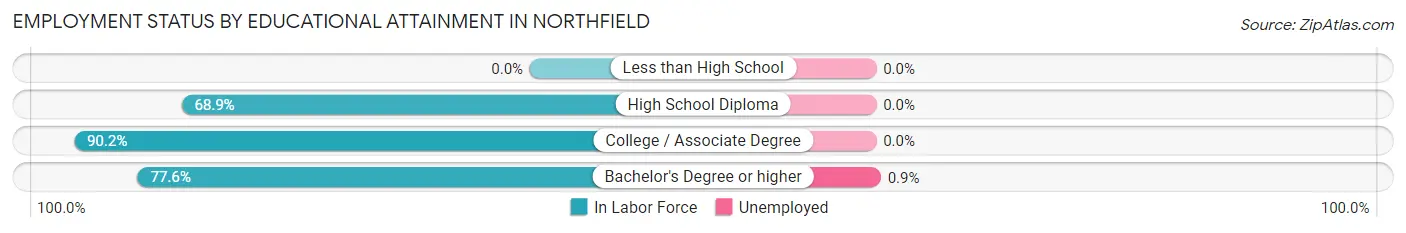
| Educational Attainment | In Labor Force | Unemployed |
| Less than High School | 0 (0.0%) | 0 (0.0%) |
| High School Diploma | 42 (68.9%) | 0 (0.0%) |
| College / Associate Degree | 379 (90.2%) | 0 (0.0%) |
| Bachelor's Degree or higher | 1,730 (77.6%) | 20 (0.9%) |
| Total | 2,153 (79.4%) | 19 (0.7%) |
Employment Occupations by Sex in Northfield
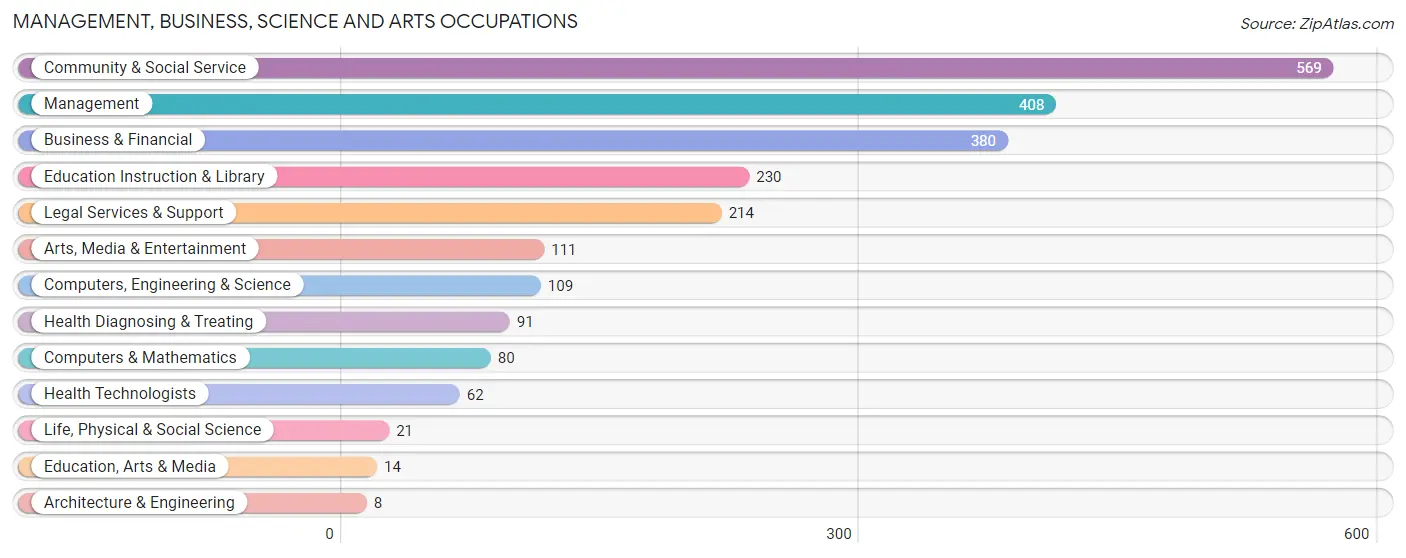
Management, Business, Science and Arts Occupations
The most common Management, Business, Science and Arts occupations in Northfield are Community & Social Service (569 | 21.5%), Management (408 | 15.4%), Business & Financial (380 | 14.4%), Education Instruction & Library (230 | 8.7%), and Legal Services & Support (214 | 8.1%).
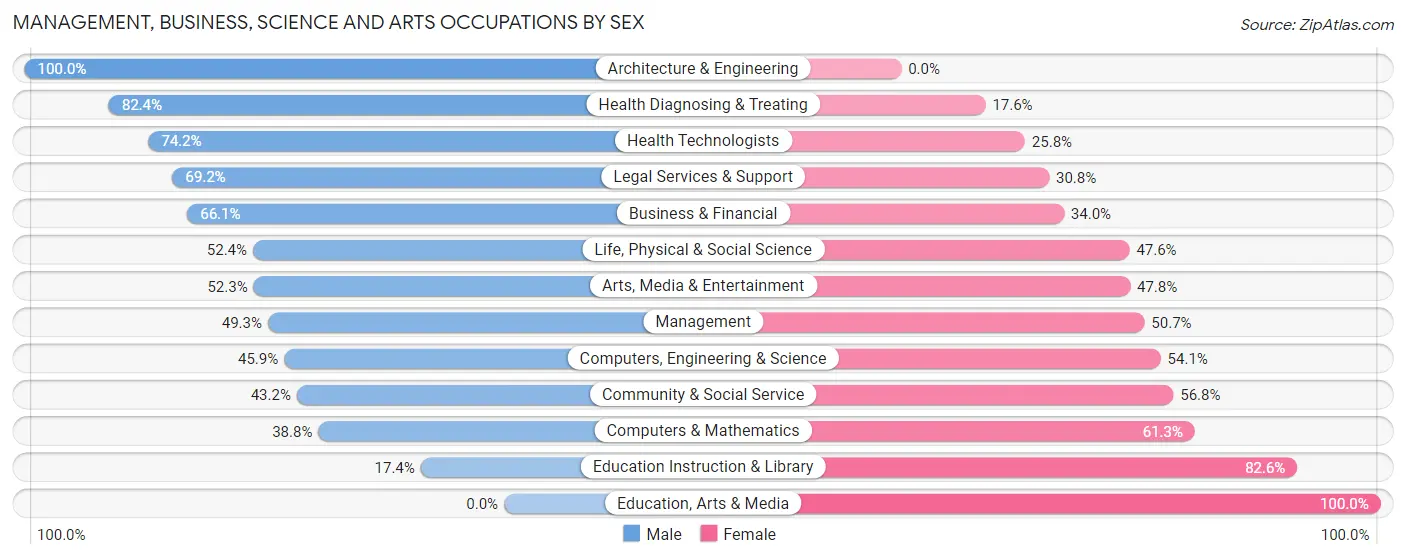
Management, Business, Science and Arts Occupations by Sex
Within the Management, Business, Science and Arts occupations in Northfield, the most male-oriented occupations are Architecture & Engineering (100.0%), Health Diagnosing & Treating (82.4%), and Health Technologists (74.2%), while the most female-oriented occupations are Education, Arts & Media (100.0%), Education Instruction & Library (82.6%), and Computers & Mathematics (61.3%).
| Occupation | Male | Female |
| Management | 201 (49.3%) | 207 (50.7%) |
| Business & Financial | 251 (66.0%) | 129 (34.0%) |
| Computers, Engineering & Science | 50 (45.9%) | 59 (54.1%) |
| Computers & Mathematics | 31 (38.8%) | 49 (61.3%) |
| Architecture & Engineering | 8 (100.0%) | 0 (0.0%) |
| Life, Physical & Social Science | 11 (52.4%) | 10 (47.6%) |
| Community & Social Service | 246 (43.2%) | 323 (56.8%) |
| Education, Arts & Media | 0 (0.0%) | 14 (100.0%) |
| Legal Services & Support | 148 (69.2%) | 66 (30.8%) |
| Education Instruction & Library | 40 (17.4%) | 190 (82.6%) |
| Arts, Media & Entertainment | 58 (52.2%) | 53 (47.7%) |
| Health Diagnosing & Treating | 75 (82.4%) | 16 (17.6%) |
| Health Technologists | 46 (74.2%) | 16 (25.8%) |
| Total (Category) | 823 (52.9%) | 734 (47.1%) |
| Total (Overall) | 1,560 (59.0%) | 1,085 (41.0%) |
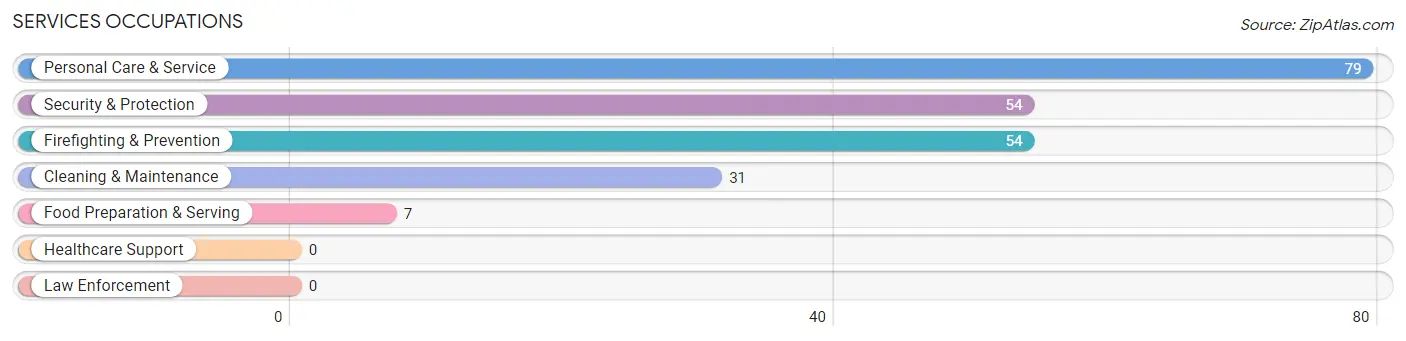
Services Occupations
The most common Services occupations in Northfield are Personal Care & Service (79 | 3.0%), Security & Protection (54 | 2.0%), Firefighting & Prevention (54 | 2.0%), Cleaning & Maintenance (31 | 1.2%), and Food Preparation & Serving (7 | 0.3%).
Services Occupations by Sex
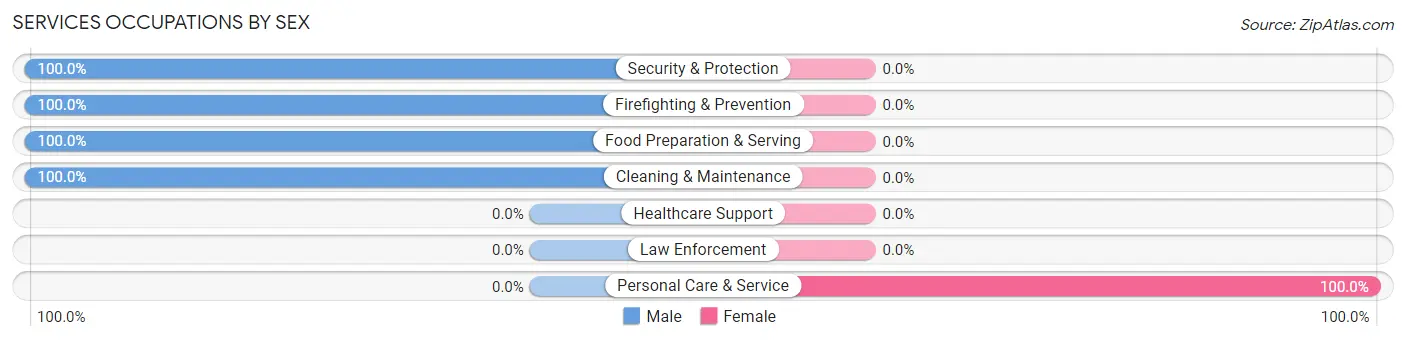
| Occupation | Male | Female |
| Healthcare Support | 0 (0.0%) | 0 (0.0%) |
| Security & Protection | 54 (100.0%) | 0 (0.0%) |
| Firefighting & Prevention | 54 (100.0%) | 0 (0.0%) |
| Law Enforcement | 0 (0.0%) | 0 (0.0%) |
| Food Preparation & Serving | 7 (100.0%) | 0 (0.0%) |
| Cleaning & Maintenance | 31 (100.0%) | 0 (0.0%) |
| Personal Care & Service | 0 (0.0%) | 79 (100.0%) |
| Total (Category) | 92 (53.8%) | 79 (46.2%) |
| Total (Overall) | 1,560 (59.0%) | 1,085 (41.0%) |
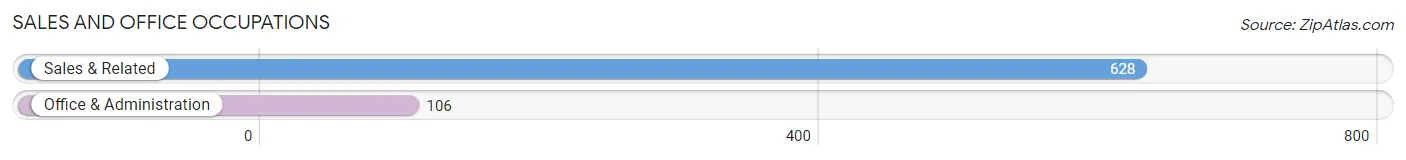
Sales and Office Occupations
The most common Sales and Office occupations in Northfield are Sales & Related (628 | 23.7%), and Office & Administration (106 | 4.0%).
Sales and Office Occupations by Sex
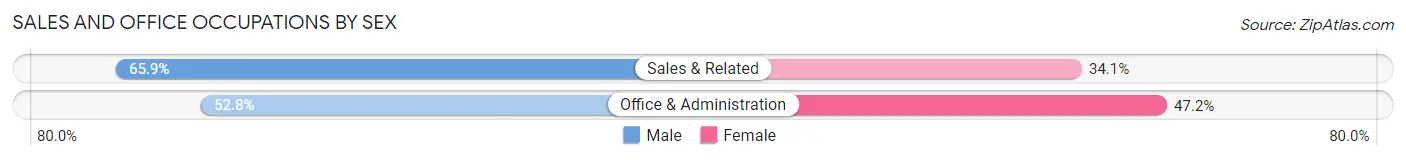
| Occupation | Male | Female |
| Sales & Related | 414 (65.9%) | 214 (34.1%) |
| Office & Administration | 56 (52.8%) | 50 (47.2%) |
| Total (Category) | 470 (64.0%) | 264 (36.0%) |
| Total (Overall) | 1,560 (59.0%) | 1,085 (41.0%) |
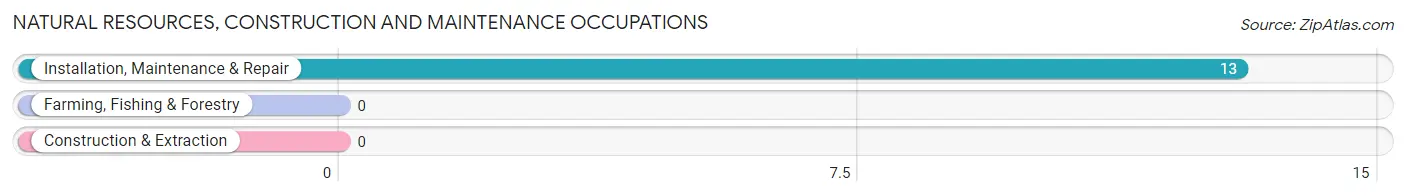
Natural Resources, Construction and Maintenance Occupations
The most common Natural Resources, Construction and Maintenance occupations in Northfield are , and Installation, Maintenance & Repair (13 | 0.5%).
Natural Resources, Construction and Maintenance Occupations by Sex
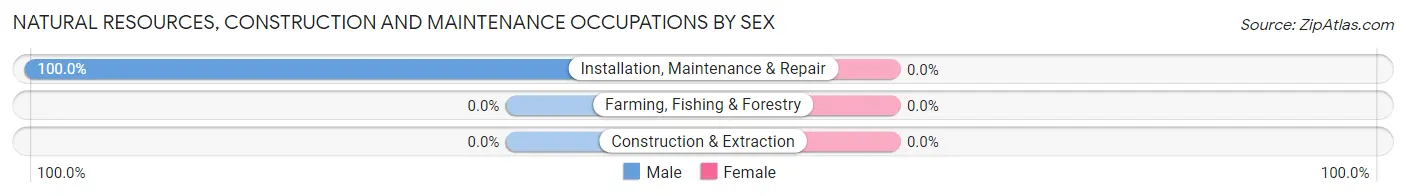
| Occupation | Male | Female |
| Farming, Fishing & Forestry | 0 (0.0%) | 0 (0.0%) |
| Construction & Extraction | 0 (0.0%) | 0 (0.0%) |
| Installation, Maintenance & Repair | 13 (100.0%) | 0 (0.0%) |
| Total (Category) | 13 (100.0%) | 0 (0.0%) |
| Total (Overall) | 1,560 (59.0%) | 1,085 (41.0%) |
Production, Transportation and Moving Occupations
The most common Production, Transportation and Moving occupations in Northfield are Transportation (159 | 6.0%), and Production (11 | 0.4%).
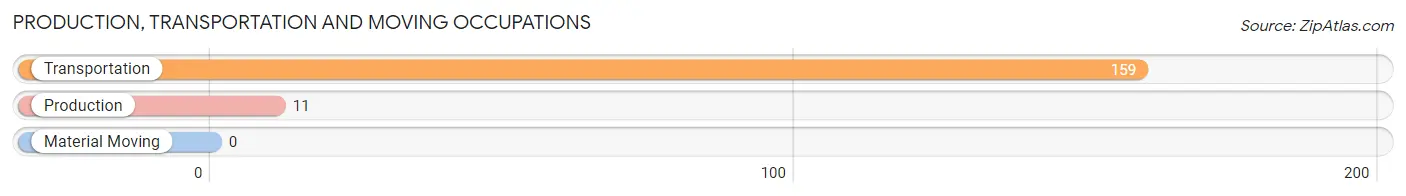
Production, Transportation and Moving Occupations by Sex
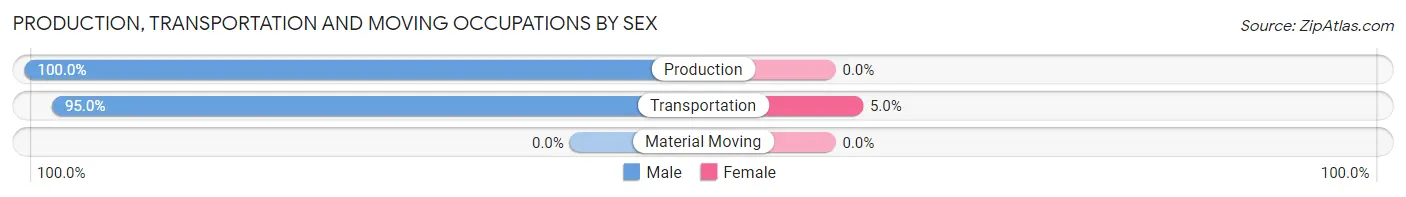
| Occupation | Male | Female |
| Production | 11 (100.0%) | 0 (0.0%) |
| Transportation | 151 (95.0%) | 8 (5.0%) |
| Material Moving | 0 (0.0%) | 0 (0.0%) |
| Total (Category) | 162 (95.3%) | 8 (4.7%) |
| Total (Overall) | 1,560 (59.0%) | 1,085 (41.0%) |
Employment Industries by Sex in Northfield
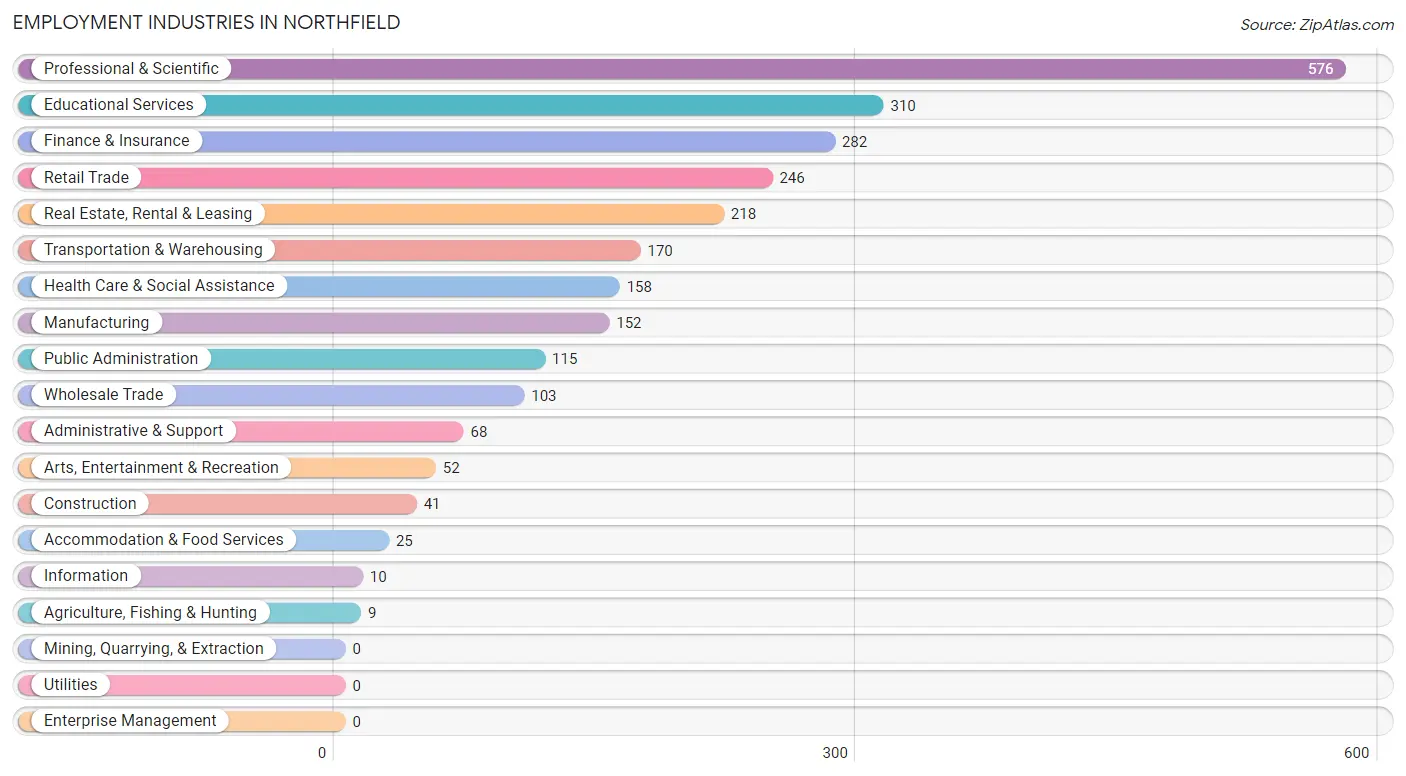
Employment Industries in Northfield
The major employment industries in Northfield include Professional & Scientific (576 | 21.8%), Educational Services (310 | 11.7%), Finance & Insurance (282 | 10.7%), Retail Trade (246 | 9.3%), and Real Estate, Rental & Leasing (218 | 8.2%).
Employment Industries by Sex in Northfield
The Northfield industries that see more men than women are Information (100.0%), Transportation & Warehousing (95.3%), and Real Estate, Rental & Leasing (89.9%), whereas the industries that tend to have a higher number of women are Agriculture, Fishing & Hunting (100.0%), Educational Services (82.9%), and Retail Trade (82.5%).
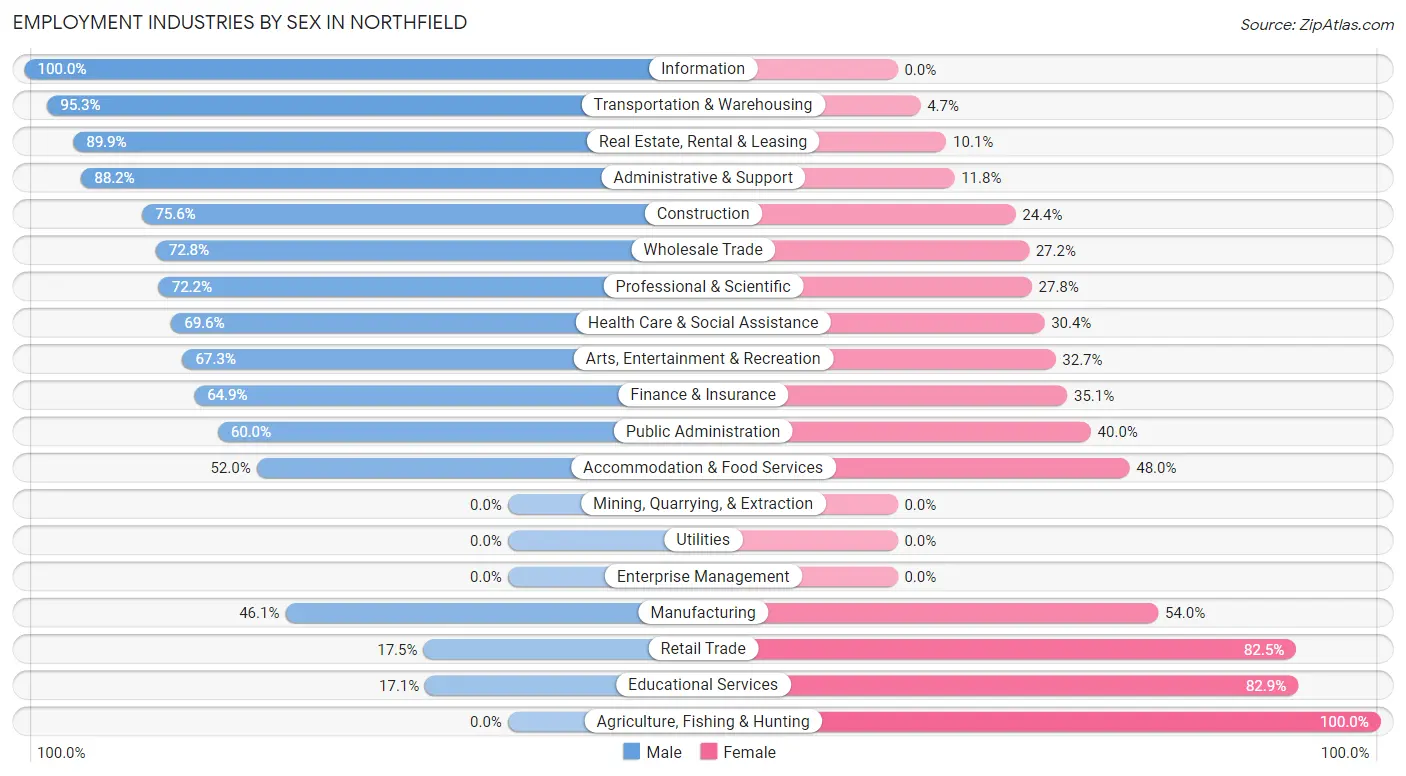
| Industry | Male | Female |
| Agriculture, Fishing & Hunting | 0 (0.0%) | 9 (100.0%) |
| Mining, Quarrying, & Extraction | 0 (0.0%) | 0 (0.0%) |
| Construction | 31 (75.6%) | 10 (24.4%) |
| Manufacturing | 70 (46.1%) | 82 (53.9%) |
| Wholesale Trade | 75 (72.8%) | 28 (27.2%) |
| Retail Trade | 43 (17.5%) | 203 (82.5%) |
| Transportation & Warehousing | 162 (95.3%) | 8 (4.7%) |
| Utilities | 0 (0.0%) | 0 (0.0%) |
| Information | 10 (100.0%) | 0 (0.0%) |
| Finance & Insurance | 183 (64.9%) | 99 (35.1%) |
| Real Estate, Rental & Leasing | 196 (89.9%) | 22 (10.1%) |
| Professional & Scientific | 416 (72.2%) | 160 (27.8%) |
| Enterprise Management | 0 (0.0%) | 0 (0.0%) |
| Administrative & Support | 60 (88.2%) | 8 (11.8%) |
| Educational Services | 53 (17.1%) | 257 (82.9%) |
| Health Care & Social Assistance | 110 (69.6%) | 48 (30.4%) |
| Arts, Entertainment & Recreation | 35 (67.3%) | 17 (32.7%) |
| Accommodation & Food Services | 13 (52.0%) | 12 (48.0%) |
| Public Administration | 69 (60.0%) | 46 (40.0%) |
| Total | 1,560 (59.0%) | 1,085 (41.0%) |
Education in Northfield
School Enrollment in Northfield
The most common levels of schooling among the 1,520 students in Northfield are middle school (406 | 26.7%), high school (318 | 20.9%), and elementary school (314 | 20.7%).
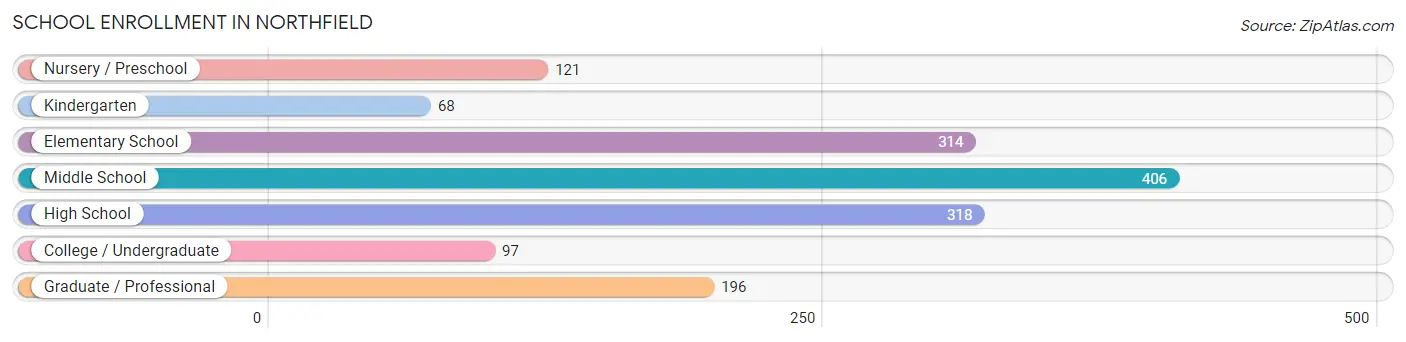
| School Level | # Students | % Students |
| Nursery / Preschool | 121 | 8.0% |
| Kindergarten | 68 | 4.5% |
| Elementary School | 314 | 20.7% |
| Middle School | 406 | 26.7% |
| High School | 318 | 20.9% |
| College / Undergraduate | 97 | 6.4% |
| Graduate / Professional | 196 | 12.9% |
| Total | 1,520 | 100.0% |
School Enrollment by Age by Funding Source in Northfield
Out of a total of 1,520 students who are enrolled in schools in Northfield, 477 (31.4%) attend a private institution, while the remaining 1,043 (68.6%) are enrolled in public schools. The age group of 3 to 4 year olds has the highest likelihood of being enrolled in private schools, with 84 (100.0% in the age bracket) enrolled. Conversely, the age group of 20 to 24 year olds has the lowest likelihood of being enrolled in a private school, with 63 (94.0% in the age bracket) attending a public institution.
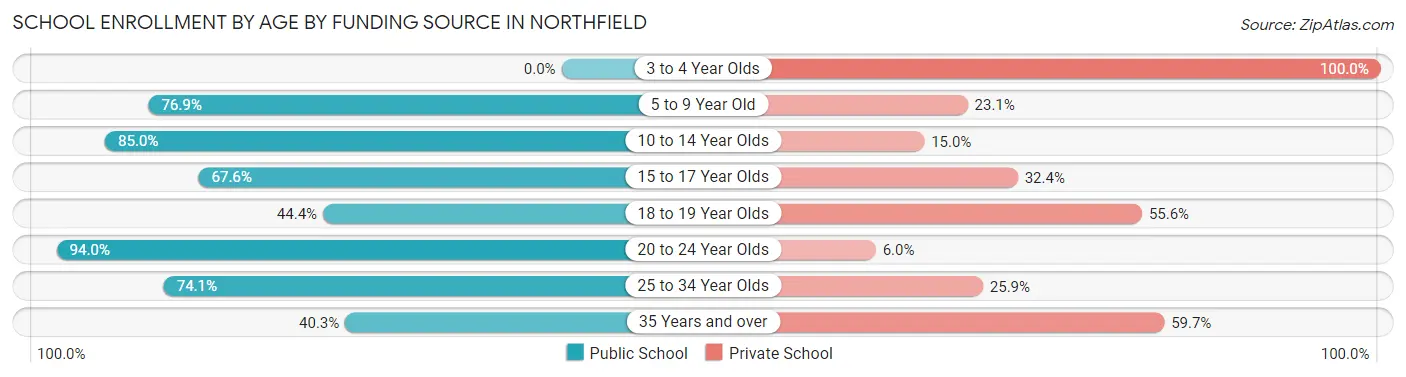
| Age Bracket | Public School | Private School |
| 3 to 4 Year Olds | 0 (0.0%) | 84 (100.0%) |
| 5 to 9 Year Old | 310 (76.9%) | 93 (23.1%) |
| 10 to 14 Year Olds | 391 (85.0%) | 69 (15.0%) |
| 15 to 17 Year Olds | 148 (67.6%) | 71 (32.4%) |
| 18 to 19 Year Olds | 56 (44.4%) | 70 (55.6%) |
| 20 to 24 Year Olds | 63 (94.0%) | 4 (6.0%) |
| 25 to 34 Year Olds | 20 (74.1%) | 7 (25.9%) |
| 35 Years and over | 54 (40.3%) | 80 (59.7%) |
| Total | 1,043 (68.6%) | 477 (31.4%) |
Educational Attainment by Field of Study in Northfield
Business (824 | 24.1%), liberal arts & history (375 | 11.0%), social sciences (327 | 9.6%), literature & languages (295 | 8.6%), and science & technology (247 | 7.2%) are the most common fields of study among 3,422 individuals in Northfield who have obtained a bachelor's degree or higher.
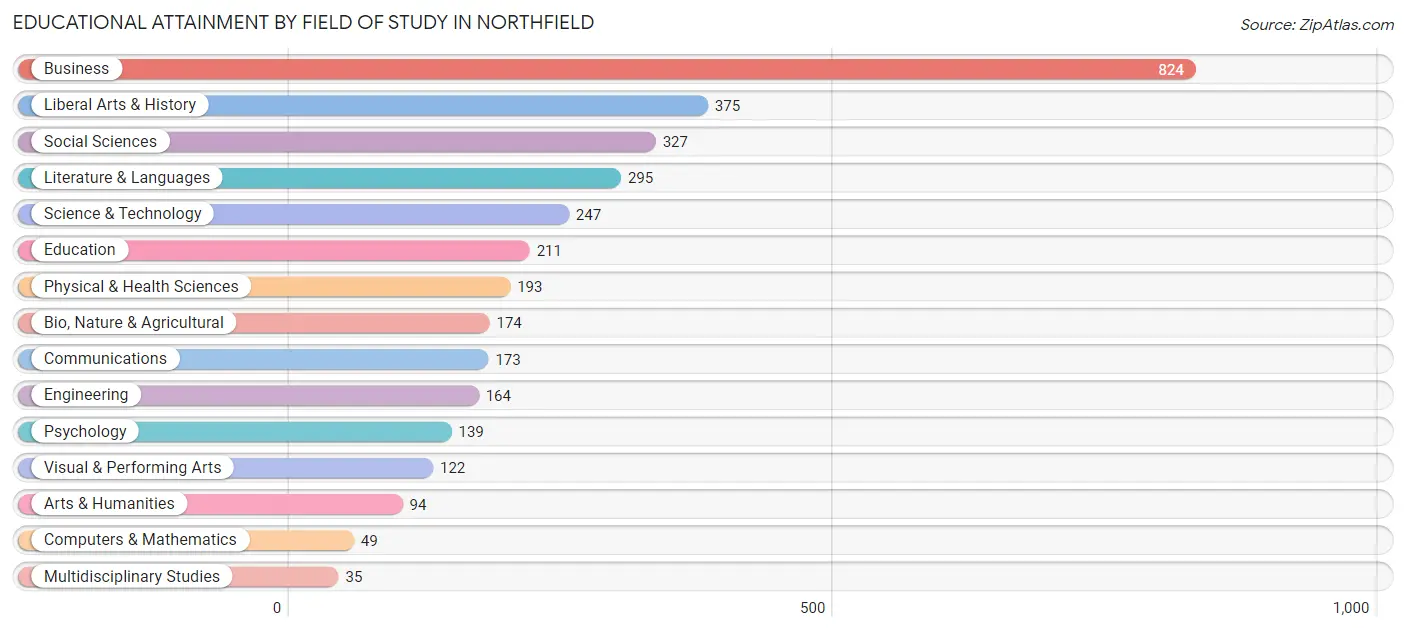
| Field of Study | # Graduates | % Graduates |
| Computers & Mathematics | 49 | 1.4% |
| Bio, Nature & Agricultural | 174 | 5.1% |
| Physical & Health Sciences | 193 | 5.6% |
| Psychology | 139 | 4.1% |
| Social Sciences | 327 | 9.6% |
| Engineering | 164 | 4.8% |
| Multidisciplinary Studies | 35 | 1.0% |
| Science & Technology | 247 | 7.2% |
| Business | 824 | 24.1% |
| Education | 211 | 6.2% |
| Literature & Languages | 295 | 8.6% |
| Liberal Arts & History | 375 | 11.0% |
| Visual & Performing Arts | 122 | 3.6% |
| Communications | 173 | 5.1% |
| Arts & Humanities | 94 | 2.8% |
| Total | 3,422 | 100.0% |
Transportation & Commute in Northfield
Vehicle Availability by Sex in Northfield
The most prevalent vehicle ownership categories in Northfield are males with 2 vehicles (866, accounting for 57.0%) and females with 2 vehicles (593, making up 84.5%).
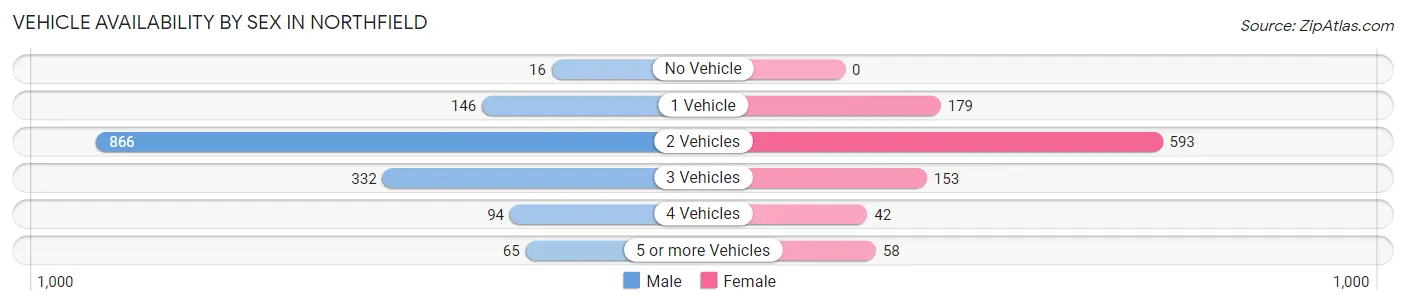
| Vehicles Available | Male | Female |
| No Vehicle | 16 (1.1%) | 0 (0.0%) |
| 1 Vehicle | 146 (9.6%) | 179 (17.5%) |
| 2 Vehicles | 866 (57.0%) | 593 (57.9%) |
| 3 Vehicles | 332 (21.9%) | 153 (14.9%) |
| 4 Vehicles | 94 (6.2%) | 42 (4.1%) |
| 5 or more Vehicles | 65 (4.3%) | 58 (5.7%) |
| Total | 1,519 (100.0%) | 1,025 (100.0%) |
Commute Time in Northfield
The most frequently occuring commute durations in Northfield are 10 to 14 minutes (313 commuters, 16.7%), 15 to 19 minutes (269 commuters, 14.4%), and 20 to 24 minutes (262 commuters, 14.0%).
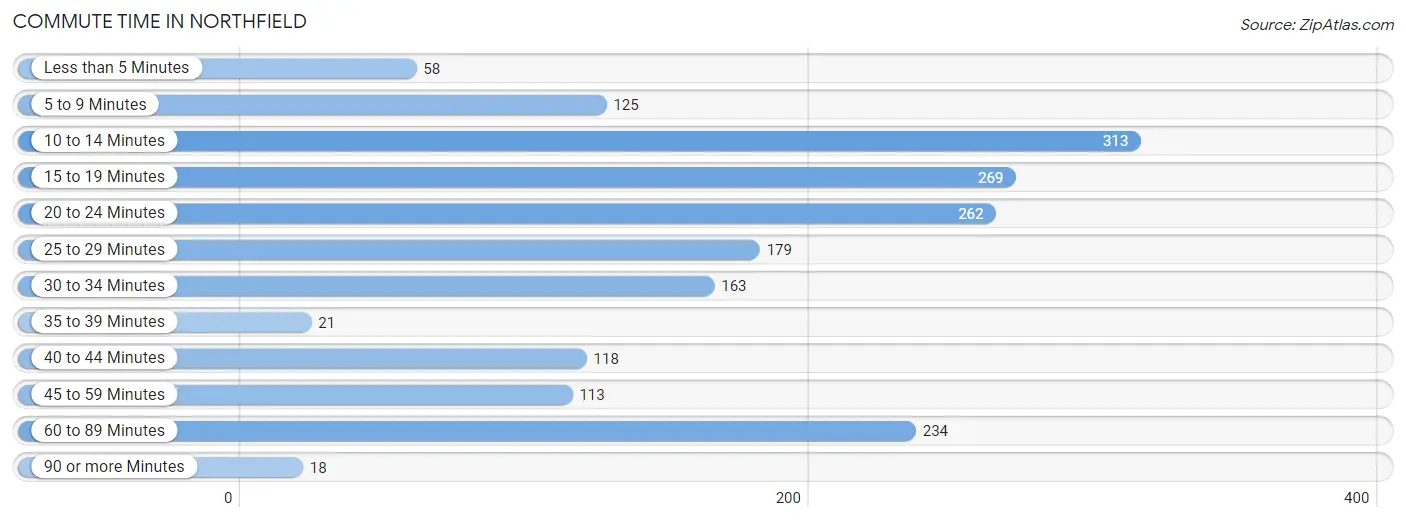
| Commute Time | # Commuters | % Commuters |
| Less than 5 Minutes | 58 | 3.1% |
| 5 to 9 Minutes | 125 | 6.7% |
| 10 to 14 Minutes | 313 | 16.7% |
| 15 to 19 Minutes | 269 | 14.4% |
| 20 to 24 Minutes | 262 | 14.0% |
| 25 to 29 Minutes | 179 | 9.6% |
| 30 to 34 Minutes | 163 | 8.7% |
| 35 to 39 Minutes | 21 | 1.1% |
| 40 to 44 Minutes | 118 | 6.3% |
| 45 to 59 Minutes | 113 | 6.0% |
| 60 to 89 Minutes | 234 | 12.5% |
| 90 or more Minutes | 18 | 1.0% |
Commute Time by Sex in Northfield
The most common commute times in Northfield are 15 to 19 minutes (222 commuters, 18.5%) for males and 10 to 14 minutes (221 commuters, 32.7%) for females.

| Commute Time | Male | Female |
| Less than 5 Minutes | 29 (2.4%) | 29 (4.3%) |
| 5 to 9 Minutes | 27 (2.3%) | 98 (14.5%) |
| 10 to 14 Minutes | 92 (7.7%) | 221 (32.7%) |
| 15 to 19 Minutes | 222 (18.5%) | 47 (7.0%) |
| 20 to 24 Minutes | 189 (15.8%) | 73 (10.8%) |
| 25 to 29 Minutes | 119 (9.9%) | 60 (8.9%) |
| 30 to 34 Minutes | 99 (8.3%) | 64 (9.5%) |
| 35 to 39 Minutes | 8 (0.7%) | 13 (1.9%) |
| 40 to 44 Minutes | 99 (8.3%) | 19 (2.8%) |
| 45 to 59 Minutes | 96 (8.0%) | 17 (2.5%) |
| 60 to 89 Minutes | 199 (16.6%) | 35 (5.2%) |
| 90 or more Minutes | 18 (1.5%) | 0 (0.0%) |
Time of Departure to Work by Sex in Northfield
The most frequent times of departure to work in Northfield are 6:00 AM to 6:29 AM (237, 19.8%) for males and 7:30 AM to 7:59 AM (143, 21.1%) for females.
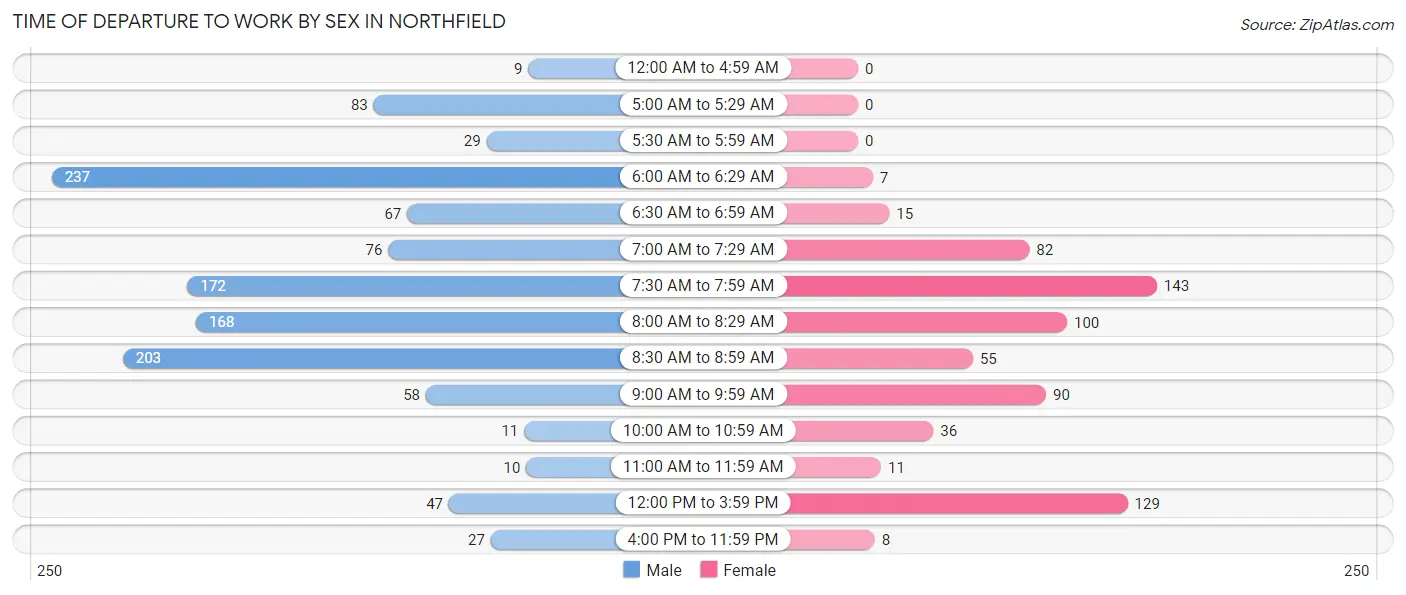
| Time of Departure | Male | Female |
| 12:00 AM to 4:59 AM | 9 (0.7%) | 0 (0.0%) |
| 5:00 AM to 5:29 AM | 83 (6.9%) | 0 (0.0%) |
| 5:30 AM to 5:59 AM | 29 (2.4%) | 0 (0.0%) |
| 6:00 AM to 6:29 AM | 237 (19.8%) | 7 (1.0%) |
| 6:30 AM to 6:59 AM | 67 (5.6%) | 15 (2.2%) |
| 7:00 AM to 7:29 AM | 76 (6.4%) | 82 (12.1%) |
| 7:30 AM to 7:59 AM | 172 (14.4%) | 143 (21.1%) |
| 8:00 AM to 8:29 AM | 168 (14.0%) | 100 (14.8%) |
| 8:30 AM to 8:59 AM | 203 (17.0%) | 55 (8.1%) |
| 9:00 AM to 9:59 AM | 58 (4.9%) | 90 (13.3%) |
| 10:00 AM to 10:59 AM | 11 (0.9%) | 36 (5.3%) |
| 11:00 AM to 11:59 AM | 10 (0.8%) | 11 (1.6%) |
| 12:00 PM to 3:59 PM | 47 (3.9%) | 129 (19.1%) |
| 4:00 PM to 11:59 PM | 27 (2.3%) | 8 (1.2%) |
| Total | 1,197 (100.0%) | 676 (100.0%) |
Housing Occupancy in Northfield
Occupancy by Ownership in Northfield
Of the total 2,340 dwellings in Northfield, owner-occupied units account for 2,148 (91.8%), while renter-occupied units make up 192 (8.2%).
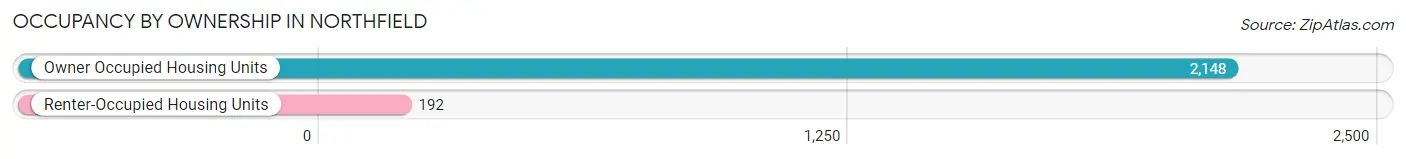
| Occupancy | # Housing Units | % Housing Units |
| Owner Occupied Housing Units | 2,148 | 91.8% |
| Renter-Occupied Housing Units | 192 | 8.2% |
| Total Occupied Housing Units | 2,340 | 100.0% |
Occupancy by Household Size in Northfield
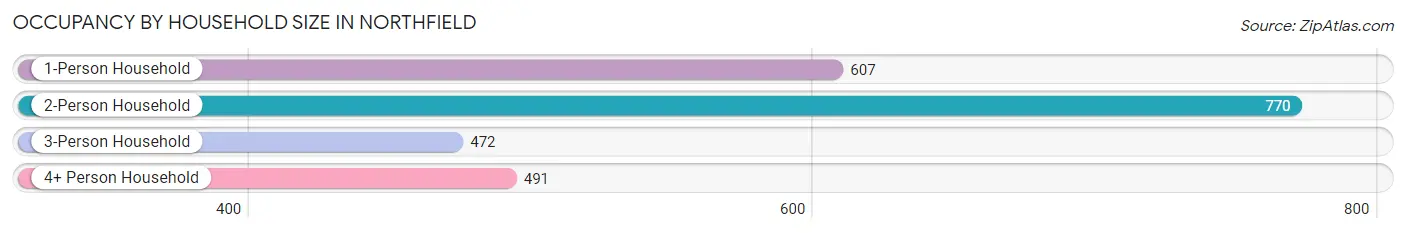
| Household Size | # Housing Units | % Housing Units |
| 1-Person Household | 607 | 25.9% |
| 2-Person Household | 770 | 32.9% |
| 3-Person Household | 472 | 20.2% |
| 4+ Person Household | 491 | 21.0% |
| Total Housing Units | 2,340 | 100.0% |
Occupancy by Ownership by Household Size in Northfield
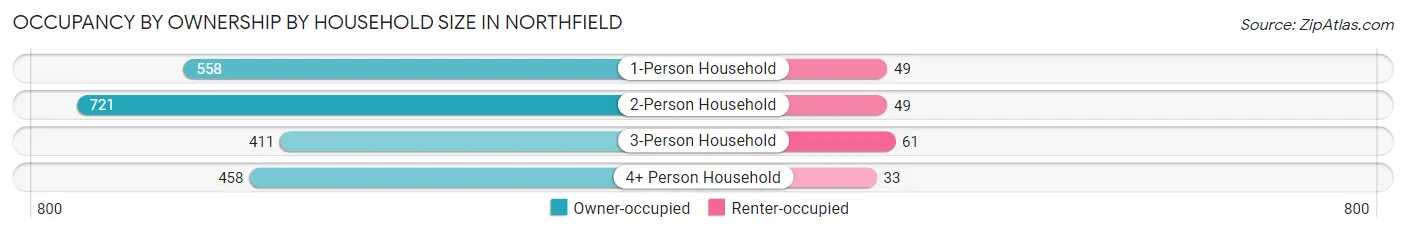
| Household Size | Owner-occupied | Renter-occupied |
| 1-Person Household | 558 (91.9%) | 49 (8.1%) |
| 2-Person Household | 721 (93.6%) | 49 (6.4%) |
| 3-Person Household | 411 (87.1%) | 61 (12.9%) |
| 4+ Person Household | 458 (93.3%) | 33 (6.7%) |
| Total Housing Units | 2,148 (91.8%) | 192 (8.2%) |
Occupancy by Educational Attainment in Northfield
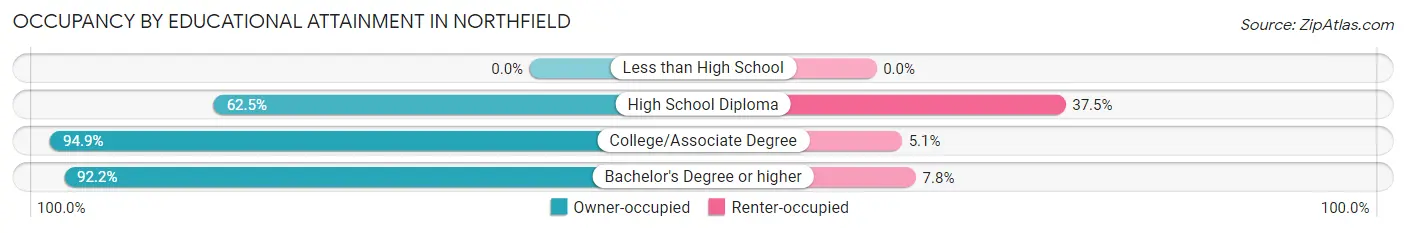
| Household Size | Owner-occupied | Renter-occupied |
| Less than High School | 0 (0.0%) | 0 (0.0%) |
| High School Diploma | 45 (62.5%) | 27 (37.5%) |
| College/Associate Degree | 431 (94.9%) | 23 (5.1%) |
| Bachelor's Degree or higher | 1,672 (92.2%) | 142 (7.8%) |
Occupancy by Age of Householder in Northfield
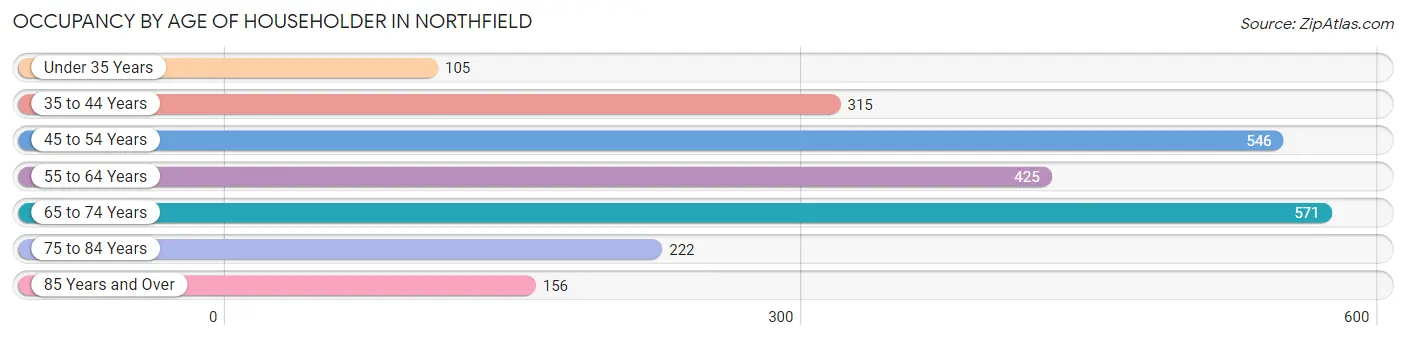
| Age Bracket | # Households | % Households |
| Under 35 Years | 105 | 4.5% |
| 35 to 44 Years | 315 | 13.5% |
| 45 to 54 Years | 546 | 23.3% |
| 55 to 64 Years | 425 | 18.2% |
| 65 to 74 Years | 571 | 24.4% |
| 75 to 84 Years | 222 | 9.5% |
| 85 Years and Over | 156 | 6.7% |
| Total | 2,340 | 100.0% |
Housing Finances in Northfield
Median Income by Occupancy in Northfield
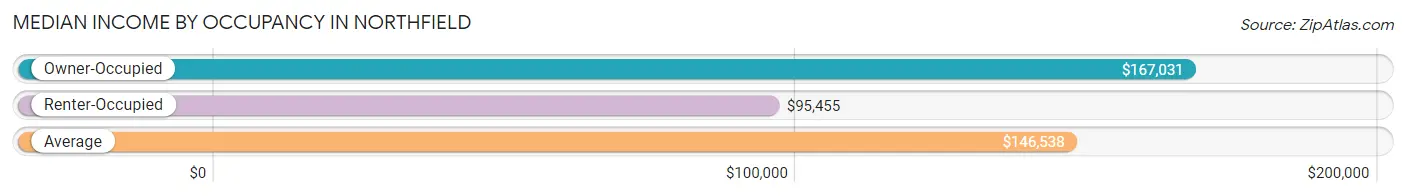
| Occupancy Type | # Households | Median Income |
| Owner-Occupied | 2,148 (91.8%) | $167,031 |
| Renter-Occupied | 192 (8.2%) | $95,455 |
| Average | 2,340 (100.0%) | $146,538 |
Occupancy by Householder Income Bracket in Northfield
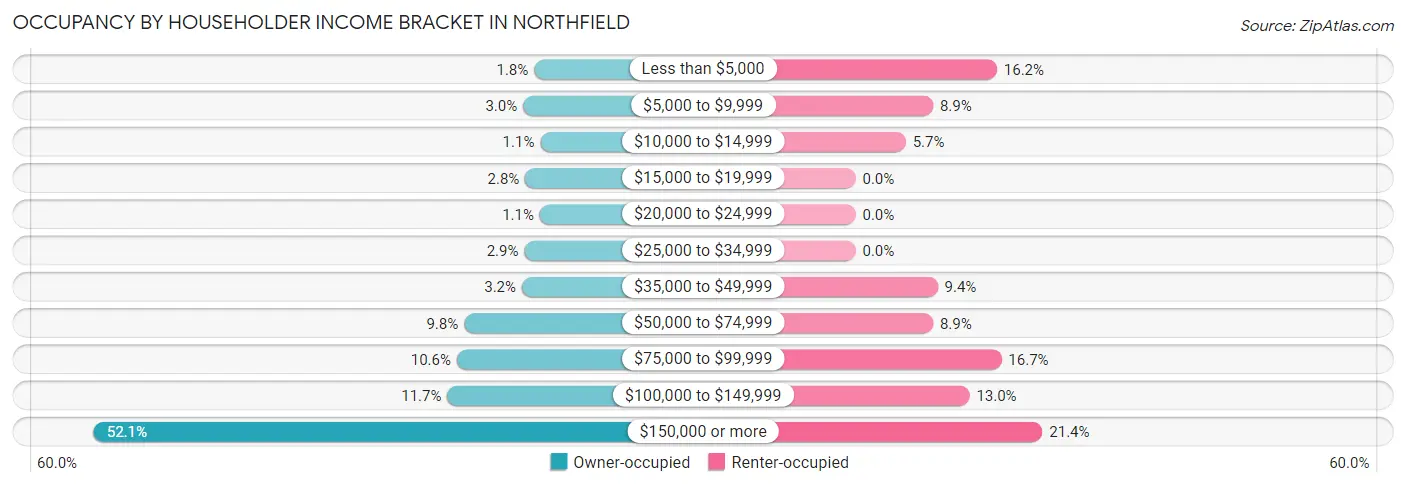
| Income Bracket | Owner-occupied | Renter-occupied |
| Less than $5,000 | 38 (1.8%) | 31 (16.2%) |
| $5,000 to $9,999 | 65 (3.0%) | 17 (8.8%) |
| $10,000 to $14,999 | 23 (1.1%) | 11 (5.7%) |
| $15,000 to $19,999 | 60 (2.8%) | 0 (0.0%) |
| $20,000 to $24,999 | 24 (1.1%) | 0 (0.0%) |
| $25,000 to $34,999 | 62 (2.9%) | 0 (0.0%) |
| $35,000 to $49,999 | 68 (3.2%) | 18 (9.4%) |
| $50,000 to $74,999 | 210 (9.8%) | 17 (8.8%) |
| $75,000 to $99,999 | 228 (10.6%) | 32 (16.7%) |
| $100,000 to $149,999 | 251 (11.7%) | 25 (13.0%) |
| $150,000 or more | 1,119 (52.1%) | 41 (21.3%) |
| Total | 2,148 (100.0%) | 192 (100.0%) |
Monthly Housing Cost Tiers in Northfield
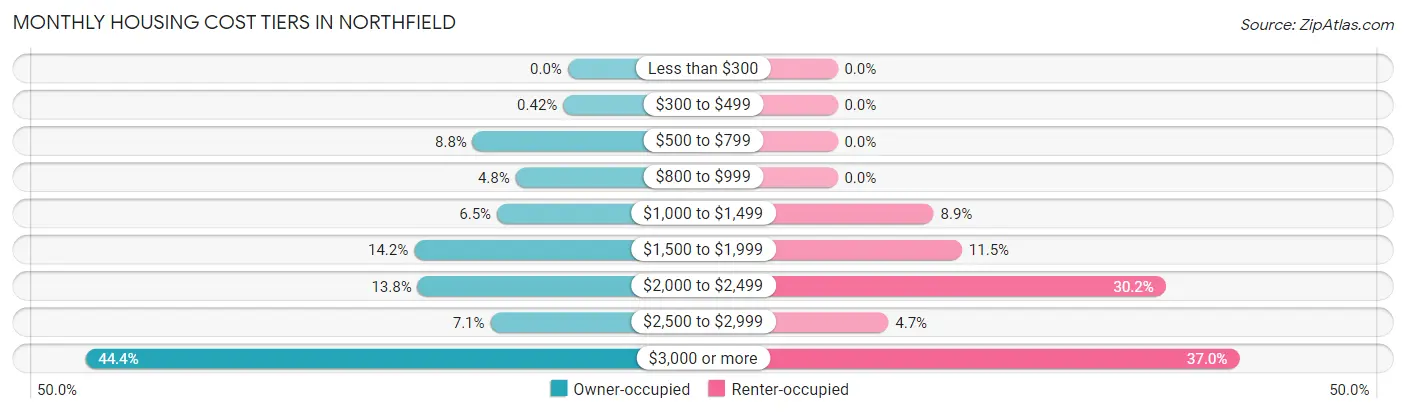
| Monthly Cost | Owner-occupied | Renter-occupied |
| Less than $300 | 0 (0.0%) | 0 (0.0%) |
| $300 to $499 | 9 (0.4%) | 0 (0.0%) |
| $500 to $799 | 188 (8.7%) | 0 (0.0%) |
| $800 to $999 | 103 (4.8%) | 0 (0.0%) |
| $1,000 to $1,499 | 140 (6.5%) | 17 (8.8%) |
| $1,500 to $1,999 | 304 (14.1%) | 22 (11.5%) |
| $2,000 to $2,499 | 297 (13.8%) | 58 (30.2%) |
| $2,500 to $2,999 | 153 (7.1%) | 9 (4.7%) |
| $3,000 or more | 954 (44.4%) | 71 (37.0%) |
| Total | 2,148 (100.0%) | 192 (100.0%) |
Physical Housing Characteristics in Northfield
Housing Structures in Northfield
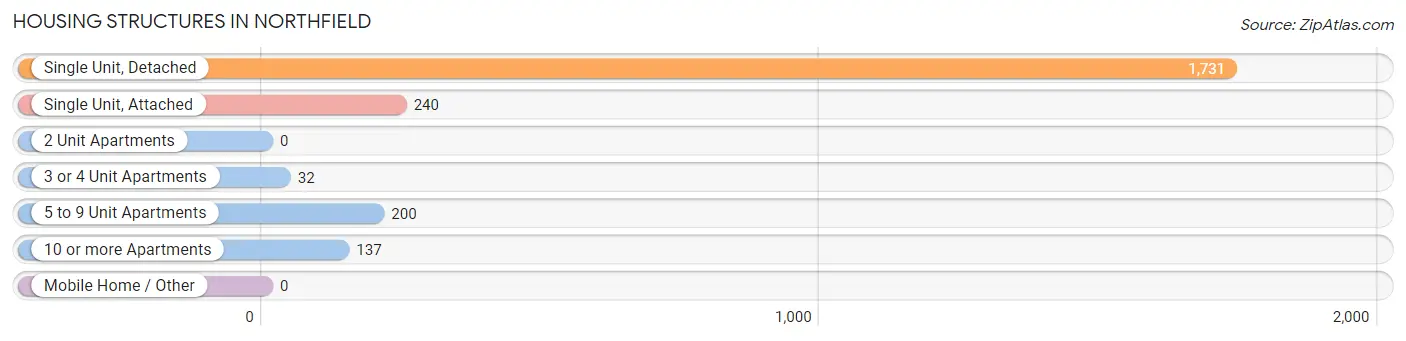
| Structure Type | # Housing Units | % Housing Units |
| Single Unit, Detached | 1,731 | 74.0% |
| Single Unit, Attached | 240 | 10.3% |
| 2 Unit Apartments | 0 | 0.0% |
| 3 or 4 Unit Apartments | 32 | 1.4% |
| 5 to 9 Unit Apartments | 200 | 8.6% |
| 10 or more Apartments | 137 | 5.9% |
| Mobile Home / Other | 0 | 0.0% |
| Total | 2,340 | 100.0% |
Housing Structures by Occupancy in Northfield
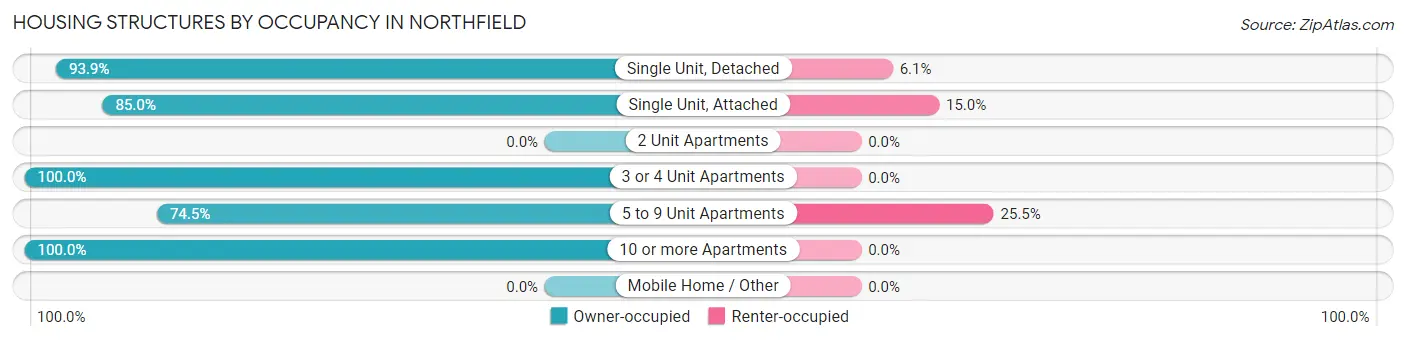
| Structure Type | Owner-occupied | Renter-occupied |
| Single Unit, Detached | 1,626 (93.9%) | 105 (6.1%) |
| Single Unit, Attached | 204 (85.0%) | 36 (15.0%) |
| 2 Unit Apartments | 0 (0.0%) | 0 (0.0%) |
| 3 or 4 Unit Apartments | 32 (100.0%) | 0 (0.0%) |
| 5 to 9 Unit Apartments | 149 (74.5%) | 51 (25.5%) |
| 10 or more Apartments | 137 (100.0%) | 0 (0.0%) |
| Mobile Home / Other | 0 (0.0%) | 0 (0.0%) |
| Total | 2,148 (91.8%) | 192 (8.2%) |
Housing Structures by Number of Rooms in Northfield
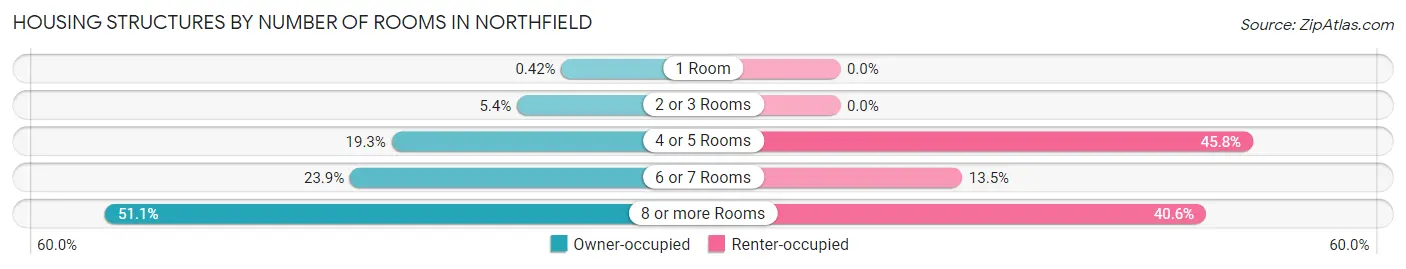
| Number of Rooms | Owner-occupied | Renter-occupied |
| 1 Room | 9 (0.4%) | 0 (0.0%) |
| 2 or 3 Rooms | 115 (5.3%) | 0 (0.0%) |
| 4 or 5 Rooms | 414 (19.3%) | 88 (45.8%) |
| 6 or 7 Rooms | 513 (23.9%) | 26 (13.5%) |
| 8 or more Rooms | 1,097 (51.1%) | 78 (40.6%) |
| Total | 2,148 (100.0%) | 192 (100.0%) |
Housing Structure by Heating Type in Northfield
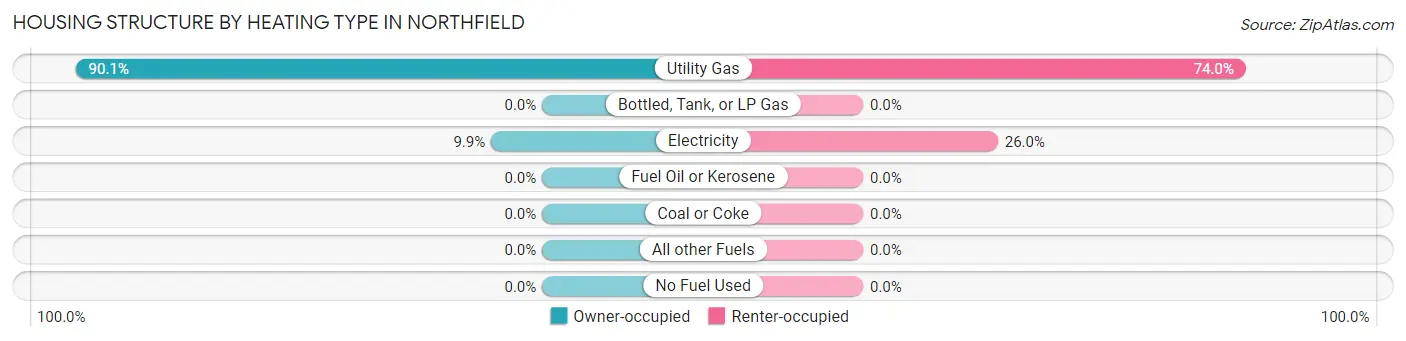
| Heating Type | Owner-occupied | Renter-occupied |
| Utility Gas | 1,936 (90.1%) | 142 (74.0%) |
| Bottled, Tank, or LP Gas | 0 (0.0%) | 0 (0.0%) |
| Electricity | 212 (9.9%) | 50 (26.0%) |
| Fuel Oil or Kerosene | 0 (0.0%) | 0 (0.0%) |
| Coal or Coke | 0 (0.0%) | 0 (0.0%) |
| All other Fuels | 0 (0.0%) | 0 (0.0%) |
| No Fuel Used | 0 (0.0%) | 0 (0.0%) |
| Total | 2,148 (100.0%) | 192 (100.0%) |
Household Vehicle Usage in Northfield
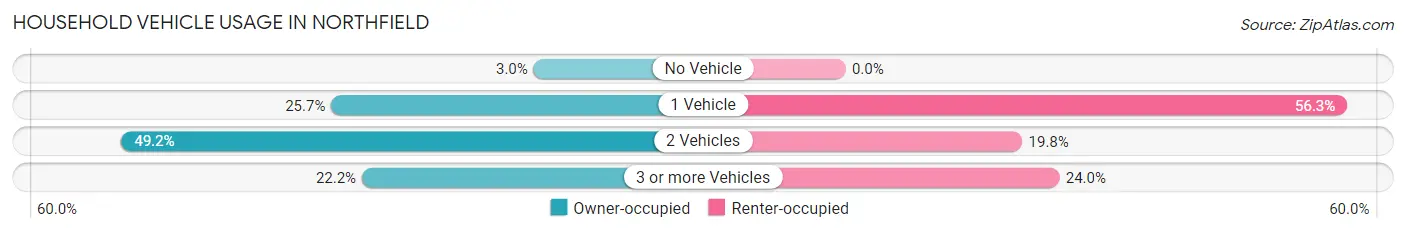
| Vehicles per Household | Owner-occupied | Renter-occupied |
| No Vehicle | 64 (3.0%) | 0 (0.0%) |
| 1 Vehicle | 551 (25.7%) | 108 (56.2%) |
| 2 Vehicles | 1,056 (49.2%) | 38 (19.8%) |
| 3 or more Vehicles | 477 (22.2%) | 46 (24.0%) |
| Total | 2,148 (100.0%) | 192 (100.0%) |
Real Estate & Mortgages in Northfield
Real Estate and Mortgage Overview in Northfield
| Characteristic | Without Mortgage | With Mortgage |
| Housing Units | 858 | 1,290 |
| Median Property Value | $653,700 | $765,000 |
| Median Household Income | $93,862 | $868 |
| Monthly Housing Costs | $1,501 | $878 |
| Real Estate Taxes | $10,001 | $0 |
Property Value by Mortgage Status in Northfield
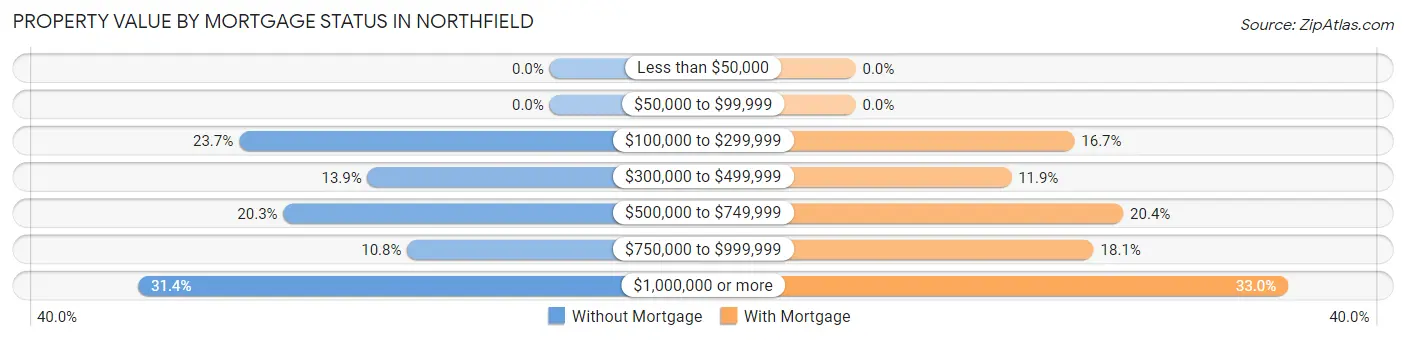
| Property Value | Without Mortgage | With Mortgage |
| Less than $50,000 | 0 (0.0%) | 0 (0.0%) |
| $50,000 to $99,999 | 0 (0.0%) | 0 (0.0%) |
| $100,000 to $299,999 | 203 (23.7%) | 215 (16.7%) |
| $300,000 to $499,999 | 119 (13.9%) | 153 (11.9%) |
| $500,000 to $749,999 | 174 (20.3%) | 263 (20.4%) |
| $750,000 to $999,999 | 93 (10.8%) | 234 (18.1%) |
| $1,000,000 or more | 269 (31.4%) | 425 (33.0%) |
| Total | 858 (100.0%) | 1,290 (100.0%) |
Household Income by Mortgage Status in Northfield
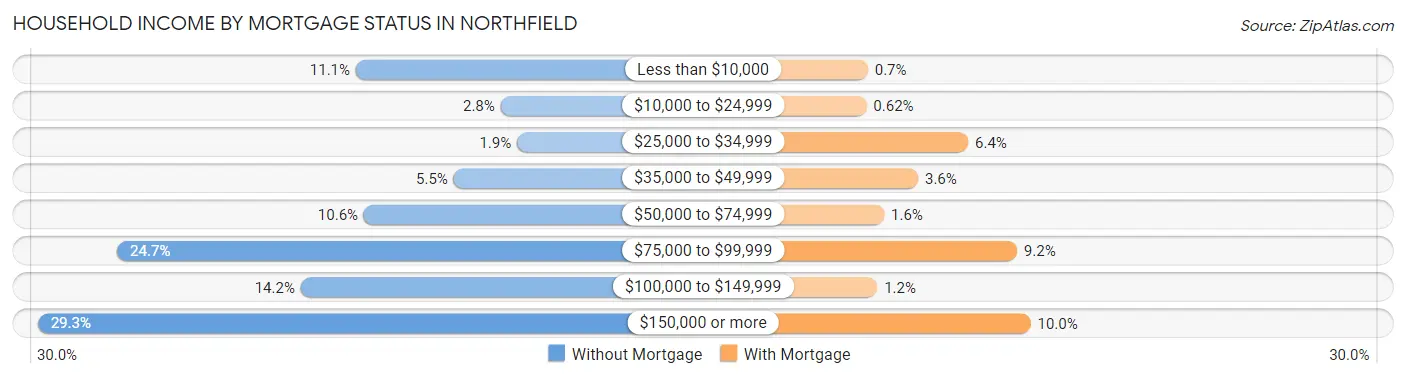
| Household Income | Without Mortgage | With Mortgage |
| Less than $10,000 | 95 (11.1%) | 9 (0.7%) |
| $10,000 to $24,999 | 24 (2.8%) | 8 (0.6%) |
| $25,000 to $34,999 | 16 (1.9%) | 83 (6.4%) |
| $35,000 to $49,999 | 47 (5.5%) | 46 (3.6%) |
| $50,000 to $74,999 | 91 (10.6%) | 21 (1.6%) |
| $75,000 to $99,999 | 212 (24.7%) | 119 (9.2%) |
| $100,000 to $149,999 | 122 (14.2%) | 16 (1.2%) |
| $150,000 or more | 251 (29.2%) | 129 (10.0%) |
| Total | 858 (100.0%) | 1,290 (100.0%) |
Property Value to Household Income Ratio in Northfield
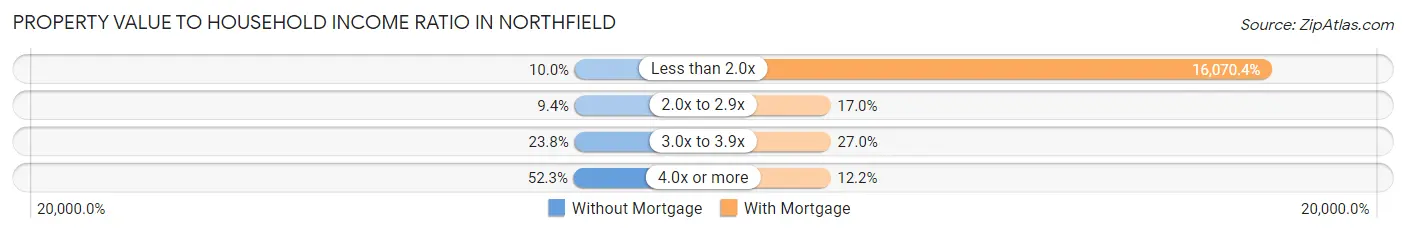
| Value-to-Income Ratio | Without Mortgage | With Mortgage |
| Less than 2.0x | 86 (10.0%) | 207,308 (16,070.4%) |
| 2.0x to 2.9x | 81 (9.4%) | 219 (17.0%) |
| 3.0x to 3.9x | 204 (23.8%) | 348 (27.0%) |
| 4.0x or more | 449 (52.3%) | 157 (12.2%) |
| Total | 858 (100.0%) | 1,290 (100.0%) |
Real Estate Taxes by Mortgage Status in Northfield
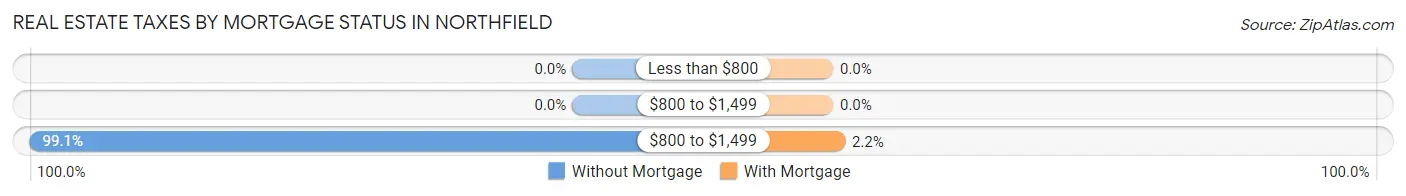
| Property Taxes | Without Mortgage | With Mortgage |
| Less than $800 | 0 (0.0%) | 0 (0.0%) |
| $800 to $1,499 | 0 (0.0%) | 0 (0.0%) |
| $800 to $1,499 | 850 (99.1%) | 28 (2.2%) |
| Total | 858 (100.0%) | 1,290 (100.0%) |
Health & Disability in Northfield
Health Insurance Coverage by Age in Northfield
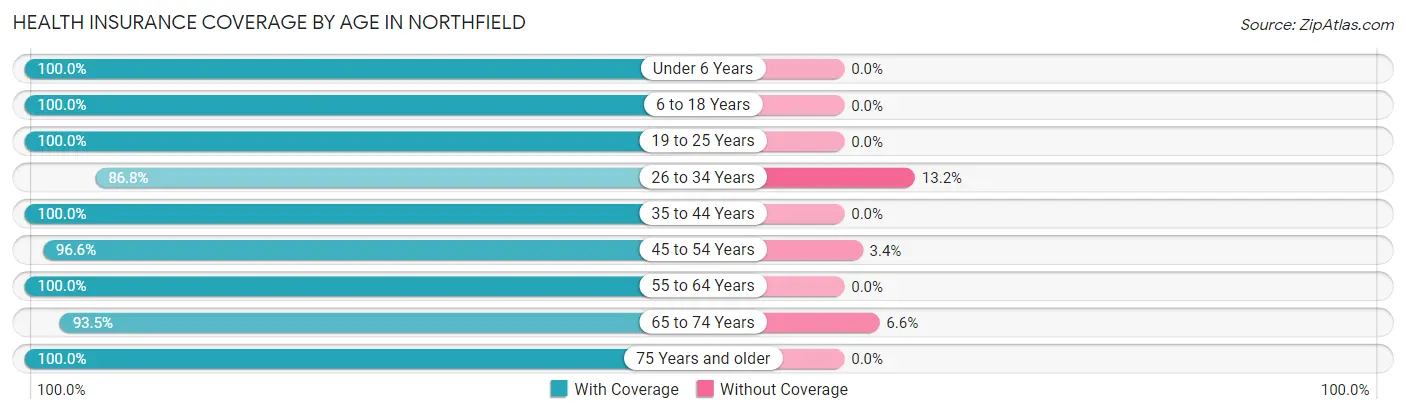
| Age Bracket | With Coverage | Without Coverage |
| Under 6 Years | 313 (100.0%) | 0 (0.0%) |
| 6 to 18 Years | 1,137 (100.0%) | 0 (0.0%) |
| 19 to 25 Years | 168 (100.0%) | 0 (0.0%) |
| 26 to 34 Years | 178 (86.8%) | 27 (13.2%) |
| 35 to 44 Years | 586 (100.0%) | 0 (0.0%) |
| 45 to 54 Years | 1,104 (96.6%) | 39 (3.4%) |
| 55 to 64 Years | 753 (100.0%) | 0 (0.0%) |
| 65 to 74 Years | 799 (93.4%) | 56 (6.6%) |
| 75 Years and older | 546 (100.0%) | 0 (0.0%) |
| Total | 5,584 (97.9%) | 122 (2.1%) |
Health Insurance Coverage by Citizenship Status in Northfield
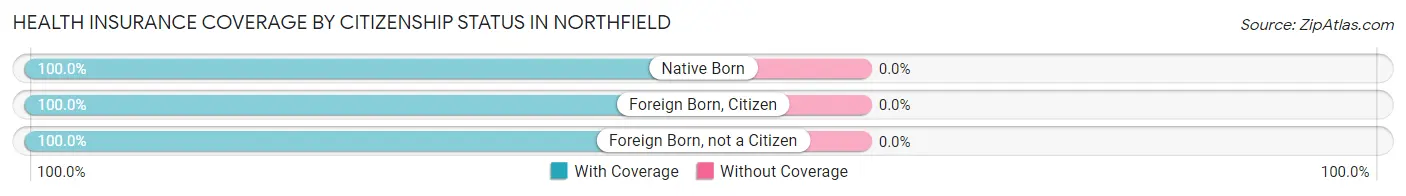
| Citizenship Status | With Coverage | Without Coverage |
| Native Born | 313 (100.0%) | 0 (0.0%) |
| Foreign Born, Citizen | 1,137 (100.0%) | 0 (0.0%) |
| Foreign Born, not a Citizen | 168 (100.0%) | 0 (0.0%) |
Health Insurance Coverage by Household Income in Northfield
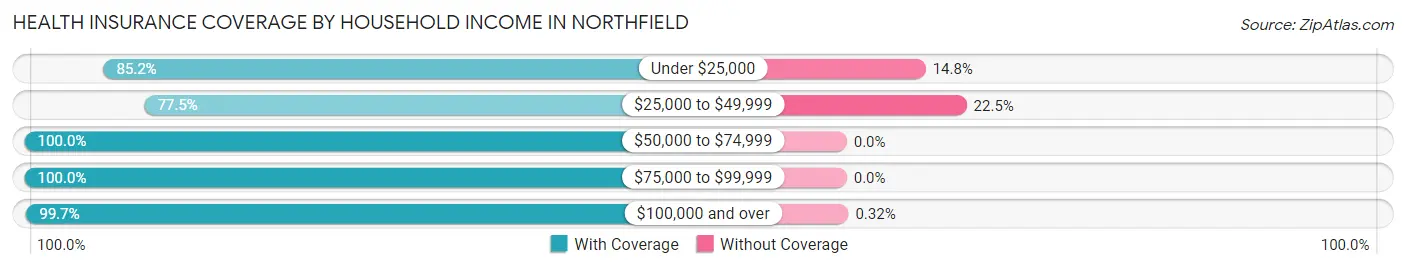
| Household Income | With Coverage | Without Coverage |
| Under $25,000 | 323 (85.2%) | 56 (14.8%) |
| $25,000 to $49,999 | 183 (77.5%) | 53 (22.5%) |
| $50,000 to $74,999 | 418 (100.0%) | 0 (0.0%) |
| $75,000 to $99,999 | 594 (100.0%) | 0 (0.0%) |
| $100,000 and over | 4,066 (99.7%) | 13 (0.3%) |
Public vs Private Health Insurance Coverage by Age in Northfield
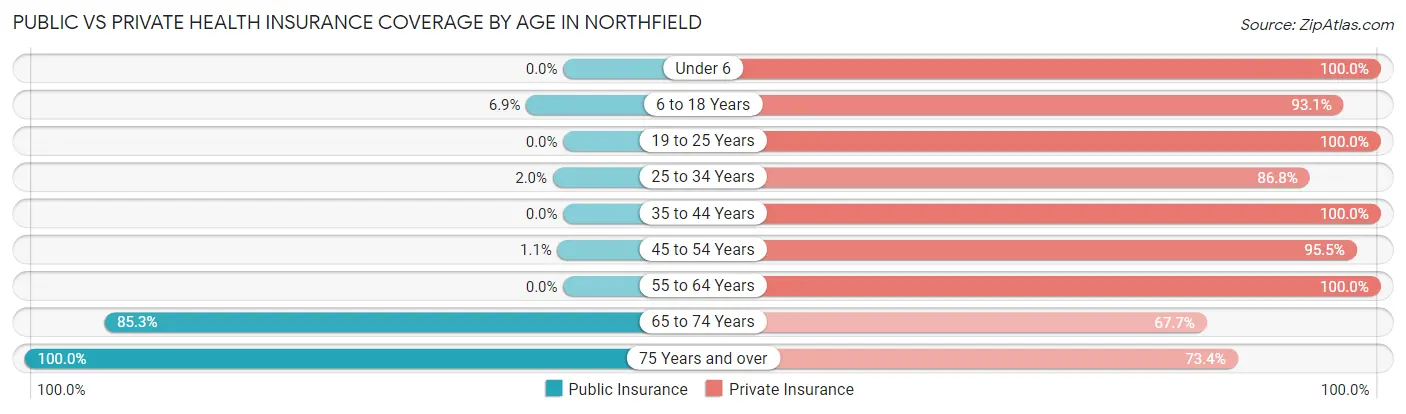
| Age Bracket | Public Insurance | Private Insurance |
| Under 6 | 0 (0.0%) | 313 (100.0%) |
| 6 to 18 Years | 78 (6.9%) | 1,059 (93.1%) |
| 19 to 25 Years | 0 (0.0%) | 168 (100.0%) |
| 25 to 34 Years | 4 (1.9%) | 178 (86.8%) |
| 35 to 44 Years | 0 (0.0%) | 586 (100.0%) |
| 45 to 54 Years | 12 (1.1%) | 1,092 (95.5%) |
| 55 to 64 Years | 0 (0.0%) | 753 (100.0%) |
| 65 to 74 Years | 729 (85.3%) | 579 (67.7%) |
| 75 Years and over | 546 (100.0%) | 401 (73.4%) |
| Total | 1,369 (24.0%) | 5,129 (89.9%) |
Disability Status by Sex by Age in Northfield
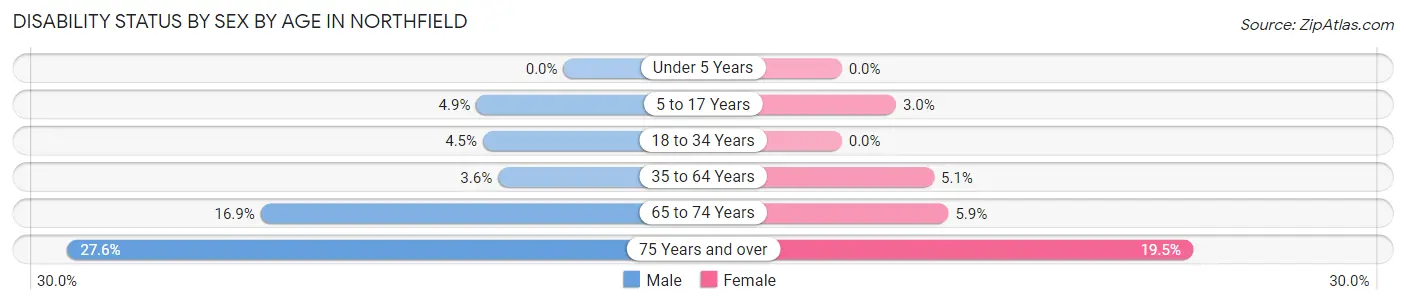
| Age Bracket | Male | Female |
| Under 5 Years | 0 (0.0%) | 0 (0.0%) |
| 5 to 17 Years | 21 (4.9%) | 21 (3.0%) |
| 18 to 34 Years | 12 (4.5%) | 0 (0.0%) |
| 35 to 64 Years | 45 (3.6%) | 64 (5.1%) |
| 65 to 74 Years | 59 (16.9%) | 30 (5.9%) |
| 75 Years and over | 66 (27.6%) | 60 (19.5%) |
Disability Class by Sex by Age in Northfield
Disability Class: Hearing Difficulty
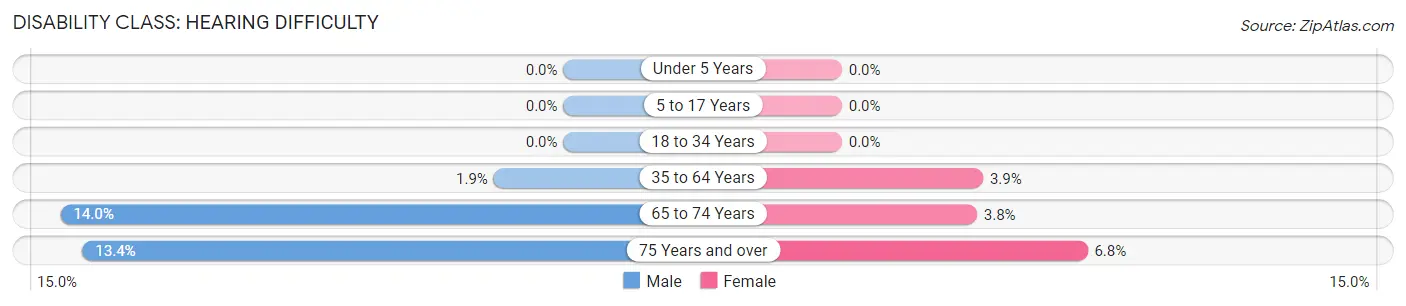
| Age Bracket | Male | Female |
| Under 5 Years | 0 (0.0%) | 0 (0.0%) |
| 5 to 17 Years | 0 (0.0%) | 0 (0.0%) |
| 18 to 34 Years | 0 (0.0%) | 0 (0.0%) |
| 35 to 64 Years | 24 (1.9%) | 49 (3.9%) |
| 65 to 74 Years | 49 (14.0%) | 19 (3.8%) |
| 75 Years and over | 32 (13.4%) | 21 (6.8%) |
Disability Class: Vision Difficulty
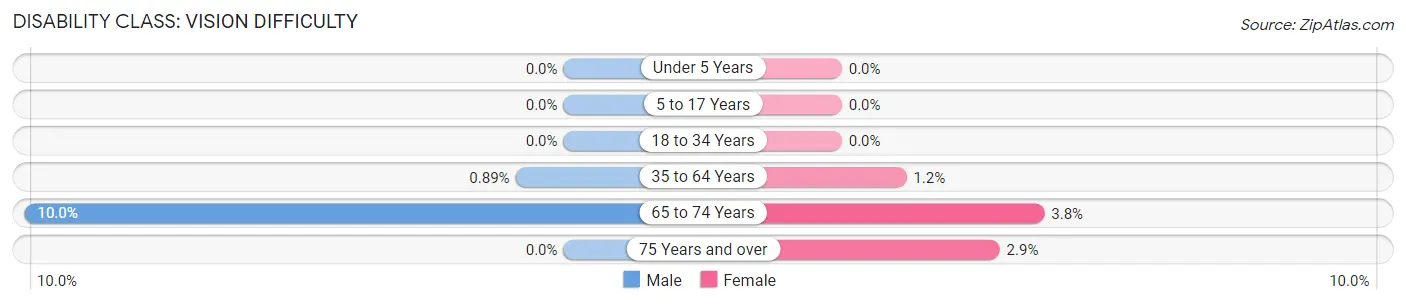
| Age Bracket | Male | Female |
| Under 5 Years | 0 (0.0%) | 0 (0.0%) |
| 5 to 17 Years | 0 (0.0%) | 0 (0.0%) |
| 18 to 34 Years | 0 (0.0%) | 0 (0.0%) |
| 35 to 64 Years | 11 (0.9%) | 15 (1.2%) |
| 65 to 74 Years | 35 (10.0%) | 19 (3.8%) |
| 75 Years and over | 0 (0.0%) | 9 (2.9%) |
Disability Class: Cognitive Difficulty
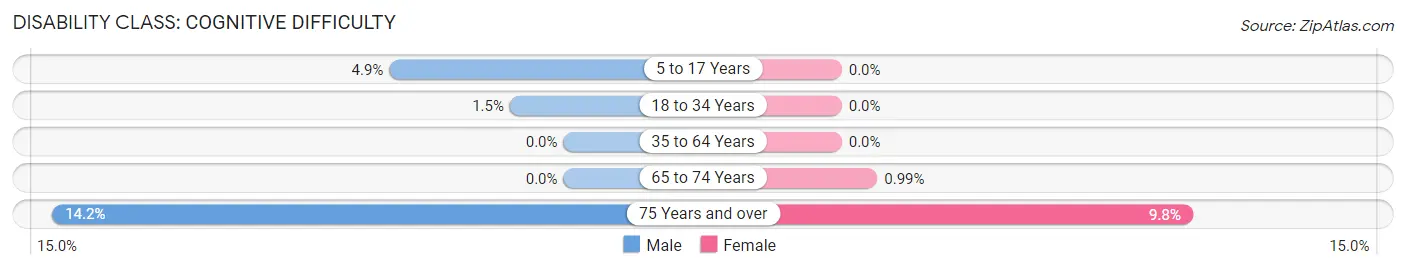
| Age Bracket | Male | Female |
| 5 to 17 Years | 21 (4.9%) | 0 (0.0%) |
| 18 to 34 Years | 4 (1.5%) | 0 (0.0%) |
| 35 to 64 Years | 0 (0.0%) | 0 (0.0%) |
| 65 to 74 Years | 0 (0.0%) | 5 (1.0%) |
| 75 Years and over | 34 (14.2%) | 30 (9.8%) |
Disability Class: Ambulatory Difficulty
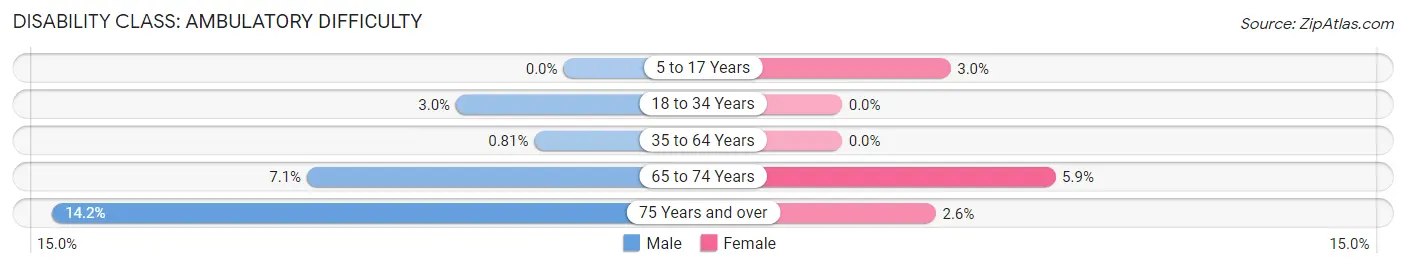
| Age Bracket | Male | Female |
| 5 to 17 Years | 0 (0.0%) | 21 (3.0%) |
| 18 to 34 Years | 8 (3.0%) | 0 (0.0%) |
| 35 to 64 Years | 10 (0.8%) | 0 (0.0%) |
| 65 to 74 Years | 25 (7.1%) | 30 (5.9%) |
| 75 Years and over | 34 (14.2%) | 8 (2.6%) |
Disability Class: Self-Care Difficulty
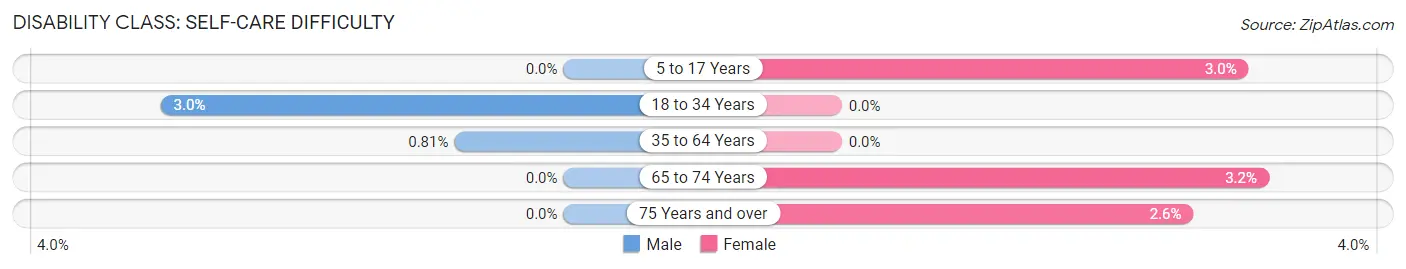
| Age Bracket | Male | Female |
| 5 to 17 Years | 0 (0.0%) | 21 (3.0%) |
| 18 to 34 Years | 8 (3.0%) | 0 (0.0%) |
| 35 to 64 Years | 10 (0.8%) | 0 (0.0%) |
| 65 to 74 Years | 0 (0.0%) | 16 (3.2%) |
| 75 Years and over | 0 (0.0%) | 8 (2.6%) |
Technology Access in Northfield
Computing Device Access in Northfield
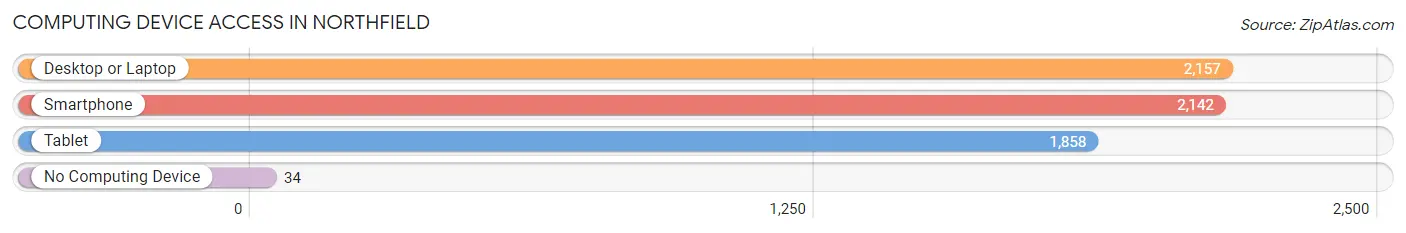
| Device Type | # Households | % Households |
| Desktop or Laptop | 2,157 | 92.2% |
| Smartphone | 2,142 | 91.5% |
| Tablet | 1,858 | 79.4% |
| No Computing Device | 34 | 1.5% |
| Total | 2,340 | 100.0% |
Internet Access in Northfield
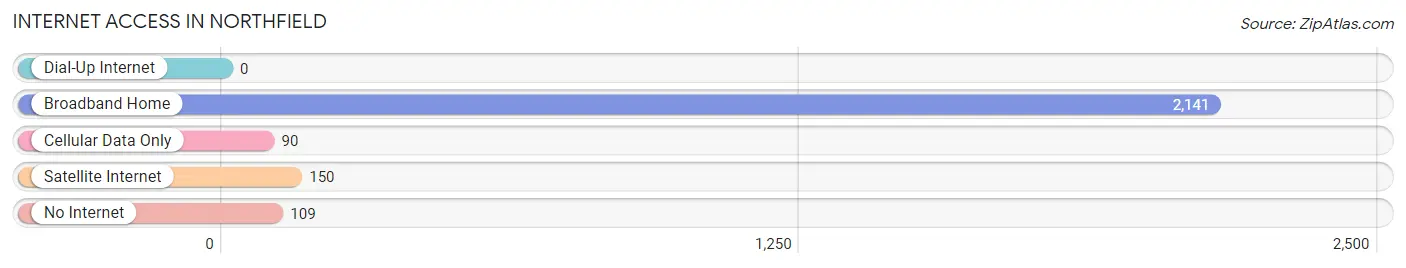
| Internet Type | # Households | % Households |
| Dial-Up Internet | 0 | 0.0% |
| Broadband Home | 2,141 | 91.5% |
| Cellular Data Only | 90 | 3.8% |
| Satellite Internet | 150 | 6.4% |
| No Internet | 109 | 4.7% |
| Total | 2,340 | 100.0% |
Northfield Summary
Northfield, Illinois is a small village located in Cook County, approximately 25 miles northwest of Chicago. The village is situated on the Des Plaines River and is bordered by the towns of Glenview, Northbrook, and Glencoe. Northfield is a part of the North Shore area, which is known for its affluent neighborhoods and high-end shopping.
History
Northfield was first settled in 1836 by a group of settlers from New England. The village was originally known as Northfield Center, and was incorporated in 1874. The village was named after Northfield, Massachusetts, the hometown of one of the original settlers.
In the late 19th century, Northfield was a popular summer resort destination for wealthy Chicagoans. The village was home to several large estates, including the former estate of Marshall Field, the founder of the department store chain.
Geography
Northfield is located in Cook County, approximately 25 miles northwest of Chicago. The village is situated on the Des Plaines River and is bordered by the towns of Glenview, Northbrook, and Glencoe. Northfield is a part of the North Shore area, which is known for its affluent neighborhoods and high-end shopping.
The village covers an area of 4.2 square miles and has a population of approximately 5,000 people. The village is primarily residential, with some commercial and industrial areas.
Economy
Northfield’s economy is largely based on the service industry. The village is home to several restaurants, retail stores, and professional services. The village is also home to several corporate headquarters, including the headquarters of the Kraft Foods Group.
The village is also home to several educational institutions, including New Trier High School, Northfield Township High School, and the University of Chicago.
Demographics
As of the 2010 census, Northfield had a population of 5,420 people. The racial makeup of the village was 87.3% White, 5.2% Asian, 4.2% African American, and 3.3% Hispanic or Latino.
The median household income in Northfield was $117,917, and the median family income was $133,917. The per capita income was $50,917.
Conclusion
Northfield, Illinois is a small village located in Cook County, approximately 25 miles northwest of Chicago. The village is situated on the Des Plaines River and is bordered by the towns of Glenview, Northbrook, and Glencoe. Northfield is a part of the North Shore area, which is known for its affluent neighborhoods and high-end shopping. The village has a population of approximately 5,000 people and is primarily residential, with some commercial and industrial areas. The village’s economy is largely based on the service industry, and the median household income is $117,917. Northfield is a diverse community, with a population that is 87.3% White, 5.2% Asian, 4.2% African American, and 3.3% Hispanic or Latino.
Common Questions
What is the Total Population of Northfield?
Total Population of Northfield is 5,707.
What is the Total Male Population of Northfield?
Total Male Population of Northfield is 2,622.
What is the Total Female Population of Northfield?
Total Female Population of Northfield is 3,085.
What is the Ratio of Males per 100 Females in Northfield?
There are 84.99 Males per 100 Females in Northfield.
What is the Ratio of Females per 100 Males in Northfield?
There are 117.66 Females per 100 Males in Northfield.
What is the Median Population Age in Northfield?
Median Population Age in Northfield is 49.9 Years.
What is the Average Family Size in Northfield
Average Family Size in Northfield is 2.9 People.
What is the Average Household Size in Northfield
Average Household Size in Northfield is 2.4 People.
What is Per Capita Income in Northfield?
Per Capita income in Northfield is $106,266.
What is the Median Family Income in Northfield?
Median Family Income in Northfield is $205,481.
What is the Median Household income in Northfield?
Median Household Income in Northfield is $146,538.
What is Income or Wage Gap in Northfield?
Income or Wage Gap in Northfield is 42.8%.
Women in Northfield earn 57.2 cents for every dollar earned by a man.
What is Inequality or Gini Index in Northfield?
Inequality or Gini Index in Northfield is 0.56.
How Large is the Labor Force in Northfield?
There are 2,684 People in the Labor Forcein in Northfield.
What is the Percentage of People in the Labor Force in Northfield?
59.1% of People are in the Labor Force in Northfield.
What is the Unemployment Rate in Northfield?
Unemployment Rate in Northfield is 1.5%.