Cities with the Highest Percentage of Immigrants from Eastern Asia in Oklahoma
RELATED REPORTS & OPTIONS
Eastern Asia
Oklahoma
Compare Cities
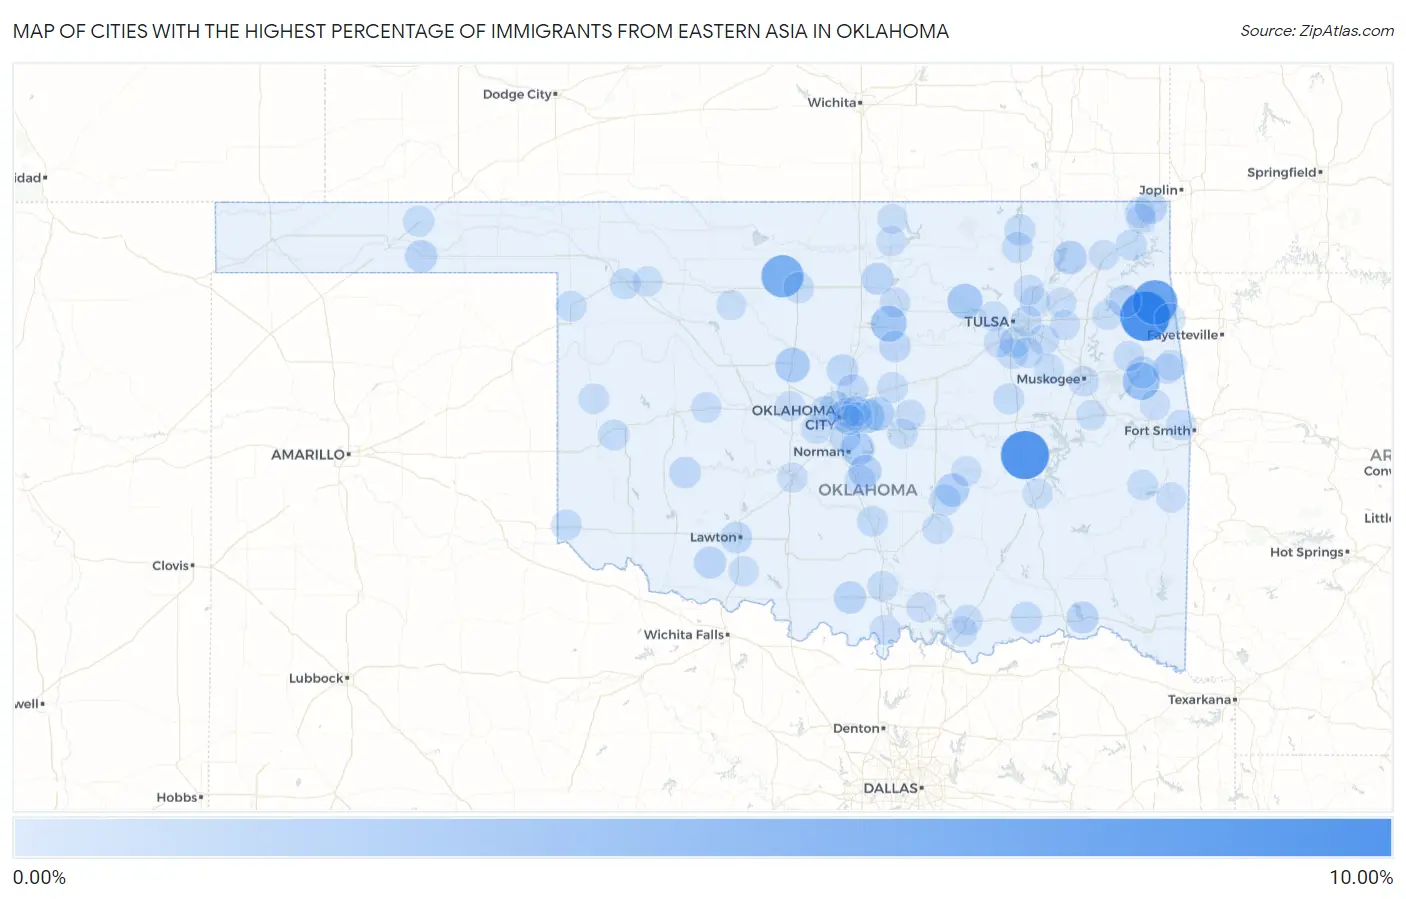
Map of Cities with the Highest Percentage of Immigrants from Eastern Asia in Oklahoma
0.00%
10.00%
Cities with the Highest Percentage of Immigrants from Eastern Asia in Oklahoma
| City | Eastern Asia | vs State | vs National | |
| 1. | Twin Oaks | 9.09% | 0.37%(+8.72)#1 | 1.28%(+7.82)#195 |
| 2. | Hanna | 8.43% | 0.37%(+8.06)#2 | 1.28%(+7.16)#229 |
| 3. | Cloud Creek | 6.80% | 0.37%(+6.42)#3 | 1.28%(+5.52)#307 |
| 4. | Carrier | 5.62% | 0.37%(+5.24)#4 | 1.28%(+4.34)#420 |
| 5. | Baron | 3.85% | 0.37%(+3.47)#5 | 1.28%(+2.57)#695 |
| 6. | Dry Creek | 3.26% | 0.37%(+2.88)#6 | 1.28%(+1.98)#885 |
| 7. | Stillwater | 2.64% | 0.37%(+2.26)#7 | 1.28%(+1.36)#1,117 |
| 8. | Osage | 2.30% | 0.37%(+1.93)#8 | 1.28%(+1.02)#1,290 |
| 9. | Kingfisher | 2.10% | 0.37%(+1.73)#9 | 1.28%(+0.827)#1,419 |
| 10. | Norman | 1.78% | 0.37%(+1.41)#10 | 1.28%(+0.505)#1,684 |
| 11. | Choctaw | 1.74% | 0.37%(+1.36)#11 | 1.28%(+0.460)#1,726 |
| 12. | Harrah | 1.68% | 0.37%(+1.30)#12 | 1.28%(+0.402)#1,801 |
| 13. | Sasakwa | 1.56% | 0.37%(+1.19)#14 | 1.28%(+0.287)#1,943 |
| 14. | New Alluwe | 1.56% | 0.37%(+1.19)#15 | 1.28%(+0.287)#1,944 |
| 15. | Keefton | 1.30% | 0.37%(+0.928)#16 | 1.28%(+0.026)#2,333 |
| 16. | Kenwood | 1.17% | 0.37%(+0.799)#17 | 1.28%(-0.103)#2,564 |
| 17. | Slaughterville | 1.17% | 0.37%(+0.797)#18 | 1.28%(-0.105)#2,574 |
| 18. | Hardesty | 1.07% | 0.37%(+0.699)#19 | 1.28%(-0.203)#2,770 |
| 19. | Wilson | 1.06% | 0.37%(+0.682)#20 | 1.28%(-0.220)#2,805 |
| 20. | Tenkiller | 0.96% | 0.37%(+0.585)#21 | 1.28%(-0.317)#3,082 |
| 21. | Sawyer | 0.95% | 0.37%(+0.576)#22 | 1.28%(-0.326)#3,117 |
| 22. | Quapaw | 0.94% | 0.37%(+0.566)#23 | 1.28%(-0.336)#3,145 |
| 23. | Chattanooga | 0.93% | 0.37%(+0.552)#24 | 1.28%(-0.350)#3,189 |
| 24. | Red Rock | 0.93% | 0.37%(+0.552)#25 | 1.28%(-0.350)#3,190 |
| 25. | Cedar Lake | 0.83% | 0.37%(+0.460)#26 | 1.28%(-0.442)#3,467 |
| 26. | Guthrie | 0.80% | 0.37%(+0.427)#27 | 1.28%(-0.475)#3,586 |
| 27. | Perkins | 0.78% | 0.37%(+0.403)#28 | 1.28%(-0.499)#3,666 |
| 28. | Lawton | 0.78% | 0.37%(+0.403)#29 | 1.28%(-0.499)#3,668 |
| 29. | Edmond | 0.72% | 0.37%(+0.350)#30 | 1.28%(-0.552)#3,887 |
| 30. | Gotebo | 0.72% | 0.37%(+0.346)#31 | 1.28%(-0.556)#3,901 |
| 31. | Boswell | 0.65% | 0.37%(+0.278)#32 | 1.28%(-0.624)#4,202 |
| 32. | Francis | 0.62% | 0.37%(+0.246)#33 | 1.28%(-0.656)#4,339 |
| 33. | Dewey | 0.59% | 0.37%(+0.218)#34 | 1.28%(-0.684)#4,474 |
| 34. | Nichols Hills | 0.54% | 0.37%(+0.171)#35 | 1.28%(-0.731)#4,745 |
| 35. | Glenpool | 0.53% | 0.37%(+0.153)#36 | 1.28%(-0.749)#4,861 |
| 36. | Afton | 0.51% | 0.37%(+0.140)#37 | 1.28%(-0.762)#4,940 |
| 37. | Hooker | 0.51% | 0.37%(+0.139)#38 | 1.28%(-0.763)#4,949 |
| 38. | Jenks | 0.49% | 0.37%(+0.117)#39 | 1.28%(-0.785)#5,087 |
| 39. | Oklahoma City | 0.49% | 0.37%(+0.113)#40 | 1.28%(-0.789)#5,115 |
| 40. | Moore | 0.49% | 0.37%(+0.113)#41 | 1.28%(-0.789)#5,121 |
| 41. | Woodward | 0.46% | 0.37%(+0.082)#42 | 1.28%(-0.820)#5,293 |
| 42. | Elk City | 0.45% | 0.37%(+0.079)#43 | 1.28%(-0.823)#5,320 |
| 43. | Tulsa | 0.45% | 0.37%(+0.078)#44 | 1.28%(-0.824)#5,327 |
| 44. | Enid | 0.45% | 0.37%(+0.078)#45 | 1.28%(-0.824)#5,331 |
| 45. | Okmulgee | 0.45% | 0.37%(+0.075)#46 | 1.28%(-0.827)#5,351 |
| 46. | West Siloam Springs | 0.44% | 0.37%(+0.065)#47 | 1.28%(-0.837)#5,425 |
| 47. | Bartlesville | 0.44% | 0.37%(+0.063)#48 | 1.28%(-0.839)#5,442 |
| 48. | Pauls Valley | 0.40% | 0.37%(+0.024)#49 | 1.28%(-0.878)#5,749 |
| 49. | Shattuck | 0.40% | 0.37%(+0.023)#50 | 1.28%(-0.879)#5,761 |
| 50. | Hollis | 0.39% | 0.37%(+0.013)#51 | 1.28%(-0.889)#5,836 |
| 51. | Wellston | 0.38% | 0.37%(+0.004)#52 | 1.28%(-0.898)#5,898 |
| 52. | Ardmore | 0.38% | 0.37%(+0.002)#53 | 1.28%(-0.900)#5,915 |
| 53. | Fairfield | 0.37% | 0.37%(+0.000)#54 | 1.28%(-0.902)#5,924 |
| 54. | Bixby | 0.37% | 0.37%(-0.005)#55 | 1.28%(-0.907)#5,962 |
| 55. | Cheyenne | 0.37% | 0.37%(-0.006)#56 | 1.28%(-0.908)#5,972 |
| 56. | North Miami | 0.34% | 0.37%(-0.029)#57 | 1.28%(-0.931)#6,135 |
| 57. | Forest Park | 0.34% | 0.37%(-0.033)#58 | 1.28%(-0.935)#6,166 |
| 58. | Ada | 0.33% | 0.37%(-0.041)#59 | 1.28%(-0.943)#6,234 |
| 59. | Tahlequah | 0.33% | 0.37%(-0.044)#60 | 1.28%(-0.946)#6,261 |
| 60. | Weatherford | 0.32% | 0.37%(-0.057)#61 | 1.28%(-0.959)#6,377 |
| 61. | Meeker | 0.31% | 0.37%(-0.064)#62 | 1.28%(-0.966)#6,440 |
| 62. | Bethany | 0.31% | 0.37%(-0.068)#63 | 1.28%(-0.970)#6,475 |
| 63. | Durant | 0.30% | 0.37%(-0.070)#64 | 1.28%(-0.972)#6,483 |
| 64. | Spencer | 0.30% | 0.37%(-0.071)#65 | 1.28%(-0.973)#6,497 |
| 65. | Broken Arrow | 0.30% | 0.37%(-0.073)#66 | 1.28%(-0.975)#6,515 |
| 66. | Lexington | 0.29% | 0.37%(-0.079)#67 | 1.28%(-0.981)#6,568 |
| 67. | Roland | 0.29% | 0.37%(-0.080)#68 | 1.28%(-0.982)#6,581 |
| 68. | Morrison | 0.29% | 0.37%(-0.088)#69 | 1.28%(-0.990)#6,636 |
| 69. | Muskogee | 0.28% | 0.37%(-0.092)#70 | 1.28%(-0.994)#6,670 |
| 70. | Fanshawe | 0.28% | 0.37%(-0.093)#71 | 1.28%(-0.995)#6,680 |
| 71. | Midwest City | 0.28% | 0.37%(-0.098)#72 | 1.28%(-1.00)#6,727 |
| 72. | Del City | 0.26% | 0.37%(-0.115)#73 | 1.28%(-1.02)#6,873 |
| 73. | Owasso | 0.22% | 0.37%(-0.156)#74 | 1.28%(-1.06)#7,251 |
| 74. | Shawnee | 0.22% | 0.37%(-0.157)#75 | 1.28%(-1.06)#7,263 |
| 75. | Brushy | 0.21% | 0.37%(-0.168)#76 | 1.28%(-1.07)#7,365 |
| 76. | Collinsville | 0.20% | 0.37%(-0.175)#77 | 1.28%(-1.08)#7,432 |
| 77. | Sapulpa | 0.20% | 0.37%(-0.178)#78 | 1.28%(-1.08)#7,463 |
| 78. | Mooreland | 0.19% | 0.37%(-0.179)#79 | 1.28%(-1.08)#7,471 |
| 79. | Warner | 0.19% | 0.37%(-0.183)#80 | 1.28%(-1.09)#7,509 |
| 80. | Stilwell | 0.19% | 0.37%(-0.186)#81 | 1.28%(-1.09)#7,541 |
| 81. | Holdenville | 0.19% | 0.37%(-0.187)#82 | 1.28%(-1.09)#7,550 |
| 82. | Justice | 0.18% | 0.37%(-0.190)#83 | 1.28%(-1.09)#7,580 |
| 83. | El Reno | 0.18% | 0.37%(-0.191)#84 | 1.28%(-1.09)#7,595 |
| 84. | Walters | 0.18% | 0.37%(-0.198)#85 | 1.28%(-1.10)#7,675 |
| 85. | Calera | 0.17% | 0.37%(-0.201)#86 | 1.28%(-1.10)#7,704 |
| 86. | Oakland | 0.17% | 0.37%(-0.202)#87 | 1.28%(-1.10)#7,709 |
| 87. | Haskell | 0.16% | 0.37%(-0.209)#88 | 1.28%(-1.11)#7,785 |
| 88. | Miami | 0.16% | 0.37%(-0.212)#89 | 1.28%(-1.11)#7,808 |
| 89. | Inola | 0.16% | 0.37%(-0.214)#90 | 1.28%(-1.12)#7,826 |
| 90. | Chickasha | 0.15% | 0.37%(-0.220)#91 | 1.28%(-1.12)#7,878 |
| 91. | Marietta | 0.14% | 0.37%(-0.232)#92 | 1.28%(-1.13)#8,007 |
| 92. | Locust Grove | 0.14% | 0.37%(-0.233)#93 | 1.28%(-1.14)#8,021 |
| 93. | Mcalester | 0.14% | 0.37%(-0.236)#94 | 1.28%(-1.14)#8,044 |
| 94. | Vinita | 0.13% | 0.37%(-0.239)#95 | 1.28%(-1.14)#8,072 |
| 95. | Heavener | 0.13% | 0.37%(-0.241)#96 | 1.28%(-1.14)#8,085 |
| 96. | Ponca City | 0.13% | 0.37%(-0.247)#97 | 1.28%(-1.15)#8,138 |
| 97. | Fairview | 0.11% | 0.37%(-0.263)#98 | 1.28%(-1.16)#8,289 |
| 98. | Sand Springs | 0.11% | 0.37%(-0.263)#99 | 1.28%(-1.17)#8,293 |
| 99. | Mustang | 0.11% | 0.37%(-0.266)#100 | 1.28%(-1.17)#8,317 |
| 100. | Newkirk | 0.11% | 0.37%(-0.268)#101 | 1.28%(-1.17)#8,332 |
Common Questions
What are the Top 10 Cities with the Highest Percentage of Immigrants from Eastern Asia in Oklahoma?
Top 10 Cities with the Highest Percentage of Immigrants from Eastern Asia in Oklahoma are:
#1
9.09%
#2
8.43%
#3
6.80%
#4
5.62%
#5
3.26%
#6
2.64%
#7
2.30%
#8
2.10%
#9
1.78%
#10
1.74%
What city has the Highest Percentage of Immigrants from Eastern Asia in Oklahoma?
Twin Oaks has the Highest Percentage of Immigrants from Eastern Asia in Oklahoma with 9.09%.
What is the Percentage of Immigrants from Eastern Asia in the State of Oklahoma?
Percentage of Immigrants from Eastern Asia in Oklahoma is 0.37%.
What is the Percentage of Immigrants from Eastern Asia in the United States?
Percentage of Immigrants from Eastern Asia in the United States is 1.28%.