Cities with the Highest Percentage of Immigrants from Eastern Asia in Oregon
RELATED REPORTS & OPTIONS
Eastern Asia
Oregon
Compare Cities
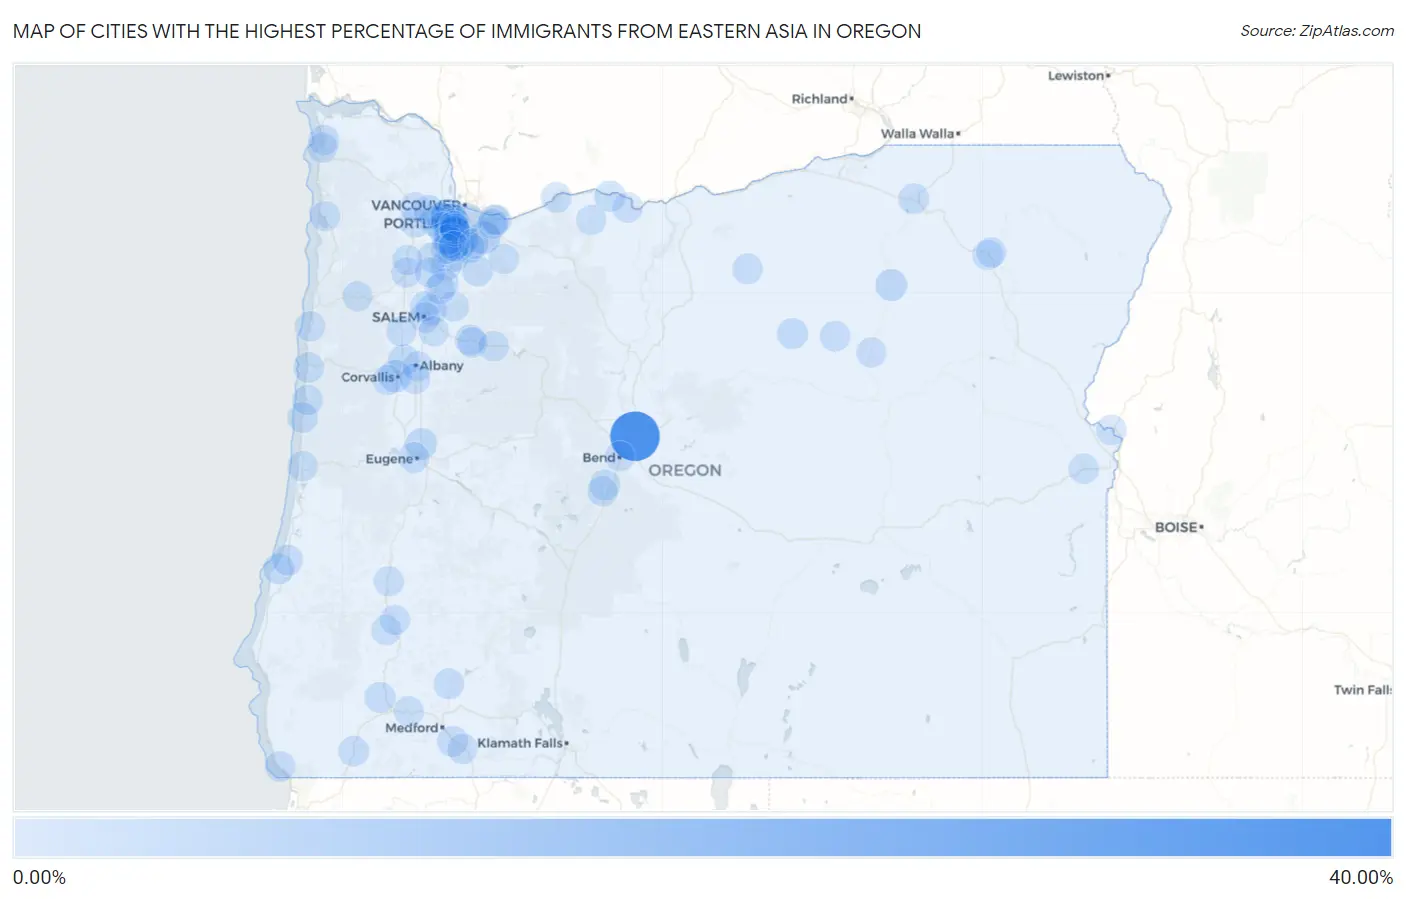
Map of Cities with the Highest Percentage of Immigrants from Eastern Asia in Oregon
0.00%
40.00%
Cities with the Highest Percentage of Immigrants from Eastern Asia in Oregon
| City | Eastern Asia | vs State | vs National | |
| 1. | Pronghorn | 37.70% | 1.07%(+36.6)#1 | 1.28%(+36.4)#11 |
| 2. | Bethany | 8.46% | 1.07%(+7.40)#2 | 1.28%(+7.19)#225 |
| 3. | Rivergrove | 6.63% | 1.07%(+5.56)#3 | 1.28%(+5.36)#317 |
| 4. | Happy Valley | 5.78% | 1.07%(+4.72)#4 | 1.28%(+4.51)#396 |
| 5. | Cedar Mill | 5.49% | 1.07%(+4.43)#5 | 1.28%(+4.22)#431 |
| 6. | Corvallis | 4.10% | 1.07%(+3.03)#6 | 1.28%(+2.83)#648 |
| 7. | Lake Oswego | 3.63% | 1.07%(+2.56)#7 | 1.28%(+2.35)#762 |
| 8. | Ukiah | 3.40% | 1.07%(+2.33)#8 | 1.28%(+2.12)#840 |
| 9. | Marlene | 3.37% | 1.07%(+2.30)#9 | 1.28%(+2.09)#846 |
| 10. | West Linn | 2.92% | 1.07%(+1.86)#10 | 1.28%(+1.65)#988 |
| 11. | Coburg | 2.66% | 1.07%(+1.60)#11 | 1.28%(+1.39)#1,101 |
| 12. | Oak Hills | 2.61% | 1.07%(+1.54)#12 | 1.28%(+1.33)#1,131 |
| 13. | Cedar Hills | 2.39% | 1.07%(+1.32)#13 | 1.28%(+1.12)#1,228 |
| 14. | Beaverton | 2.38% | 1.07%(+1.31)#14 | 1.28%(+1.10)#1,238 |
| 15. | Falcon Heights | 2.32% | 1.07%(+1.26)#15 | 1.28%(+1.05)#1,272 |
| 16. | Adair Village | 2.11% | 1.07%(+1.04)#16 | 1.28%(+0.834)#1,414 |
| 17. | Butteville | 2.11% | 1.07%(+1.04)#17 | 1.28%(+0.830)#1,417 |
| 18. | Spray | 2.01% | 1.07%(+0.943)#18 | 1.28%(+0.734)#1,483 |
| 19. | West Haven Sylvan | 1.97% | 1.07%(+0.903)#19 | 1.28%(+0.694)#1,520 |
| 20. | Durham | 1.94% | 1.07%(+0.869)#20 | 1.28%(+0.660)#1,549 |
| 21. | Mosier | 1.90% | 1.07%(+0.838)#21 | 1.28%(+0.629)#1,576 |
| 22. | Barview | 1.85% | 1.07%(+0.787)#22 | 1.28%(+0.578)#1,614 |
| 23. | Portland | 1.85% | 1.07%(+0.783)#23 | 1.28%(+0.574)#1,619 |
| 24. | Hillsboro | 1.81% | 1.07%(+0.747)#24 | 1.28%(+0.538)#1,659 |
| 25. | Wilsonville | 1.81% | 1.07%(+0.741)#25 | 1.28%(+0.533)#1,665 |
| 26. | Tigard | 1.79% | 1.07%(+0.726)#26 | 1.28%(+0.517)#1,677 |
| 27. | Sunriver | 1.78% | 1.07%(+0.714)#27 | 1.28%(+0.505)#1,683 |
| 28. | King City | 1.72% | 1.07%(+0.651)#28 | 1.28%(+0.443)#1,747 |
| 29. | Hayesville | 1.65% | 1.07%(+0.578)#29 | 1.28%(+0.369)#1,845 |
| 30. | Rockcreek | 1.64% | 1.07%(+0.576)#30 | 1.28%(+0.367)#1,851 |
| 31. | North Bend | 1.61% | 1.07%(+0.543)#31 | 1.28%(+0.334)#1,890 |
| 32. | Eugene | 1.59% | 1.07%(+0.522)#32 | 1.28%(+0.314)#1,915 |
| 33. | Aloha | 1.58% | 1.07%(+0.517)#33 | 1.28%(+0.308)#1,921 |
| 34. | Gopher Flats | 1.56% | 1.07%(+0.496)#34 | 1.28%(+0.287)#1,942 |
| 35. | Merlin | 1.54% | 1.07%(+0.477)#35 | 1.28%(+0.268)#1,960 |
| 36. | Talent | 1.50% | 1.07%(+0.436)#36 | 1.28%(+0.227)#2,005 |
| 37. | Mehama | 1.50% | 1.07%(+0.431)#37 | 1.28%(+0.222)#2,011 |
| 38. | Bull Mountain | 1.35% | 1.07%(+0.285)#38 | 1.28%(+0.076)#2,240 |
| 39. | Monument | 1.30% | 1.07%(+0.232)#39 | 1.28%(+0.023)#2,342 |
| 40. | Yachats | 1.30% | 1.07%(+0.228)#40 | 1.28%(+0.020)#2,345 |
| 41. | Brookings | 1.29% | 1.07%(+0.228)#41 | 1.28%(+0.019)#2,348 |
| 42. | Garden Home Whitford | 1.28% | 1.07%(+0.217)#42 | 1.28%(+0.009)#2,366 |
| 43. | Cave Junction | 1.20% | 1.07%(+0.137)#43 | 1.28%(-0.071)#2,507 |
| 44. | Newport | 1.19% | 1.07%(+0.125)#44 | 1.28%(-0.084)#2,530 |
| 45. | Dunthorpe | 1.19% | 1.07%(+0.122)#45 | 1.28%(-0.087)#2,535 |
| 46. | Shady Cove | 1.17% | 1.07%(+0.100)#46 | 1.28%(-0.108)#2,578 |
| 47. | Gearhart | 1.17% | 1.07%(+0.098)#47 | 1.28%(-0.111)#2,584 |
| 48. | Condon | 1.15% | 1.07%(+0.081)#48 | 1.28%(-0.128)#2,624 |
| 49. | Cascade Locks | 1.06% | 1.07%(-0.009)#49 | 1.28%(-0.218)#2,799 |
| 50. | West Slope | 1.05% | 1.07%(-0.016)#50 | 1.28%(-0.225)#2,815 |
| 51. | Newberg | 1.05% | 1.07%(-0.019)#51 | 1.28%(-0.228)#2,824 |
| 52. | Wood Village | 1.01% | 1.07%(-0.055)#52 | 1.28%(-0.264)#2,923 |
| 53. | Sherwood | 0.98% | 1.07%(-0.091)#53 | 1.28%(-0.300)#3,031 |
| 54. | Waldport | 0.97% | 1.07%(-0.093)#54 | 1.28%(-0.301)#3,033 |
| 55. | Mulino | 0.95% | 1.07%(-0.114)#55 | 1.28%(-0.322)#3,102 |
| 56. | Ashland | 0.93% | 1.07%(-0.132)#56 | 1.28%(-0.341)#3,164 |
| 57. | Gates | 0.89% | 1.07%(-0.180)#57 | 1.28%(-0.389)#3,288 |
| 58. | Estacada | 0.87% | 1.07%(-0.201)#58 | 1.28%(-0.410)#3,355 |
| 59. | Salem | 0.84% | 1.07%(-0.222)#59 | 1.28%(-0.431)#3,426 |
| 60. | Silverton | 0.81% | 1.07%(-0.253)#60 | 1.28%(-0.461)#3,525 |
| 61. | Raleigh Hills | 0.79% | 1.07%(-0.280)#61 | 1.28%(-0.489)#3,631 |
| 62. | Juniper Canyon | 0.77% | 1.07%(-0.295)#62 | 1.28%(-0.503)#3,689 |
| 63. | La Grande | 0.77% | 1.07%(-0.296)#63 | 1.28%(-0.505)#3,697 |
| 64. | Mcminnville | 0.76% | 1.07%(-0.303)#64 | 1.28%(-0.512)#3,728 |
| 65. | Monmouth | 0.74% | 1.07%(-0.325)#65 | 1.28%(-0.534)#3,819 |
| 66. | Woodburn | 0.74% | 1.07%(-0.327)#66 | 1.28%(-0.536)#3,828 |
| 67. | Tualatin | 0.73% | 1.07%(-0.333)#67 | 1.28%(-0.542)#3,853 |
| 68. | Three Rivers | 0.72% | 1.07%(-0.349)#68 | 1.28%(-0.558)#3,909 |
| 69. | Forest Grove | 0.69% | 1.07%(-0.375)#69 | 1.28%(-0.584)#4,012 |
| 70. | Gervais | 0.69% | 1.07%(-0.376)#70 | 1.28%(-0.585)#4,019 |
| 71. | Florence | 0.68% | 1.07%(-0.385)#71 | 1.28%(-0.594)#4,059 |
| 72. | Lyons | 0.68% | 1.07%(-0.386)#72 | 1.28%(-0.595)#4,060 |
| 73. | Seaside | 0.67% | 1.07%(-0.395)#73 | 1.28%(-0.604)#4,104 |
| 74. | Gladstone | 0.67% | 1.07%(-0.400)#74 | 1.28%(-0.609)#4,130 |
| 75. | Albany | 0.66% | 1.07%(-0.403)#75 | 1.28%(-0.612)#4,142 |
| 76. | Lincoln Beach | 0.65% | 1.07%(-0.419)#76 | 1.28%(-0.628)#4,216 |
| 77. | Vale | 0.64% | 1.07%(-0.429)#77 | 1.28%(-0.637)#4,256 |
| 78. | Banks | 0.64% | 1.07%(-0.432)#78 | 1.28%(-0.641)#4,267 |
| 79. | Philomath | 0.63% | 1.07%(-0.441)#79 | 1.28%(-0.649)#4,313 |
| 80. | Roseburg North | 0.63% | 1.07%(-0.442)#80 | 1.28%(-0.650)#4,316 |
| 81. | North Plains | 0.62% | 1.07%(-0.443)#81 | 1.28%(-0.652)#4,322 |
| 82. | Heceta Beach | 0.61% | 1.07%(-0.454)#82 | 1.28%(-0.663)#4,365 |
| 83. | Riddle | 0.61% | 1.07%(-0.462)#83 | 1.28%(-0.671)#4,402 |
| 84. | Rogue River | 0.60% | 1.07%(-0.466)#84 | 1.28%(-0.675)#4,425 |
| 85. | Troutdale | 0.60% | 1.07%(-0.466)#85 | 1.28%(-0.675)#4,426 |
| 86. | Annex | 0.60% | 1.07%(-0.466)#86 | 1.28%(-0.675)#4,429 |
| 87. | Gresham | 0.58% | 1.07%(-0.484)#87 | 1.28%(-0.693)#4,514 |
| 88. | Keizer | 0.57% | 1.07%(-0.499)#88 | 1.28%(-0.708)#4,591 |
| 89. | Grand Ronde | 0.57% | 1.07%(-0.500)#89 | 1.28%(-0.708)#4,593 |
| 90. | Garibaldi | 0.56% | 1.07%(-0.508)#90 | 1.28%(-0.717)#4,646 |
| 91. | Long Creek | 0.53% | 1.07%(-0.541)#91 | 1.28%(-0.749)#4,860 |
| 92. | Chenoweth | 0.52% | 1.07%(-0.543)#92 | 1.28%(-0.752)#4,874 |
| 93. | Myrtle Creek | 0.52% | 1.07%(-0.551)#93 | 1.28%(-0.760)#4,918 |
| 94. | Mount Hood | 0.51% | 1.07%(-0.552)#94 | 1.28%(-0.761)#4,931 |
| 95. | Carlton | 0.51% | 1.07%(-0.554)#95 | 1.28%(-0.763)#4,945 |
| 96. | Turner | 0.50% | 1.07%(-0.565)#96 | 1.28%(-0.774)#5,015 |
| 97. | St Paul | 0.50% | 1.07%(-0.568)#97 | 1.28%(-0.777)#5,038 |
| 98. | Bend | 0.47% | 1.07%(-0.592)#98 | 1.28%(-0.801)#5,191 |
| 99. | Island City | 0.47% | 1.07%(-0.593)#99 | 1.28%(-0.801)#5,192 |
| 100. | Tangent | 0.46% | 1.07%(-0.605)#100 | 1.28%(-0.814)#5,253 |
Common Questions
What are the Top 10 Cities with the Highest Percentage of Immigrants from Eastern Asia in Oregon?
Top 10 Cities with the Highest Percentage of Immigrants from Eastern Asia in Oregon are:
#1
37.70%
#2
8.46%
#3
6.63%
#4
5.78%
#5
5.49%
#6
4.10%
#7
3.63%
#8
3.40%
#9
2.92%
#10
2.66%
What city has the Highest Percentage of Immigrants from Eastern Asia in Oregon?
Pronghorn has the Highest Percentage of Immigrants from Eastern Asia in Oregon with 37.70%.
What is the Percentage of Immigrants from Eastern Asia in the State of Oregon?
Percentage of Immigrants from Eastern Asia in Oregon is 1.07%.
What is the Percentage of Immigrants from Eastern Asia in the United States?
Percentage of Immigrants from Eastern Asia in the United States is 1.28%.