Peoria, IL
Peoria Map
Peoria Overview
113,054
TOTAL POPULATION
54,547
MALE POPULATION
58,507
FEMALE POPULATION
93.23
MALES / 100 FEMALES
107.26
FEMALES / 100 MALES
35.6
MEDIAN AGE
3.1
AVG FAMILY SIZE
2.2
AVG HOUSEHOLD SIZE
$38,547
PER CAPITA INCOME
$79,465
AVG FAMILY INCOME
$58,068
AVG HOUSEHOLD INCOME
29.8%
WAGE / INCOME GAP [ % ]
70.2¢/ $1
WAGE / INCOME GAP [ $ ]
$11,754
FAMILY INCOME DEFICIT
0.53
INEQUALITY / GINI INDEX
54,802
LABOR FORCE [ PEOPLE ]
61.8%
PERCENT IN LABOR FORCE
8.0%
UNEMPLOYMENT RATE
Peoria Area Codes
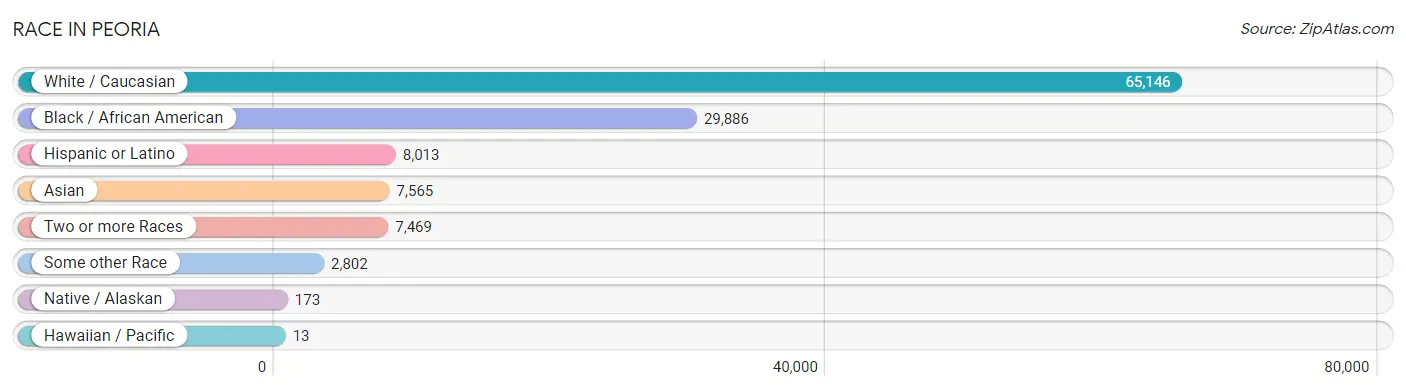
Race in Peoria
The most populous races in Peoria are White / Caucasian (65,146 | 57.6%), Black / African American (29,886 | 26.4%), and Hispanic or Latino (8,013 | 7.1%).
| Race | # Population | % Population |
| Asian | 7,565 | 6.7% |
| Black / African American | 29,886 | 26.4% |
| Hawaiian / Pacific | 13 | 0.0% |
| Hispanic or Latino | 8,013 | 7.1% |
| Native / Alaskan | 173 | 0.2% |
| White / Caucasian | 65,146 | 57.6% |
| Two or more Races | 7,469 | 6.6% |
| Some other Race | 2,802 | 2.5% |
| Total | 113,054 | 100.0% |
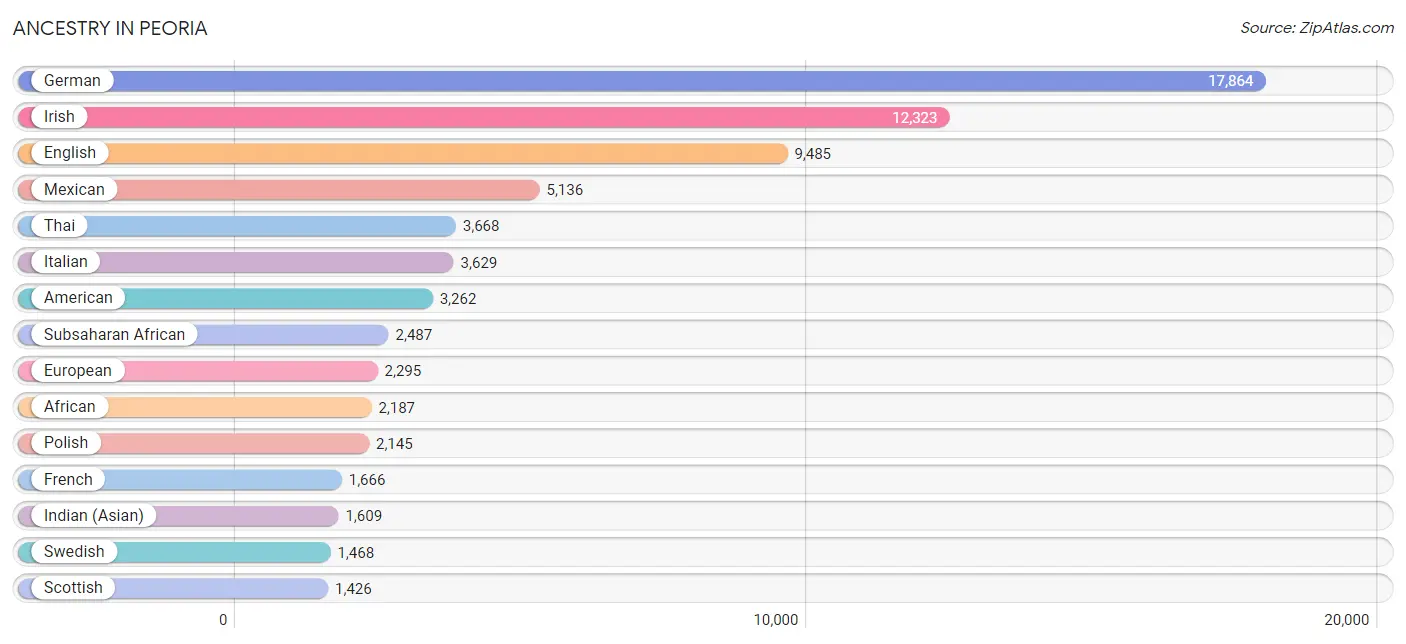
Ancestry in Peoria
The most populous ancestries reported in Peoria are German (17,864 | 15.8%), Irish (12,323 | 10.9%), English (9,485 | 8.4%), Mexican (5,136 | 4.5%), and Thai (3,668 | 3.2%), together accounting for 42.9% of all Peoria residents.
| Ancestry | # Population | % Population |
| African | 2,187 | 1.9% |
| Albanian | 5 | 0.0% |
| Aleut | 8 | 0.0% |
| Alsatian | 10 | 0.0% |
| American | 3,262 | 2.9% |
| Arab | 1,375 | 1.2% |
| Armenian | 333 | 0.3% |
| Australian | 36 | 0.0% |
| Austrian | 104 | 0.1% |
| Bahamian | 4 | 0.0% |
| Belgian | 195 | 0.2% |
| Bhutanese | 239 | 0.2% |
| Blackfeet | 39 | 0.0% |
| Bolivian | 9 | 0.0% |
| Brazilian | 29 | 0.0% |
| British | 703 | 0.6% |
| Bulgarian | 16 | 0.0% |
| Burmese | 383 | 0.3% |
| Canadian | 49 | 0.0% |
| Cape Verdean | 11 | 0.0% |
| Central American | 824 | 0.7% |
| Cherokee | 413 | 0.4% |
| Chilean | 7 | 0.0% |
| Chippewa | 23 | 0.0% |
| Choctaw | 48 | 0.0% |
| Colombian | 64 | 0.1% |
| Costa Rican | 128 | 0.1% |
| Creek | 2 | 0.0% |
| Croatian | 230 | 0.2% |
| Cuban | 65 | 0.1% |
| Czech | 213 | 0.2% |
| Czechoslovakian | 149 | 0.1% |
| Danish | 274 | 0.2% |
| Dominican | 8 | 0.0% |
| Dutch | 880 | 0.8% |
| Eastern European | 288 | 0.3% |
| Ecuadorian | 26 | 0.0% |
| Egyptian | 101 | 0.1% |
| English | 9,485 | 8.4% |
| Estonian | 14 | 0.0% |
| Ethiopian | 31 | 0.0% |
| European | 2,295 | 2.0% |
| Filipino | 103 | 0.1% |
| Finnish | 35 | 0.0% |
| French | 1,666 | 1.5% |
| French American Indian | 10 | 0.0% |
| French Canadian | 103 | 0.1% |
| German | 17,864 | 15.8% |
| Ghanaian | 54 | 0.1% |
| Greek | 573 | 0.5% |
| Guatemalan | 233 | 0.2% |
| Haitian | 4 | 0.0% |
| Honduran | 332 | 0.3% |
| Hungarian | 476 | 0.4% |
| Indian (Asian) | 1,609 | 1.4% |
| Iranian | 98 | 0.1% |
| Irish | 12,323 | 10.9% |
| Iroquois | 5 | 0.0% |
| Italian | 3,629 | 3.2% |
| Jordanian | 17 | 0.0% |
| Korean | 718 | 0.6% |
| Lebanese | 1,090 | 1.0% |
| Lithuanian | 147 | 0.1% |
| Luxembourger | 63 | 0.1% |
| Maltese | 61 | 0.1% |
| Mexican | 5,136 | 4.5% |
| Mexican American Indian | 89 | 0.1% |
| Moroccan | 96 | 0.1% |
| Native Hawaiian | 132 | 0.1% |
| Navajo | 24 | 0.0% |
| Nicaraguan | 7 | 0.0% |
| Nigerian | 146 | 0.1% |
| Northern European | 162 | 0.1% |
| Norwegian | 670 | 0.6% |
| Pakistani | 6 | 0.0% |
| Palestinian | 13 | 0.0% |
| Pennsylvania German | 37 | 0.0% |
| Polish | 2,145 | 1.9% |
| Portuguese | 106 | 0.1% |
| Puerto Rican | 628 | 0.6% |
| Romanian | 117 | 0.1% |
| Russian | 298 | 0.3% |
| Salvadoran | 124 | 0.1% |
| Samoan | 42 | 0.0% |
| Scandinavian | 221 | 0.2% |
| Scotch-Irish | 765 | 0.7% |
| Scottish | 1,426 | 1.3% |
| Serbian | 19 | 0.0% |
| Sioux | 46 | 0.0% |
| Slavic | 46 | 0.0% |
| Slovak | 187 | 0.2% |
| Slovene | 4 | 0.0% |
| South American | 301 | 0.3% |
| Spaniard | 107 | 0.1% |
| Spanish | 148 | 0.1% |
| Sri Lankan | 960 | 0.9% |
| Subsaharan African | 2,487 | 2.2% |
| Sudanese | 20 | 0.0% |
| Swedish | 1,468 | 1.3% |
| Swiss | 524 | 0.5% |
| Thai | 3,668 | 3.2% |
| Trinidadian and Tobagonian | 36 | 0.0% |
| Turkish | 40 | 0.0% |
| Ukrainian | 128 | 0.1% |
| Uruguayan | 185 | 0.2% |
| Venezuelan | 10 | 0.0% |
| Welsh | 588 | 0.5% |
| Yugoslavian | 6 | 0.0% | View All 108 Rows |
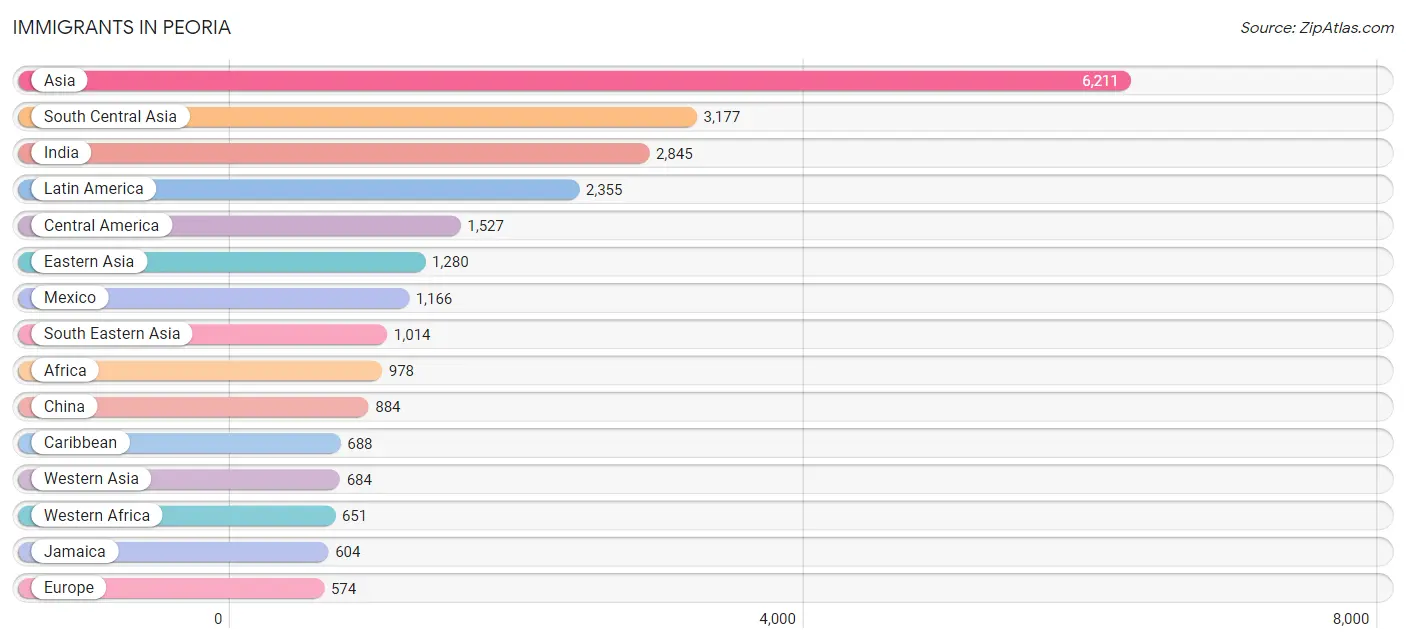
Immigrants in Peoria
The most numerous immigrant groups reported in Peoria came from Asia (6,211 | 5.5%), South Central Asia (3,177 | 2.8%), India (2,845 | 2.5%), Latin America (2,355 | 2.1%), and Central America (1,527 | 1.3%), together accounting for 14.3% of all Peoria residents.
| Immigration Origin | # Population | % Population |
| Africa | 978 | 0.9% |
| Armenia | 250 | 0.2% |
| Asia | 6,211 | 5.5% |
| Australia | 36 | 0.0% |
| Bahamas | 4 | 0.0% |
| Brazil | 26 | 0.0% |
| Bulgaria | 16 | 0.0% |
| Cameroon | 16 | 0.0% |
| Canada | 106 | 0.1% |
| Caribbean | 688 | 0.6% |
| Central America | 1,527 | 1.3% |
| China | 884 | 0.8% |
| Colombia | 32 | 0.0% |
| Congo | 1 | 0.0% |
| Costa Rica | 49 | 0.0% |
| Croatia | 21 | 0.0% |
| Cuba | 27 | 0.0% |
| Eastern Asia | 1,280 | 1.1% |
| Eastern Europe | 176 | 0.2% |
| Ecuador | 18 | 0.0% |
| Egypt | 46 | 0.0% |
| El Salvador | 82 | 0.1% |
| England | 35 | 0.0% |
| Europe | 574 | 0.5% |
| France | 36 | 0.0% |
| Germany | 123 | 0.1% |
| Ghana | 65 | 0.1% |
| Guatemala | 36 | 0.0% |
| Honduras | 174 | 0.2% |
| Hong Kong | 7 | 0.0% |
| Hungary | 7 | 0.0% |
| India | 2,845 | 2.5% |
| Iran | 85 | 0.1% |
| Ireland | 15 | 0.0% |
| Italy | 65 | 0.1% |
| Jamaica | 604 | 0.5% |
| Japan | 162 | 0.1% |
| Korea | 234 | 0.2% |
| Kuwait | 48 | 0.0% |
| Latin America | 2,355 | 2.1% |
| Lebanon | 299 | 0.3% |
| Mexico | 1,166 | 1.0% |
| Middle Africa | 175 | 0.2% |
| Morocco | 27 | 0.0% |
| Nepal | 35 | 0.0% |
| Netherlands | 13 | 0.0% |
| Nicaragua | 20 | 0.0% |
| Nigeria | 512 | 0.4% |
| Northern Africa | 144 | 0.1% |
| Northern Europe | 97 | 0.1% |
| Oceania | 36 | 0.0% |
| Pakistan | 212 | 0.2% |
| Philippines | 451 | 0.4% |
| Poland | 47 | 0.0% |
| Romania | 46 | 0.0% |
| Russia | 39 | 0.0% |
| Saudi Arabia | 13 | 0.0% |
| Scotland | 8 | 0.0% |
| South America | 140 | 0.1% |
| South Central Asia | 3,177 | 2.8% |
| South Eastern Asia | 1,014 | 0.9% |
| Southern Europe | 129 | 0.1% |
| Spain | 49 | 0.0% |
| Sudan | 13 | 0.0% |
| Sweden | 25 | 0.0% |
| Syria | 13 | 0.0% |
| Taiwan | 46 | 0.0% |
| Trinidad and Tobago | 36 | 0.0% |
| Turkey | 22 | 0.0% |
| Uruguay | 64 | 0.1% |
| Vietnam | 563 | 0.5% |
| Western Africa | 651 | 0.6% |
| Western Asia | 684 | 0.6% |
| Western Europe | 172 | 0.2% |
| Zaire | 158 | 0.1% | View All 75 Rows |
Sex and Age in Peoria
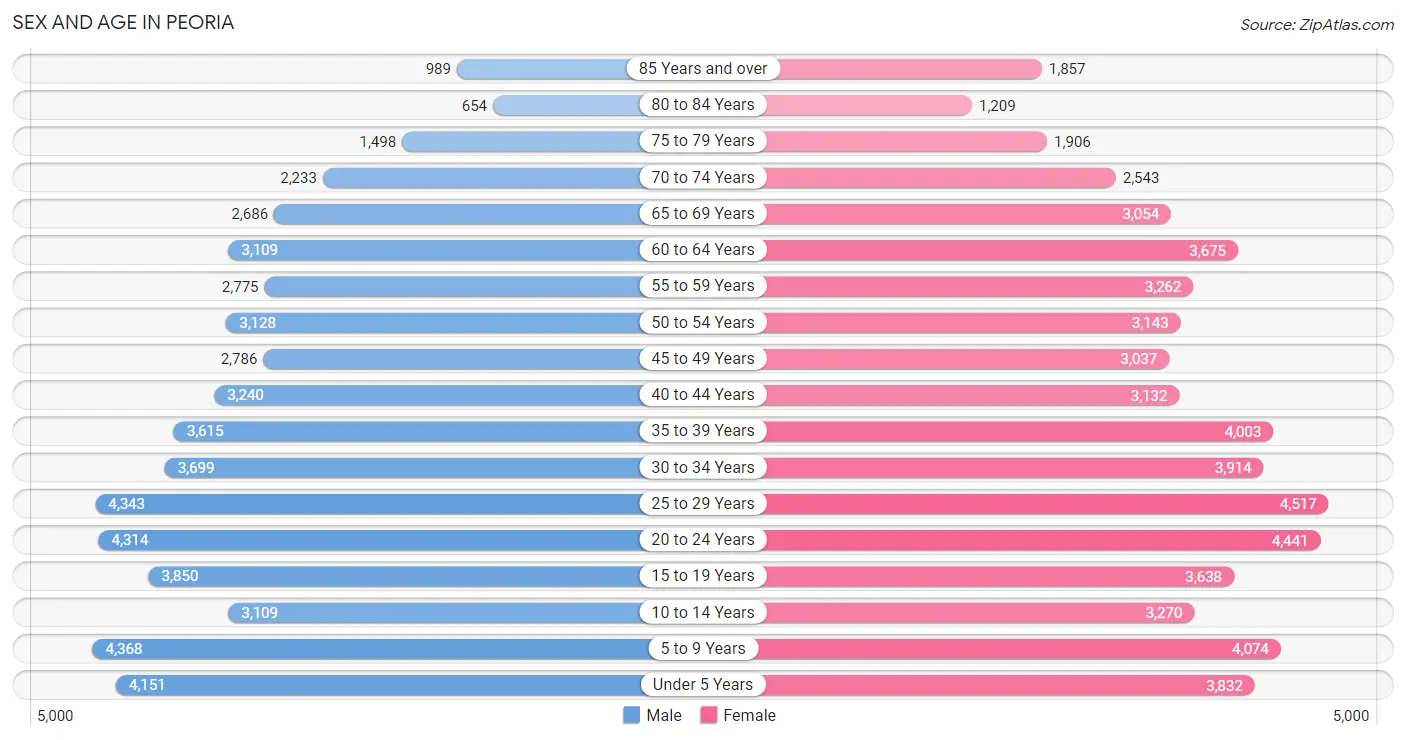
Sex and Age in Peoria
The most populous age groups in Peoria are 5 to 9 Years (4,368 | 8.0%) for men and 25 to 29 Years (4,517 | 7.7%) for women.
| Age Bracket | Male | Female |
| Under 5 Years | 4,151 (7.6%) | 3,832 (6.6%) |
| 5 to 9 Years | 4,368 (8.0%) | 4,074 (7.0%) |
| 10 to 14 Years | 3,109 (5.7%) | 3,270 (5.6%) |
| 15 to 19 Years | 3,850 (7.1%) | 3,638 (6.2%) |
| 20 to 24 Years | 4,314 (7.9%) | 4,441 (7.6%) |
| 25 to 29 Years | 4,343 (8.0%) | 4,517 (7.7%) |
| 30 to 34 Years | 3,699 (6.8%) | 3,914 (6.7%) |
| 35 to 39 Years | 3,615 (6.6%) | 4,003 (6.8%) |
| 40 to 44 Years | 3,240 (5.9%) | 3,132 (5.3%) |
| 45 to 49 Years | 2,786 (5.1%) | 3,037 (5.2%) |
| 50 to 54 Years | 3,128 (5.7%) | 3,143 (5.4%) |
| 55 to 59 Years | 2,775 (5.1%) | 3,262 (5.6%) |
| 60 to 64 Years | 3,109 (5.7%) | 3,675 (6.3%) |
| 65 to 69 Years | 2,686 (4.9%) | 3,054 (5.2%) |
| 70 to 74 Years | 2,233 (4.1%) | 2,543 (4.3%) |
| 75 to 79 Years | 1,498 (2.8%) | 1,906 (3.3%) |
| 80 to 84 Years | 654 (1.2%) | 1,209 (2.1%) |
| 85 Years and over | 989 (1.8%) | 1,857 (3.2%) |
| Total | 54,547 (100.0%) | 58,507 (100.0%) |
Families and Households in Peoria
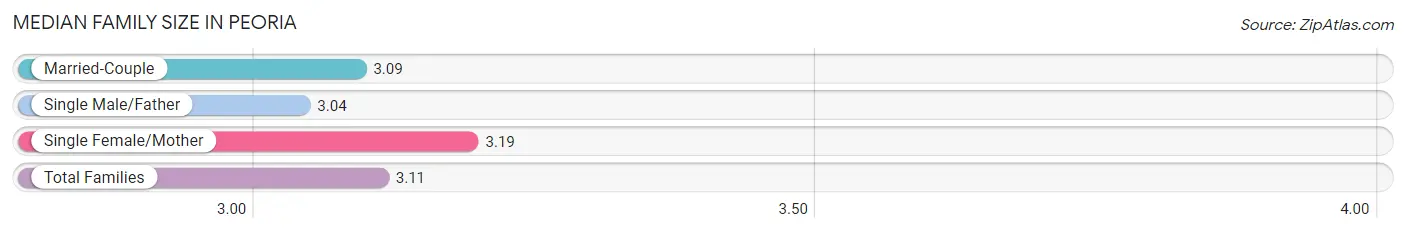
Median Family Size in Peoria
The median family size in Peoria is 3.11 persons per family, with single female/mother families (7,218 | 28.2%) accounting for the largest median family size of 3.19 persons per family. On the other hand, single male/father families (1,789 | 7.0%) represent the smallest median family size with 3.04 persons per family.
| Family Type | # Families | Family Size |
| Married-Couple | 16,609 (64.8%) | 3.09 |
| Single Male/Father | 1,789 (7.0%) | 3.04 |
| Single Female/Mother | 7,218 (28.2%) | 3.19 |
| Total Families | 25,616 (100.0%) | 3.11 |
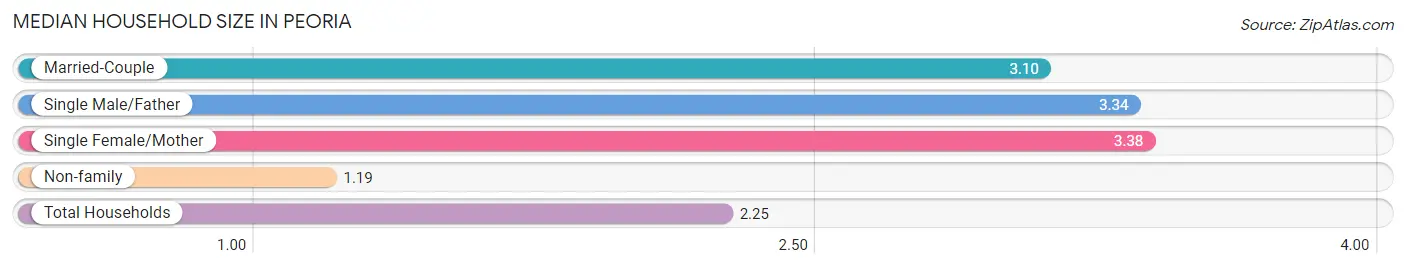
Median Household Size in Peoria
The median household size in Peoria is 2.25 persons per household, with single female/mother households (7,218 | 14.9%) accounting for the largest median household size of 3.38 persons per household. non-family households (22,926 | 47.2%) represent the smallest median household size with 1.19 persons per household.
| Household Type | # Households | Household Size |
| Married-Couple | 16,609 (34.2%) | 3.10 |
| Single Male/Father | 1,789 (3.7%) | 3.34 |
| Single Female/Mother | 7,218 (14.9%) | 3.38 |
| Non-family | 22,926 (47.2%) | 1.19 |
| Total Households | 48,542 (100.0%) | 2.25 |
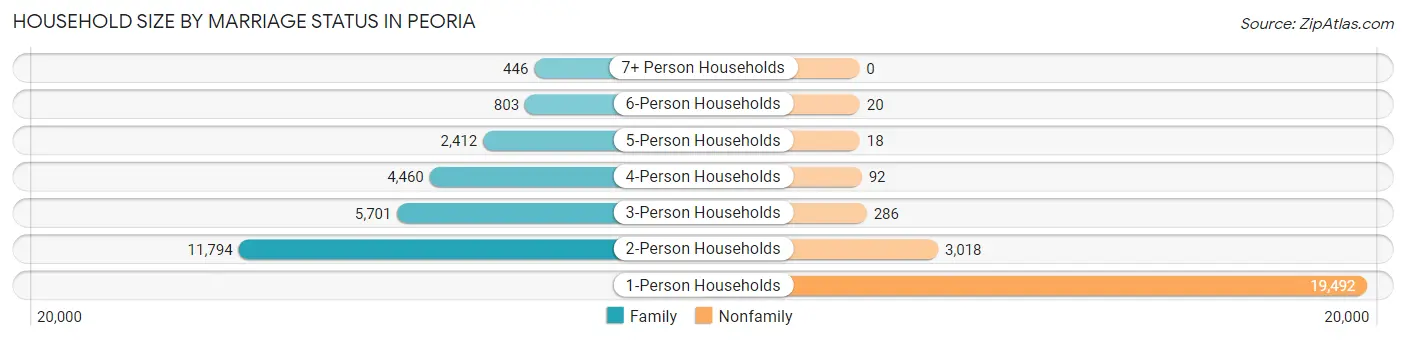
Household Size by Marriage Status in Peoria
Out of a total of 48,542 households in Peoria, 25,616 (52.8%) are family households, while 22,926 (47.2%) are nonfamily households. The most numerous type of family households are 2-person households, comprising 11,794, and the most common type of nonfamily households are 1-person households, comprising 19,492.
| Household Size | Family Households | Nonfamily Households |
| 1-Person Households | - | 19,492 (40.2%) |
| 2-Person Households | 11,794 (24.3%) | 3,018 (6.2%) |
| 3-Person Households | 5,701 (11.7%) | 286 (0.6%) |
| 4-Person Households | 4,460 (9.2%) | 92 (0.2%) |
| 5-Person Households | 2,412 (5.0%) | 18 (0.0%) |
| 6-Person Households | 803 (1.7%) | 20 (0.0%) |
| 7+ Person Households | 446 (0.9%) | 0 (0.0%) |
| Total | 25,616 (52.8%) | 22,926 (47.2%) |
Female Fertility in Peoria
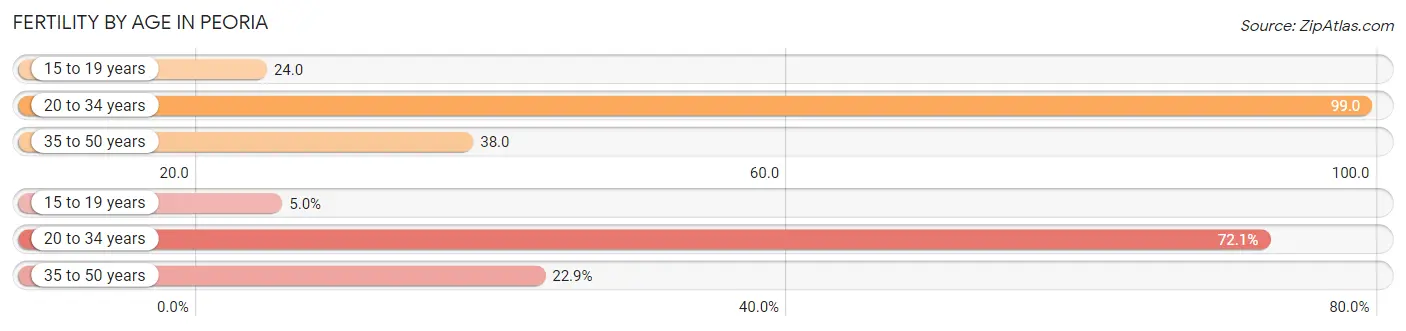
Fertility by Age in Peoria
Average fertility rate in Peoria is 65.0 births per 1,000 women. Women in the age bracket of 20 to 34 years have the highest fertility rate with 99.0 births per 1,000 women. Women in the age bracket of 20 to 34 years acount for 72.1% of all women with births.
| Age Bracket | Women with Births | Births / 1,000 Women |
| 15 to 19 years | 89 (5.0%) | 24.0 |
| 20 to 34 years | 1,272 (72.1%) | 99.0 |
| 35 to 50 years | 404 (22.9%) | 38.0 |
| Total | 1,765 (100.0%) | 65.0 |
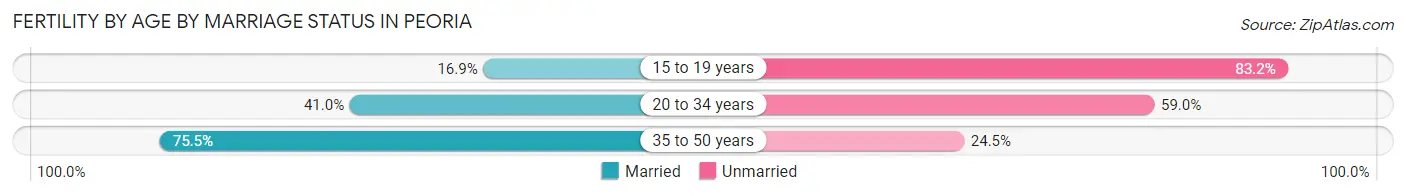
Fertility by Age by Marriage Status in Peoria
47.6% of women with births (1,765) in Peoria are married. The highest percentage of unmarried women with births falls into 15 to 19 years age bracket with 83.2% of them unmarried at the time of birth, while the lowest percentage of unmarried women with births belong to 35 to 50 years age bracket with 24.5% of them unmarried.
| Age Bracket | Married | Unmarried |
| 15 to 19 years | 15 (16.9%) | 74 (83.2%) |
| 20 to 34 years | 522 (41.0%) | 750 (59.0%) |
| 35 to 50 years | 305 (75.5%) | 99 (24.5%) |
| Total | 840 (47.6%) | 925 (52.4%) |
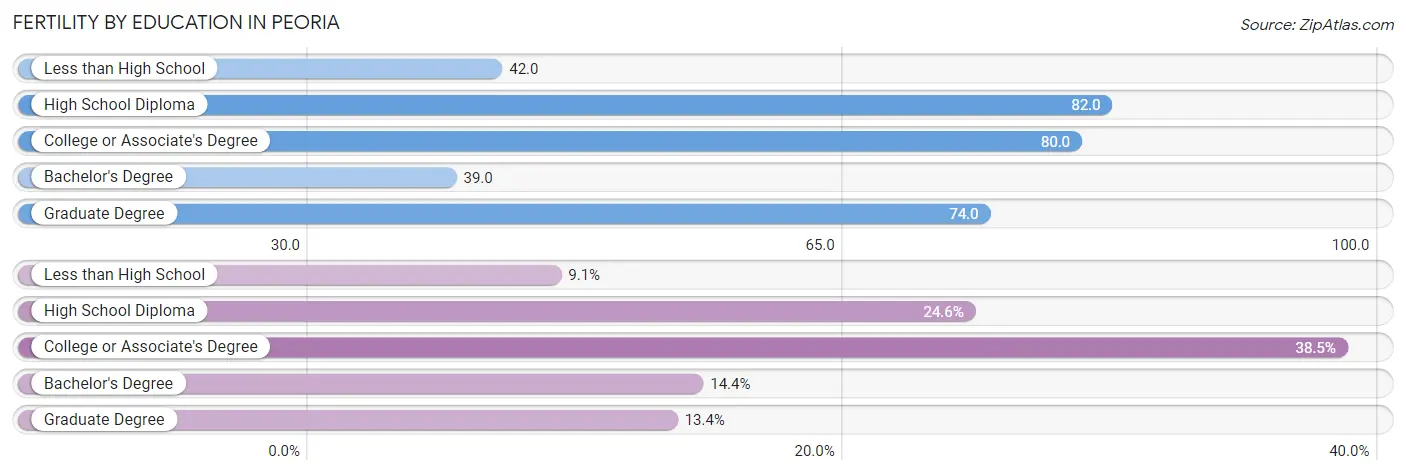
Fertility by Education in Peoria
Average fertility rate in Peoria is 65.0 births per 1,000 women. Women with the education attainment of high school diploma have the highest fertility rate of 82.0 births per 1,000 women, while women with the education attainment of bachelor's degree have the lowest fertility at 39.0 births per 1,000 women. Women with the education attainment of college or associate's degree represent 38.5% of all women with births.
| Educational Attainment | Women with Births | Births / 1,000 Women |
| Less than High School | 160 (9.1%) | 42.0 |
| High School Diploma | 434 (24.6%) | 82.0 |
| College or Associate's Degree | 680 (38.5%) | 80.0 |
| Bachelor's Degree | 254 (14.4%) | 39.0 |
| Graduate Degree | 237 (13.4%) | 74.0 |
| Total | 1,765 (100.0%) | 65.0 |
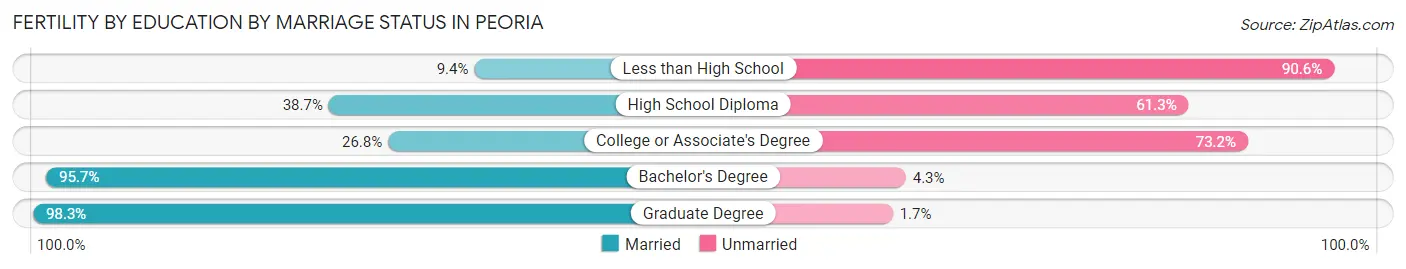
Fertility by Education by Marriage Status in Peoria
52.4% of women with births in Peoria are unmarried. Women with the educational attainment of graduate degree are most likely to be married with 98.3% of them married at childbirth, while women with the educational attainment of less than high school are least likely to be married with 90.6% of them unmarried at childbirth.
| Educational Attainment | Married | Unmarried |
| Less than High School | 15 (9.4%) | 145 (90.6%) |
| High School Diploma | 168 (38.7%) | 266 (61.3%) |
| College or Associate's Degree | 182 (26.8%) | 498 (73.2%) |
| Bachelor's Degree | 243 (95.7%) | 11 (4.3%) |
| Graduate Degree | 233 (98.3%) | 4 (1.7%) |
| Total | 840 (47.6%) | 925 (52.4%) |
Income in Peoria
Income Overview in Peoria
Per Capita Income in Peoria is $38,547, while median incomes of families and households are $79,465 and $58,068 respectively.
| Characteristic | Number | Measure |
| Per Capita Income | 113,054 | $38,547 |
| Median Family Income | 25,616 | $79,465 |
| Mean Family Income | 25,616 | $117,673 |
| Median Household Income | 48,542 | $58,068 |
| Mean Household Income | 48,542 | $88,419 |
| Income Deficit | 25,616 | $11,754 |
| Wage / Income Gap (%) | 113,054 | 29.84% |
| Wage / Income Gap ($) | 113,054 | 70.16¢ per $1 |
| Gini / Inequality Index | 113,054 | 0.53 |
Earnings by Sex in Peoria
Average Earnings in Peoria are $37,212, $45,634 for men and $32,017 for women, a difference of 29.8%.
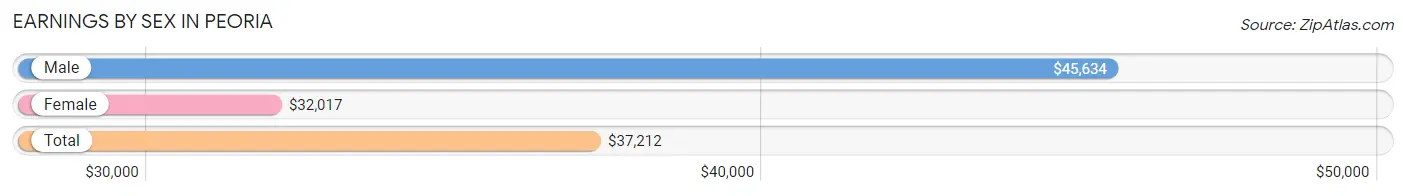
| Sex | Number | Average Earnings |
| Male | 27,551 (49.0%) | $45,634 |
| Female | 28,633 (51.0%) | $32,017 |
| Total | 56,184 (100.0%) | $37,212 |
Earnings by Sex by Income Bracket in Peoria
The most common earnings brackets in Peoria are $100,000+ for men (5,570 | 20.2%) and $25,000 to $29,999 for women (2,366 | 8.3%).
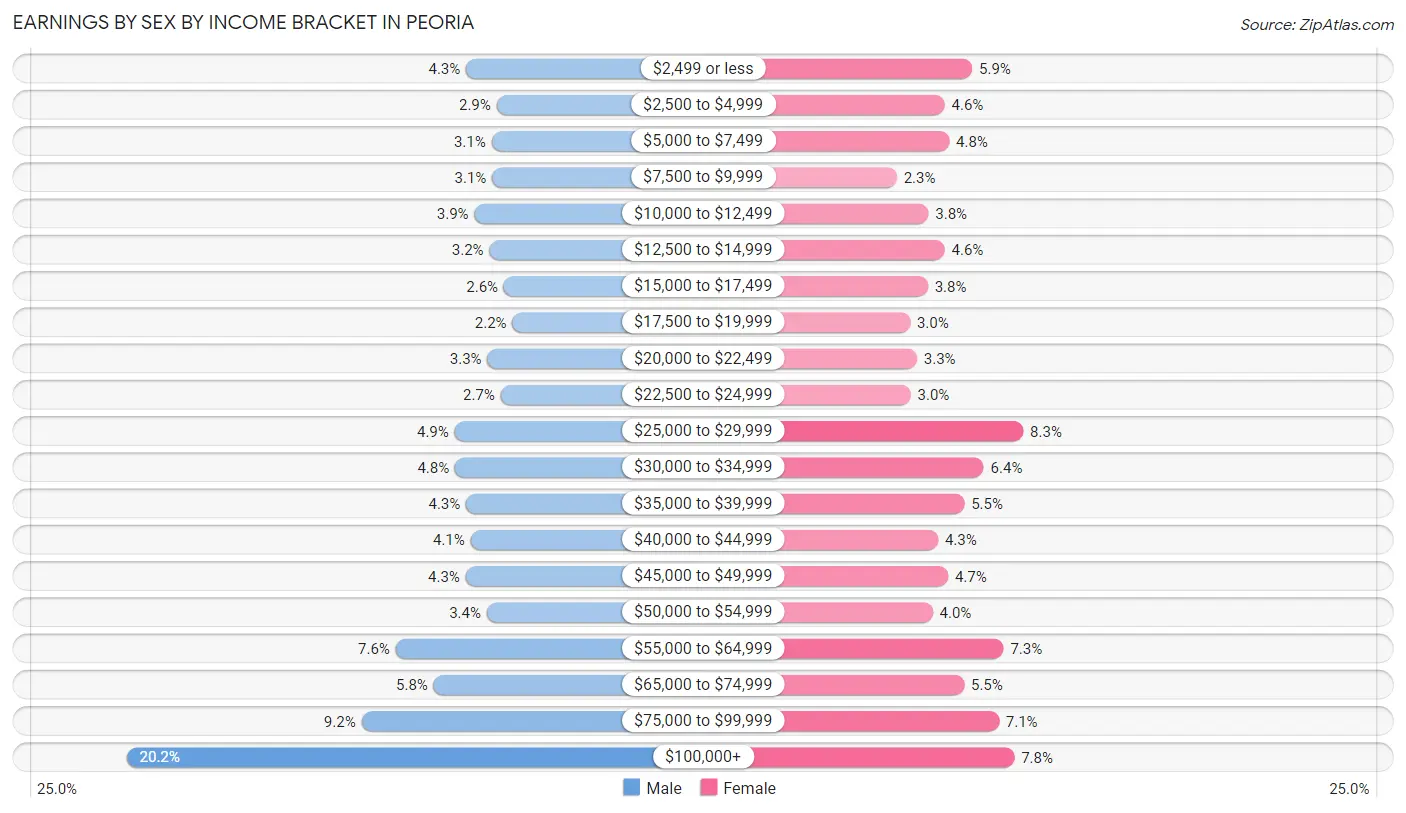
| Income | Male | Female |
| $2,499 or less | 1,190 (4.3%) | 1,682 (5.9%) |
| $2,500 to $4,999 | 797 (2.9%) | 1,311 (4.6%) |
| $5,000 to $7,499 | 861 (3.1%) | 1,371 (4.8%) |
| $7,500 to $9,999 | 853 (3.1%) | 670 (2.3%) |
| $10,000 to $12,499 | 1,082 (3.9%) | 1,094 (3.8%) |
| $12,500 to $14,999 | 889 (3.2%) | 1,312 (4.6%) |
| $15,000 to $17,499 | 702 (2.5%) | 1,084 (3.8%) |
| $17,500 to $19,999 | 592 (2.1%) | 848 (3.0%) |
| $20,000 to $22,499 | 916 (3.3%) | 939 (3.3%) |
| $22,500 to $24,999 | 743 (2.7%) | 856 (3.0%) |
| $25,000 to $29,999 | 1,338 (4.9%) | 2,366 (8.3%) |
| $30,000 to $34,999 | 1,333 (4.8%) | 1,834 (6.4%) |
| $35,000 to $39,999 | 1,189 (4.3%) | 1,576 (5.5%) |
| $40,000 to $44,999 | 1,133 (4.1%) | 1,224 (4.3%) |
| $45,000 to $49,999 | 1,195 (4.3%) | 1,356 (4.7%) |
| $50,000 to $54,999 | 922 (3.4%) | 1,150 (4.0%) |
| $55,000 to $64,999 | 2,099 (7.6%) | 2,102 (7.3%) |
| $65,000 to $74,999 | 1,608 (5.8%) | 1,573 (5.5%) |
| $75,000 to $99,999 | 2,539 (9.2%) | 2,039 (7.1%) |
| $100,000+ | 5,570 (20.2%) | 2,246 (7.8%) |
| Total | 27,551 (100.0%) | 28,633 (100.0%) |
Earnings by Sex by Educational Attainment in Peoria
Average earnings in Peoria are $55,083 for men and $37,997 for women, a difference of 31.0%. Men with an educational attainment of graduate degree enjoy the highest average annual earnings of $108,060, while those with less than high school education earn the least with $28,542. Women with an educational attainment of graduate degree earn the most with the average annual earnings of $65,918, while those with less than high school education have the smallest earnings of $16,188.
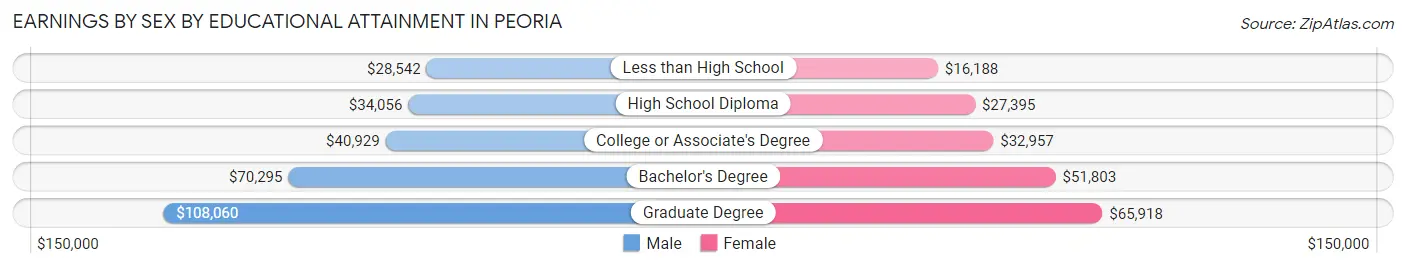
| Educational Attainment | Male Income | Female Income |
| Less than High School | $28,542 | $16,188 |
| High School Diploma | $34,056 | $27,395 |
| College or Associate's Degree | $40,929 | $32,957 |
| Bachelor's Degree | $70,295 | $51,803 |
| Graduate Degree | $108,060 | $65,918 |
| Total | $55,083 | $37,997 |
Family Income in Peoria
Family Income Brackets in Peoria
According to the Peoria family income data, there are 4,227 families falling into the $100,000 to $149,999 income range, which is the most common income bracket and makes up 16.5% of all families. Conversely, the $10,000 to $14,999 income bracket is the least frequent group with only 922 families (3.6%) belonging to this category.
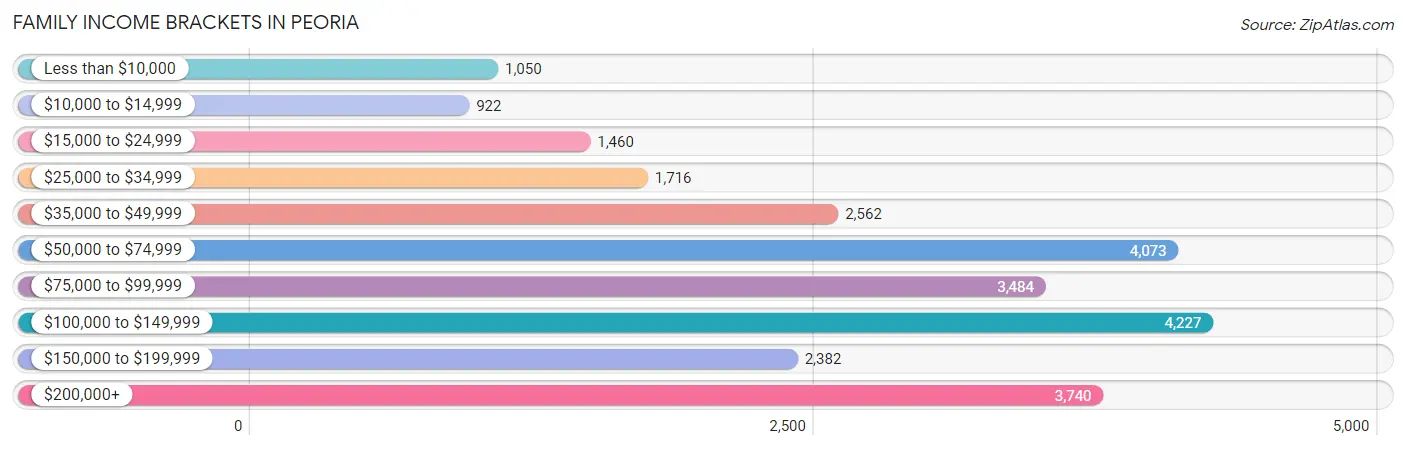
| Income Bracket | # Families | % Families |
| Less than $10,000 | 1,050 | 4.1% |
| $10,000 to $14,999 | 922 | 3.6% |
| $15,000 to $24,999 | 1,460 | 5.7% |
| $25,000 to $34,999 | 1,716 | 6.7% |
| $35,000 to $49,999 | 2,562 | 10.0% |
| $50,000 to $74,999 | 4,073 | 15.9% |
| $75,000 to $99,999 | 3,484 | 13.6% |
| $100,000 to $149,999 | 4,227 | 16.5% |
| $150,000 to $199,999 | 2,382 | 9.3% |
| $200,000+ | 3,740 | 14.6% |
Family Income by Famaliy Size in Peoria
4-person families (4,146 | 16.2%) account for the highest median family income in Peoria with $123,565 per family, while 2-person families (12,610 | 49.2%) have the highest median income of $38,519 per family member.
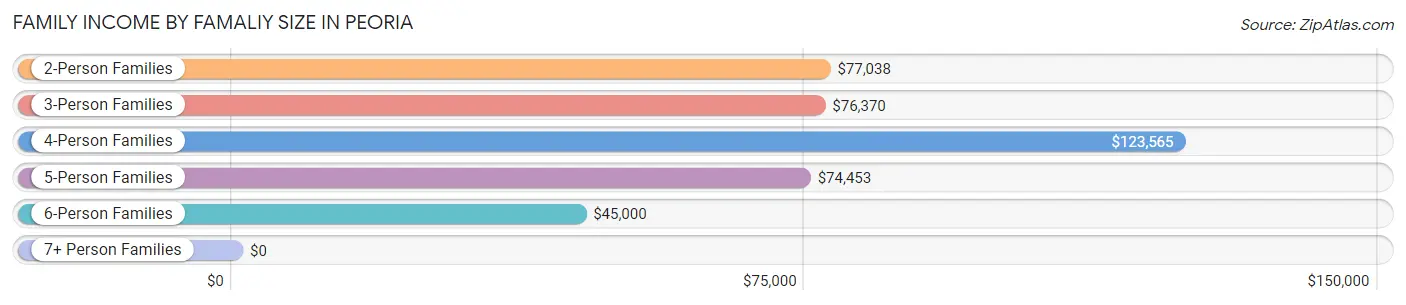
| Income Bracket | # Families | Median Income |
| 2-Person Families | 12,610 (49.2%) | $77,038 |
| 3-Person Families | 5,645 (22.0%) | $76,370 |
| 4-Person Families | 4,146 (16.2%) | $123,565 |
| 5-Person Families | 2,130 (8.3%) | $74,453 |
| 6-Person Families | 732 (2.9%) | $45,000 |
| 7+ Person Families | 353 (1.4%) | $0 |
| Total | 25,616 (100.0%) | $79,465 |
Family Income by Number of Earners in Peoria
The median family income in Peoria is $79,465, with families comprising 3+ earners (1,771) having the highest median family income of $122,292, while families with no earners (3,837) have the lowest median family income of $51,448, accounting for 6.9% and 15.0% of families, respectively.
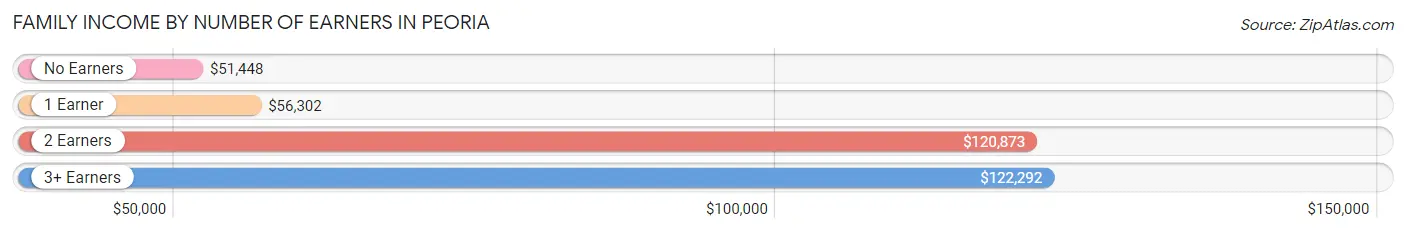
| Number of Earners | # Families | Median Income |
| No Earners | 3,837 (15.0%) | $51,448 |
| 1 Earner | 9,739 (38.0%) | $56,302 |
| 2 Earners | 10,269 (40.1%) | $120,873 |
| 3+ Earners | 1,771 (6.9%) | $122,292 |
| Total | 25,616 (100.0%) | $79,465 |
Household Income in Peoria
Household Income Brackets in Peoria
With 8,301 households falling in the category, the $50,000 to $74,999 income range is the most frequent in Peoria, accounting for 17.1% of all households. In contrast, only 3,058 households (6.3%) fall into the $150,000 to $199,999 income bracket, making it the least populous group.
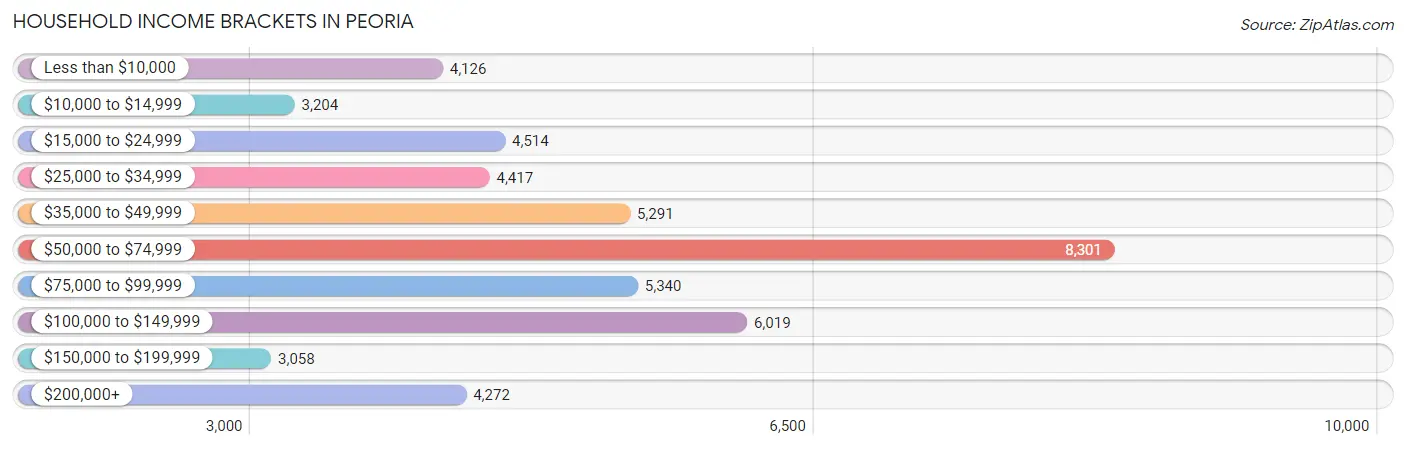
| Income Bracket | # Households | % Households |
| Less than $10,000 | 4,126 | 8.5% |
| $10,000 to $14,999 | 3,204 | 6.6% |
| $15,000 to $24,999 | 4,514 | 9.3% |
| $25,000 to $34,999 | 4,417 | 9.1% |
| $35,000 to $49,999 | 5,291 | 10.9% |
| $50,000 to $74,999 | 8,301 | 17.1% |
| $75,000 to $99,999 | 5,340 | 11.0% |
| $100,000 to $149,999 | 6,019 | 12.4% |
| $150,000 to $199,999 | 3,058 | 6.3% |
| $200,000+ | 4,272 | 8.8% |
Household Income by Householder Age in Peoria
The median household income in Peoria is $58,068, with the highest median household income of $69,899 found in the 45 to 64 years age bracket for the primary householder. A total of 15,116 households (31.1%) fall into this category. Meanwhile, the 15 to 24 years age bracket for the primary householder has the lowest median household income of $30,042, with 3,446 households (7.1%) in this group.
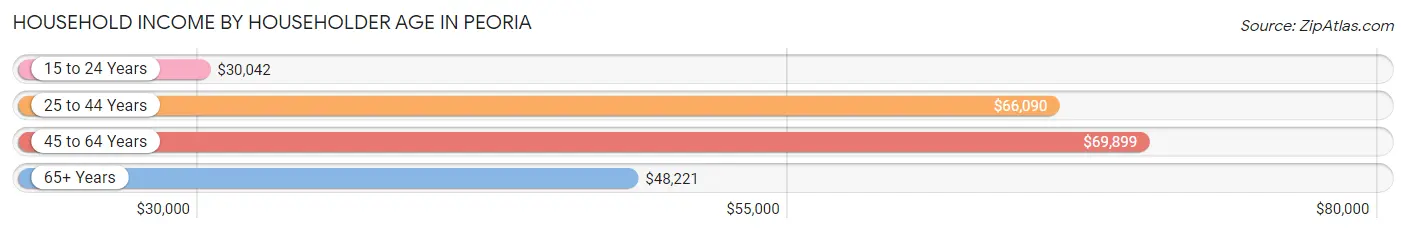
| Income Bracket | # Households | Median Income |
| 15 to 24 Years | 3,446 (7.1%) | $30,042 |
| 25 to 44 Years | 17,108 (35.2%) | $66,090 |
| 45 to 64 Years | 15,116 (31.1%) | $69,899 |
| 65+ Years | 12,872 (26.5%) | $48,221 |
| Total | 48,542 (100.0%) | $58,068 |
Poverty in Peoria
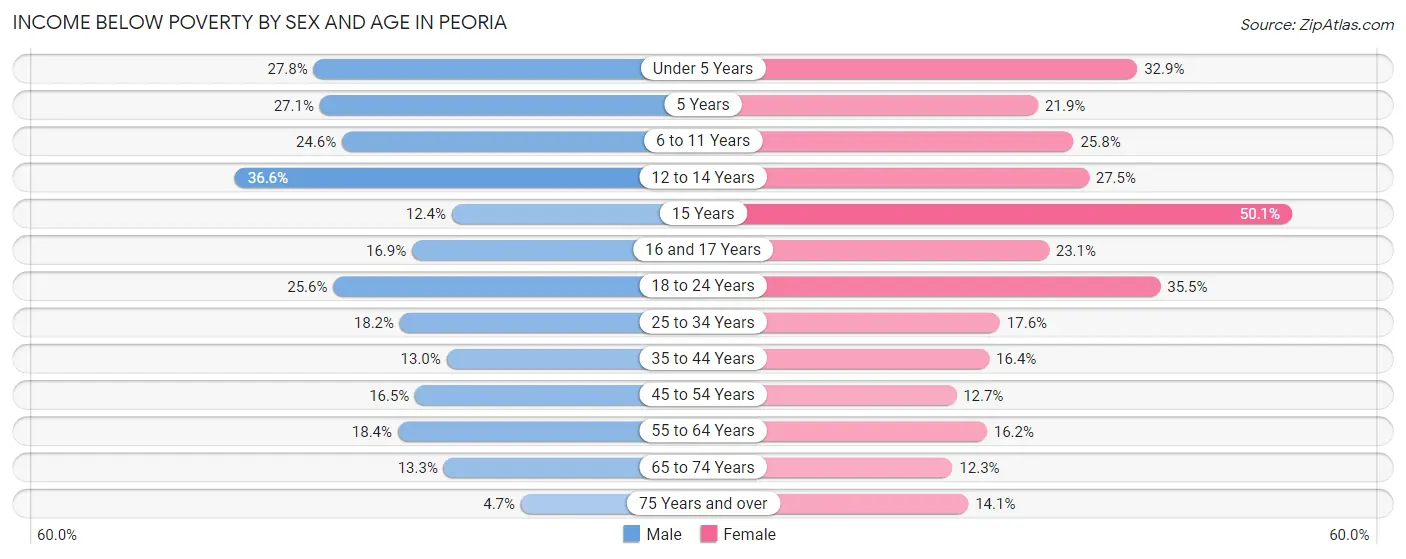
Income Below Poverty by Sex and Age in Peoria
With 18.8% poverty level for males and 20.2% for females among the residents of Peoria, 12 to 14 year old males and 15 year old females are the most vulnerable to poverty, with 692 males (36.6%) and 401 females (50.1%) in their respective age groups living below the poverty level.
| Age Bracket | Male | Female |
| Under 5 Years | 1,136 (27.8%) | 1,251 (32.9%) |
| 5 Years | 134 (27.1%) | 201 (21.9%) |
| 6 to 11 Years | 1,233 (24.6%) | 1,086 (25.8%) |
| 12 to 14 Years | 692 (36.6%) | 575 (27.5%) |
| 15 Years | 96 (12.4%) | 401 (50.1%) |
| 16 and 17 Years | 235 (16.9%) | 248 (23.1%) |
| 18 to 24 Years | 1,270 (25.6%) | 1,796 (35.5%) |
| 25 to 34 Years | 1,458 (18.2%) | 1,484 (17.6%) |
| 35 to 44 Years | 889 (13.0%) | 1,170 (16.4%) |
| 45 to 54 Years | 966 (16.5%) | 785 (12.7%) |
| 55 to 64 Years | 1,071 (18.4%) | 1,111 (16.2%) |
| 65 to 74 Years | 642 (13.3%) | 677 (12.3%) |
| 75 Years and over | 142 (4.7%) | 625 (14.1%) |
| Total | 9,964 (18.8%) | 11,410 (20.2%) |
Income Above Poverty by Sex and Age in Peoria
According to the poverty statistics in Peoria, males aged 75 years and over and females aged 65 to 74 years are the age groups that are most secure financially, with 95.3% of males and 87.7% of females in these age groups living above the poverty line.
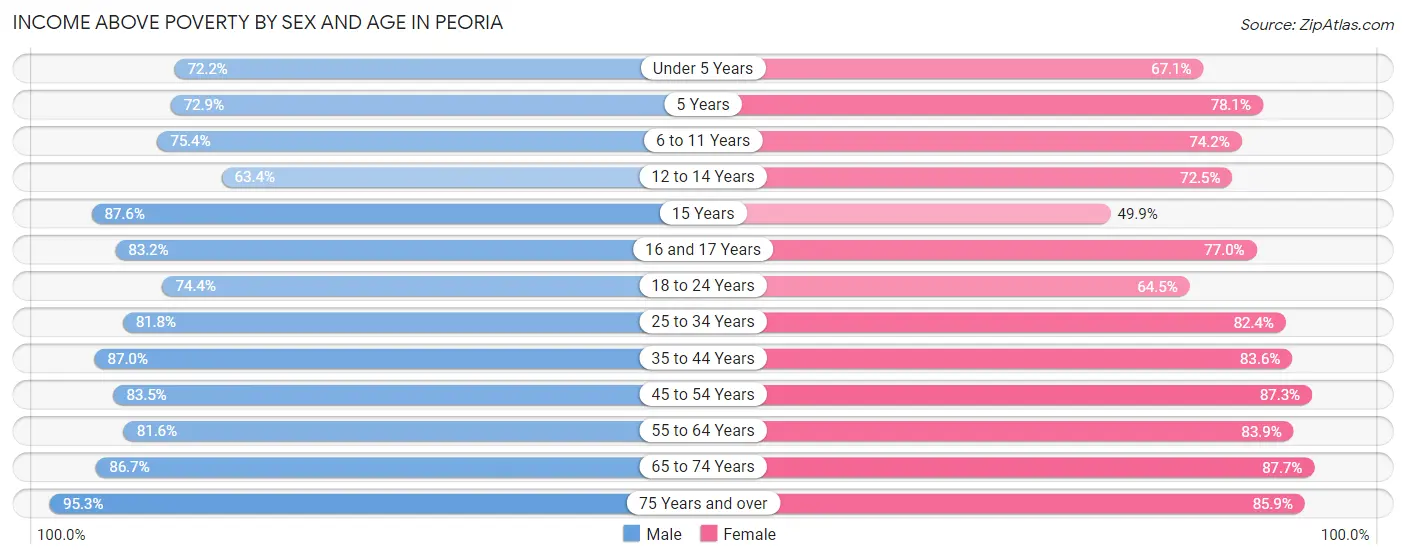
| Age Bracket | Male | Female |
| Under 5 Years | 2,948 (72.2%) | 2,552 (67.1%) |
| 5 Years | 360 (72.9%) | 718 (78.1%) |
| 6 to 11 Years | 3,771 (75.4%) | 3,124 (74.2%) |
| 12 to 14 Years | 1,200 (63.4%) | 1,515 (72.5%) |
| 15 Years | 677 (87.6%) | 399 (49.9%) |
| 16 and 17 Years | 1,160 (83.2%) | 828 (76.9%) |
| 18 to 24 Years | 3,687 (74.4%) | 3,267 (64.5%) |
| 25 to 34 Years | 6,550 (81.8%) | 6,944 (82.4%) |
| 35 to 44 Years | 5,949 (87.0%) | 5,958 (83.6%) |
| 45 to 54 Years | 4,887 (83.5%) | 5,379 (87.3%) |
| 55 to 64 Years | 4,740 (81.6%) | 5,770 (83.9%) |
| 65 to 74 Years | 4,178 (86.7%) | 4,819 (87.7%) |
| 75 Years and over | 2,857 (95.3%) | 3,814 (85.9%) |
| Total | 42,964 (81.2%) | 45,087 (79.8%) |
Income Below Poverty Among Married-Couple Families in Peoria
The poverty statistics for married-couple families in Peoria show that 3.8% or 627 of the total 16,609 families live below the poverty line. Families with 5 or more children have the highest poverty rate of 29.3%, comprising of 27 families. On the other hand, families with no children have the lowest poverty rate of 2.2%, which includes 226 families.
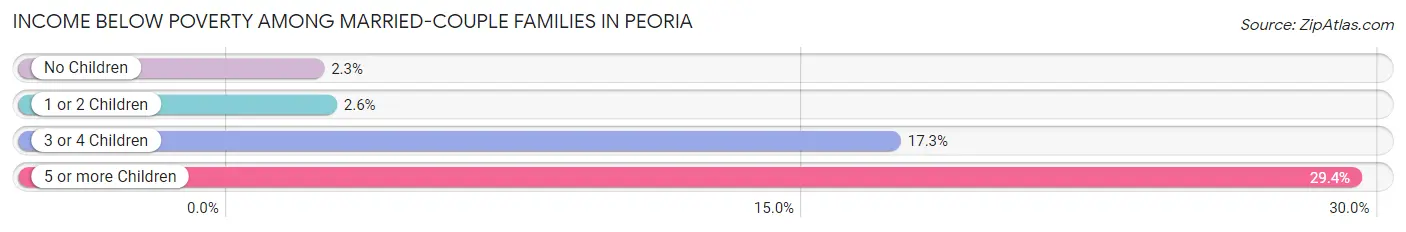
| Children | Above Poverty | Below Poverty |
| No Children | 9,802 (97.8%) | 226 (2.2%) |
| 1 or 2 Children | 4,954 (97.4%) | 131 (2.6%) |
| 3 or 4 Children | 1,161 (82.7%) | 243 (17.3%) |
| 5 or more Children | 65 (70.7%) | 27 (29.3%) |
| Total | 15,982 (96.2%) | 627 (3.8%) |
Income Below Poverty Among Single-Parent Households in Peoria
According to the poverty data in Peoria, 21.2% or 380 single-father households and 32.6% or 2,351 single-mother households are living below the poverty line. Among single-father households, those with 1 or 2 children have the highest poverty rate, with 246 households (31.3%) experiencing poverty. Likewise, among single-mother households, those with 5 or more children have the highest poverty rate, with 159 households (95.2%) falling below the poverty line.
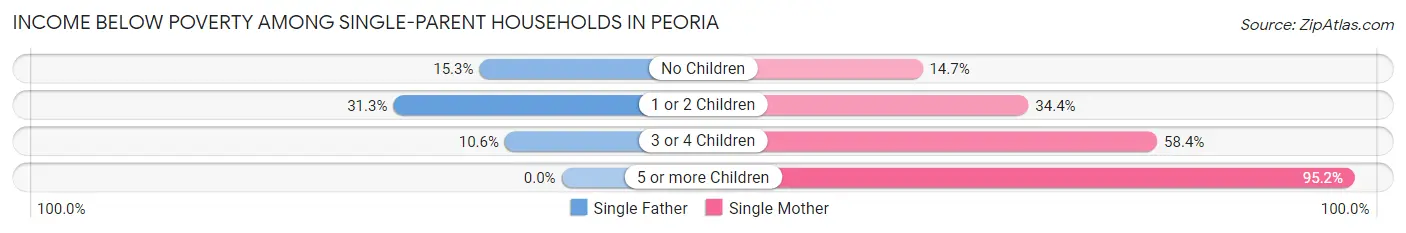
| Children | Single Father | Single Mother |
| No Children | 115 (15.3%) | 370 (14.7%) |
| 1 or 2 Children | 246 (31.3%) | 1,182 (34.4%) |
| 3 or 4 Children | 19 (10.6%) | 640 (58.4%) |
| 5 or more Children | 0 (0.0%) | 159 (95.2%) |
| Total | 380 (21.2%) | 2,351 (32.6%) |
Income Below Poverty Among Married-Couple vs Single-Parent Households in Peoria
The poverty data for Peoria shows that 627 of the married-couple family households (3.8%) and 2,731 of the single-parent households (30.3%) are living below the poverty level. Within the married-couple family households, those with 5 or more children have the highest poverty rate, with 27 households (29.3%) falling below the poverty line. Among the single-parent households, those with 5 or more children have the highest poverty rate, with 159 household (66.2%) living below poverty.
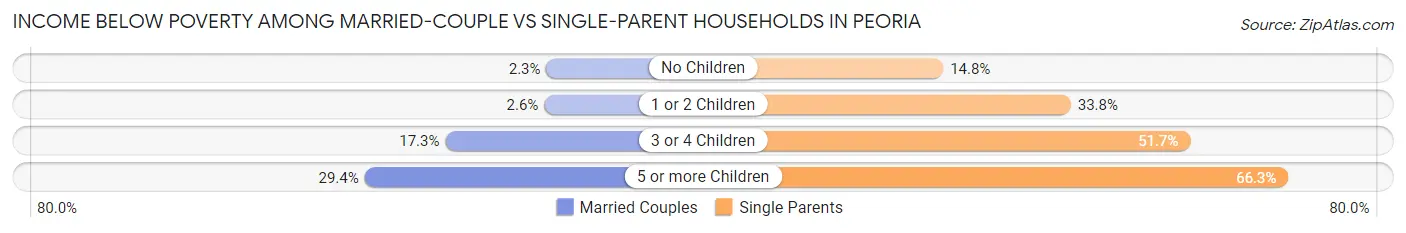
| Children | Married-Couple Families | Single-Parent Households |
| No Children | 226 (2.2%) | 485 (14.8%) |
| 1 or 2 Children | 131 (2.6%) | 1,428 (33.8%) |
| 3 or 4 Children | 243 (17.3%) | 659 (51.6%) |
| 5 or more Children | 27 (29.3%) | 159 (66.2%) |
| Total | 627 (3.8%) | 2,731 (30.3%) |
Employment Characteristics in Peoria
Employment by Class of Employer in Peoria
Among the 49,404 employed individuals in Peoria, private company employees (33,896 | 68.6%), not-for-profit organizations (7,629 | 15.4%), and local government employees (2,768 | 5.6%) make up the most common classes of employment.
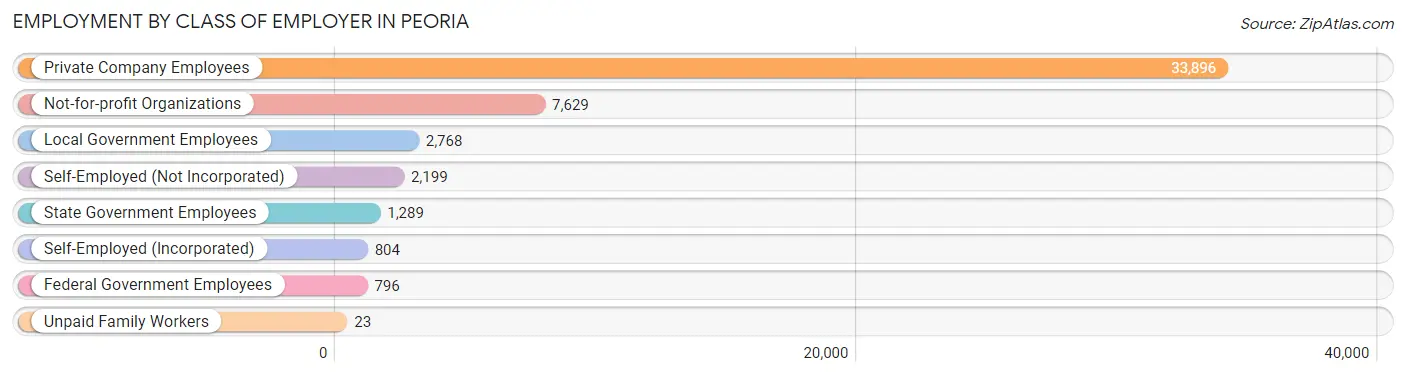
| Employer Class | # Employees | % Employees |
| Private Company Employees | 33,896 | 68.6% |
| Self-Employed (Incorporated) | 804 | 1.6% |
| Self-Employed (Not Incorporated) | 2,199 | 4.4% |
| Not-for-profit Organizations | 7,629 | 15.4% |
| Local Government Employees | 2,768 | 5.6% |
| State Government Employees | 1,289 | 2.6% |
| Federal Government Employees | 796 | 1.6% |
| Unpaid Family Workers | 23 | 0.1% |
| Total | 49,404 | 100.0% |
Employment Status by Age in Peoria
According to the labor force statistics for Peoria, out of the total population over 16 years of age (88,677), 61.8% or 54,802 individuals are in the labor force, with 8.0% or 4,384 of them unemployed. The age group with the highest labor force participation rate is 30 to 34 years, with 88.5% or 6,738 individuals in the labor force. Within the labor force, the 16 to 19 years age range has the highest percentage of unemployed individuals, with 15.6% or 346 of them being unemployed.
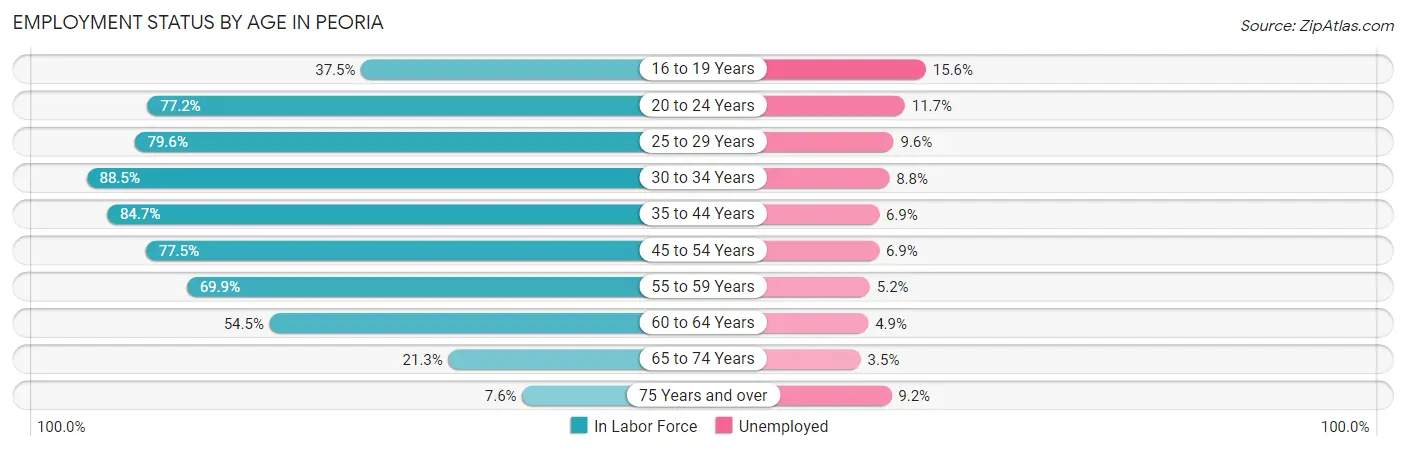
| Age Bracket | In Labor Force | Unemployed |
| 16 to 19 Years | 2,218 (37.5%) | 346 (15.6%) |
| 20 to 24 Years | 6,759 (77.2%) | 791 (11.7%) |
| 25 to 29 Years | 7,053 (79.6%) | 677 (9.6%) |
| 30 to 34 Years | 6,738 (88.5%) | 593 (8.8%) |
| 35 to 44 Years | 11,850 (84.7%) | 818 (6.9%) |
| 45 to 54 Years | 9,373 (77.5%) | 647 (6.9%) |
| 55 to 59 Years | 4,220 (69.9%) | 219 (5.2%) |
| 60 to 64 Years | 3,697 (54.5%) | 181 (4.9%) |
| 65 to 74 Years | 2,240 (21.3%) | 78 (3.5%) |
| 75 Years and over | 617 (7.6%) | 57 (9.2%) |
| Total | 54,802 (61.8%) | 4,384 (8.0%) |
Employment Status by Educational Attainment in Peoria
According to labor force statistics for Peoria, 77.5% of individuals (42,918) out of the total population between 25 and 64 years of age (55,378) are in the labor force, with 7.3% or 3,133 of them being unemployed. The group with the highest labor force participation rate are those with the educational attainment of bachelor's degree or higher, with 85.9% or 19,108 individuals in the labor force. Within the labor force, individuals with less than high school education have the highest percentage of unemployment, with 20.0% or 464 of them being unemployed.
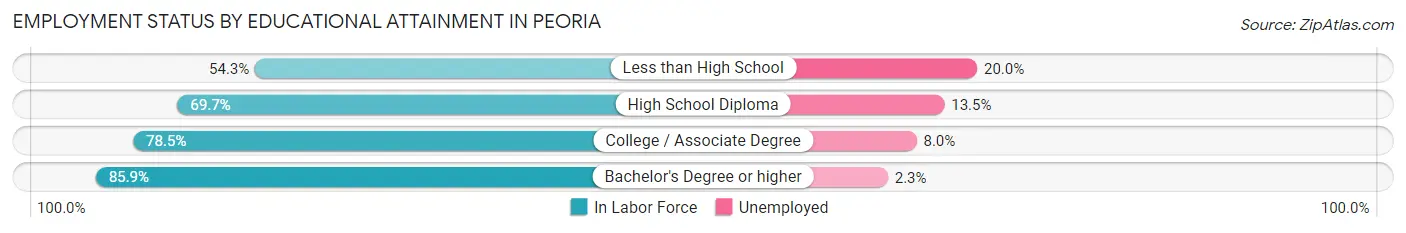
| Educational Attainment | In Labor Force | Unemployed |
| Less than High School | 2,320 (54.3%) | 854 (20.0%) |
| High School Diploma | 9,193 (69.7%) | 1,781 (13.5%) |
| College / Associate Degree | 12,302 (78.5%) | 1,254 (8.0%) |
| Bachelor's Degree or higher | 19,108 (85.9%) | 512 (2.3%) |
| Total | 42,918 (77.5%) | 4,043 (7.3%) |
Employment Occupations by Sex in Peoria
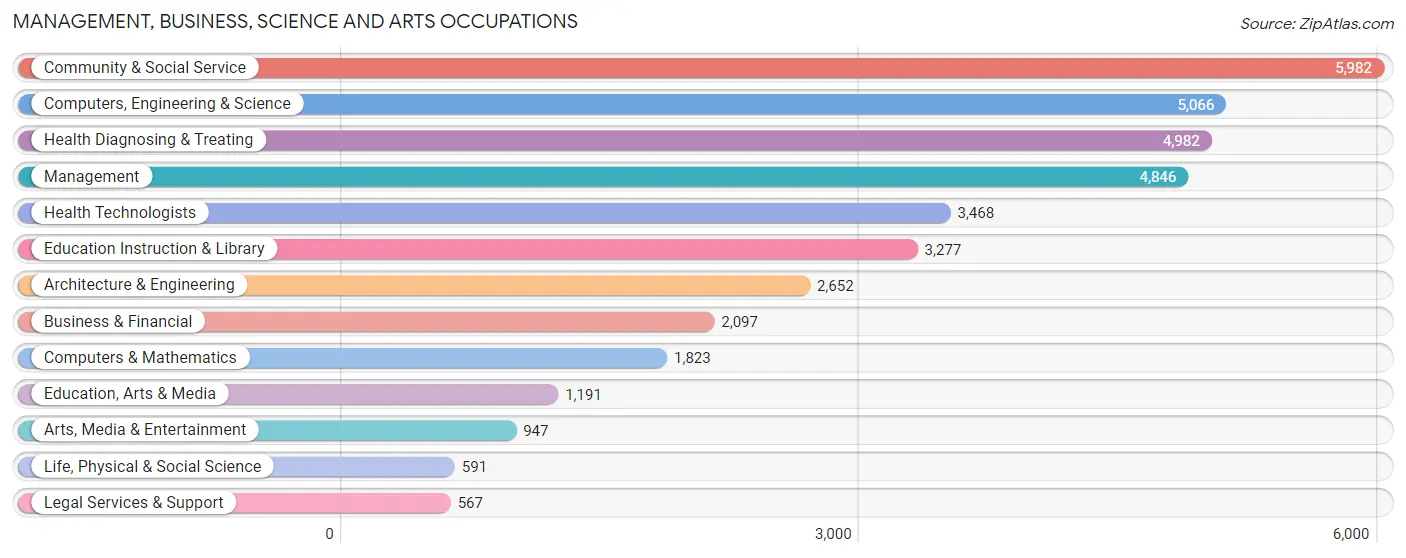
Management, Business, Science and Arts Occupations
The most common Management, Business, Science and Arts occupations in Peoria are Community & Social Service (5,982 | 11.9%), Computers, Engineering & Science (5,066 | 10.1%), Health Diagnosing & Treating (4,982 | 9.9%), Management (4,846 | 9.6%), and Health Technologists (3,468 | 6.9%).
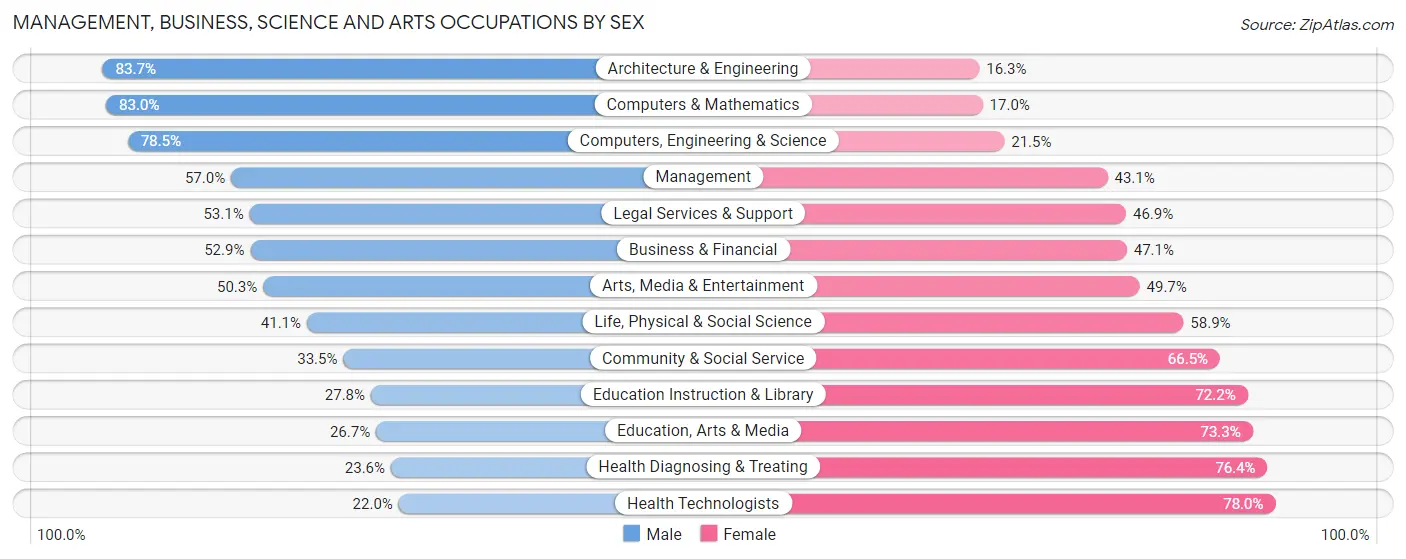
Management, Business, Science and Arts Occupations by Sex
Within the Management, Business, Science and Arts occupations in Peoria, the most male-oriented occupations are Architecture & Engineering (83.7%), Computers & Mathematics (83.0%), and Computers, Engineering & Science (78.5%), while the most female-oriented occupations are Health Technologists (78.0%), Health Diagnosing & Treating (76.4%), and Education, Arts & Media (73.3%).
| Occupation | Male | Female |
| Management | 2,760 (57.0%) | 2,086 (43.0%) |
| Business & Financial | 1,110 (52.9%) | 987 (47.1%) |
| Computers, Engineering & Science | 3,976 (78.5%) | 1,090 (21.5%) |
| Computers & Mathematics | 1,513 (83.0%) | 310 (17.0%) |
| Architecture & Engineering | 2,220 (83.7%) | 432 (16.3%) |
| Life, Physical & Social Science | 243 (41.1%) | 348 (58.9%) |
| Community & Social Service | 2,005 (33.5%) | 3,977 (66.5%) |
| Education, Arts & Media | 318 (26.7%) | 873 (73.3%) |
| Legal Services & Support | 301 (53.1%) | 266 (46.9%) |
| Education Instruction & Library | 910 (27.8%) | 2,367 (72.2%) |
| Arts, Media & Entertainment | 476 (50.3%) | 471 (49.7%) |
| Health Diagnosing & Treating | 1,176 (23.6%) | 3,806 (76.4%) |
| Health Technologists | 762 (22.0%) | 2,706 (78.0%) |
| Total (Category) | 11,027 (48.0%) | 11,946 (52.0%) |
| Total (Overall) | 24,764 (49.3%) | 25,503 (50.7%) |
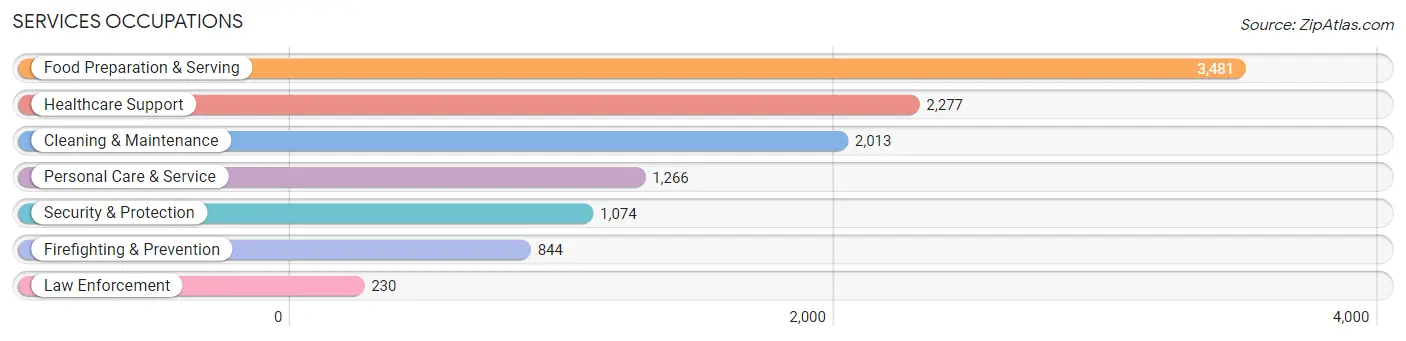
Services Occupations
The most common Services occupations in Peoria are Food Preparation & Serving (3,481 | 6.9%), Healthcare Support (2,277 | 4.5%), Cleaning & Maintenance (2,013 | 4.0%), Personal Care & Service (1,266 | 2.5%), and Security & Protection (1,074 | 2.1%).
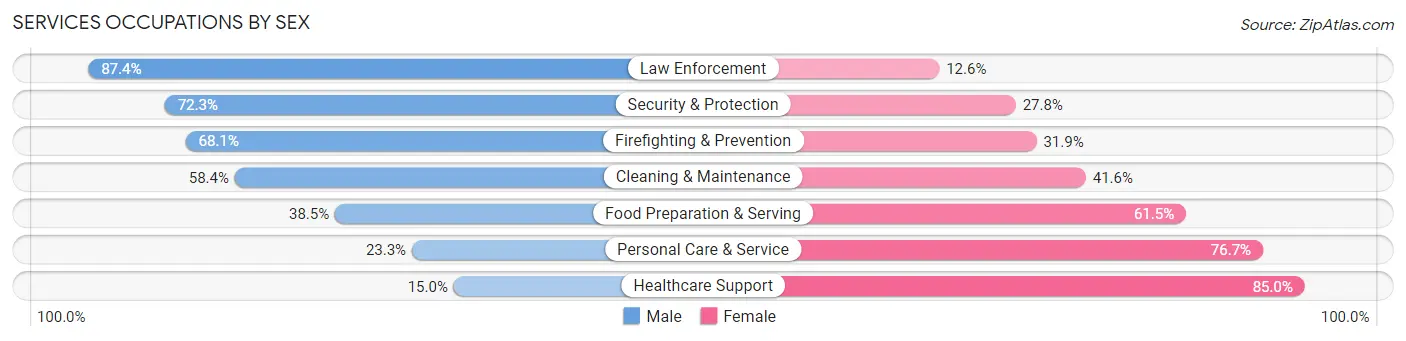
Services Occupations by Sex
Within the Services occupations in Peoria, the most male-oriented occupations are Law Enforcement (87.4%), Security & Protection (72.3%), and Firefighting & Prevention (68.1%), while the most female-oriented occupations are Healthcare Support (85.0%), Personal Care & Service (76.7%), and Food Preparation & Serving (61.5%).
| Occupation | Male | Female |
| Healthcare Support | 342 (15.0%) | 1,935 (85.0%) |
| Security & Protection | 776 (72.3%) | 298 (27.8%) |
| Firefighting & Prevention | 575 (68.1%) | 269 (31.9%) |
| Law Enforcement | 201 (87.4%) | 29 (12.6%) |
| Food Preparation & Serving | 1,341 (38.5%) | 2,140 (61.5%) |
| Cleaning & Maintenance | 1,175 (58.4%) | 838 (41.6%) |
| Personal Care & Service | 295 (23.3%) | 971 (76.7%) |
| Total (Category) | 3,929 (38.9%) | 6,182 (61.1%) |
| Total (Overall) | 24,764 (49.3%) | 25,503 (50.7%) |
Sales and Office Occupations
The most common Sales and Office occupations in Peoria are Office & Administration (4,840 | 9.6%), and Sales & Related (4,083 | 8.1%).

Sales and Office Occupations by Sex
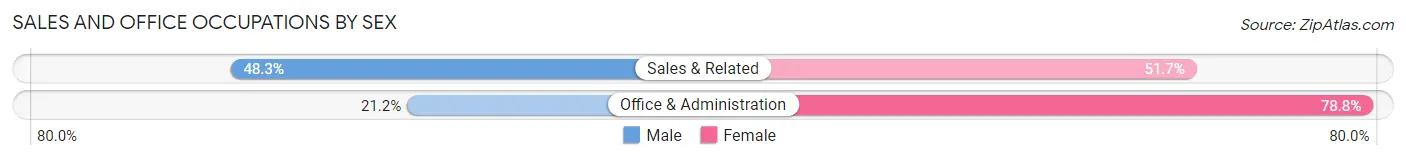
| Occupation | Male | Female |
| Sales & Related | 1,973 (48.3%) | 2,110 (51.7%) |
| Office & Administration | 1,024 (21.2%) | 3,816 (78.8%) |
| Total (Category) | 2,997 (33.6%) | 5,926 (66.4%) |
| Total (Overall) | 24,764 (49.3%) | 25,503 (50.7%) |
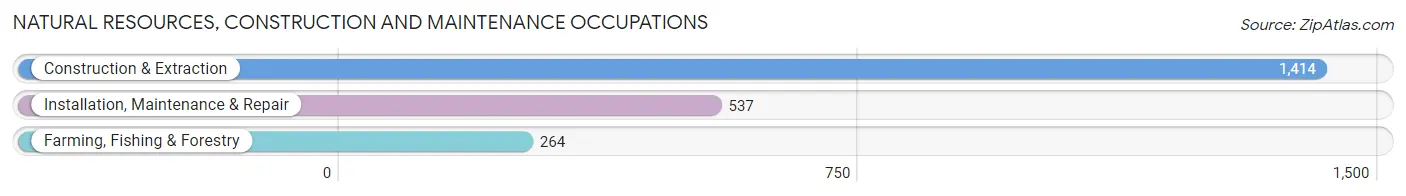
Natural Resources, Construction and Maintenance Occupations
The most common Natural Resources, Construction and Maintenance occupations in Peoria are Construction & Extraction (1,414 | 2.8%), Installation, Maintenance & Repair (537 | 1.1%), and Farming, Fishing & Forestry (264 | 0.5%).
Natural Resources, Construction and Maintenance Occupations by Sex
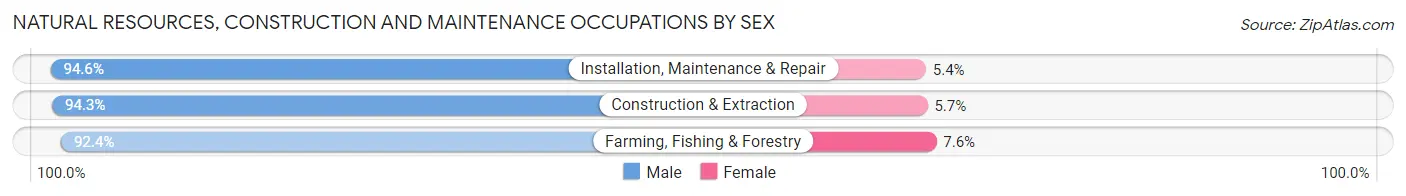
| Occupation | Male | Female |
| Farming, Fishing & Forestry | 244 (92.4%) | 20 (7.6%) |
| Construction & Extraction | 1,333 (94.3%) | 81 (5.7%) |
| Installation, Maintenance & Repair | 508 (94.6%) | 29 (5.4%) |
| Total (Category) | 2,085 (94.1%) | 130 (5.9%) |
| Total (Overall) | 24,764 (49.3%) | 25,503 (50.7%) |
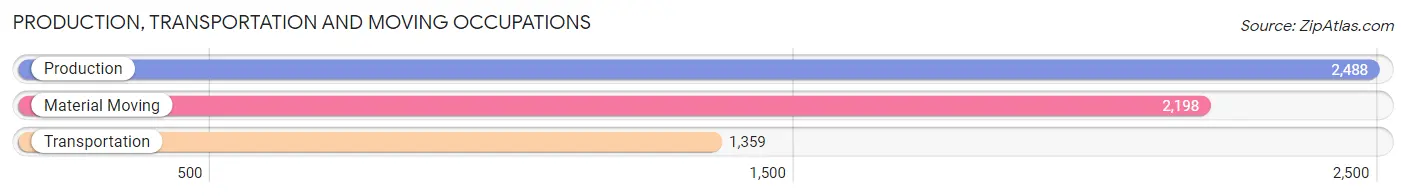
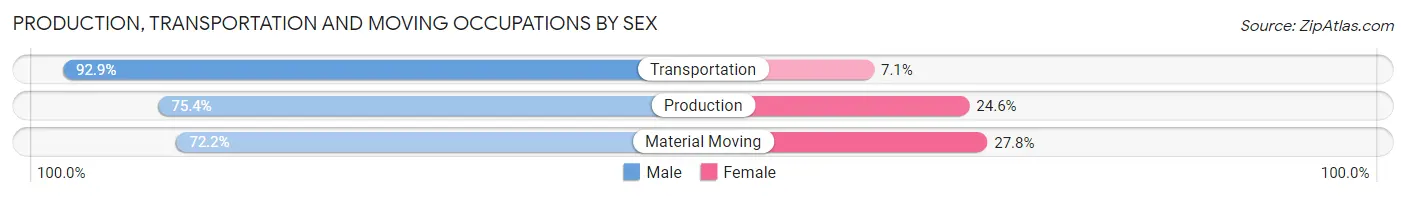
Production, Transportation and Moving Occupations
The most common Production, Transportation and Moving occupations in Peoria are Production (2,488 | 5.0%), Material Moving (2,198 | 4.4%), and Transportation (1,359 | 2.7%).
Production, Transportation and Moving Occupations by Sex
| Occupation | Male | Female |
| Production | 1,877 (75.4%) | 611 (24.6%) |
| Transportation | 1,263 (92.9%) | 96 (7.1%) |
| Material Moving | 1,586 (72.2%) | 612 (27.8%) |
| Total (Category) | 4,726 (78.2%) | 1,319 (21.8%) |
| Total (Overall) | 24,764 (49.3%) | 25,503 (50.7%) |
Employment Industries by Sex in Peoria
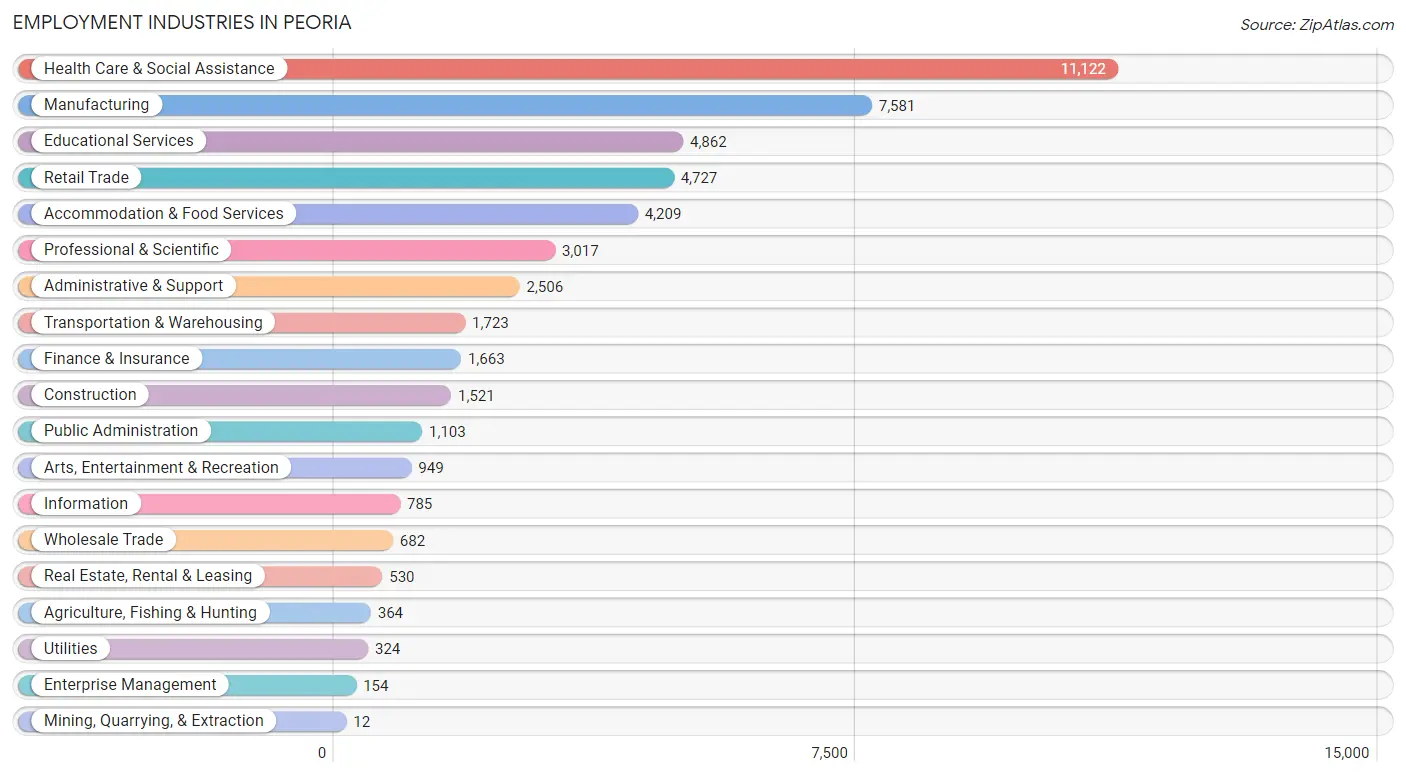
Employment Industries in Peoria
The major employment industries in Peoria include Health Care & Social Assistance (11,122 | 22.1%), Manufacturing (7,581 | 15.1%), Educational Services (4,862 | 9.7%), Retail Trade (4,727 | 9.4%), and Accommodation & Food Services (4,209 | 8.4%).
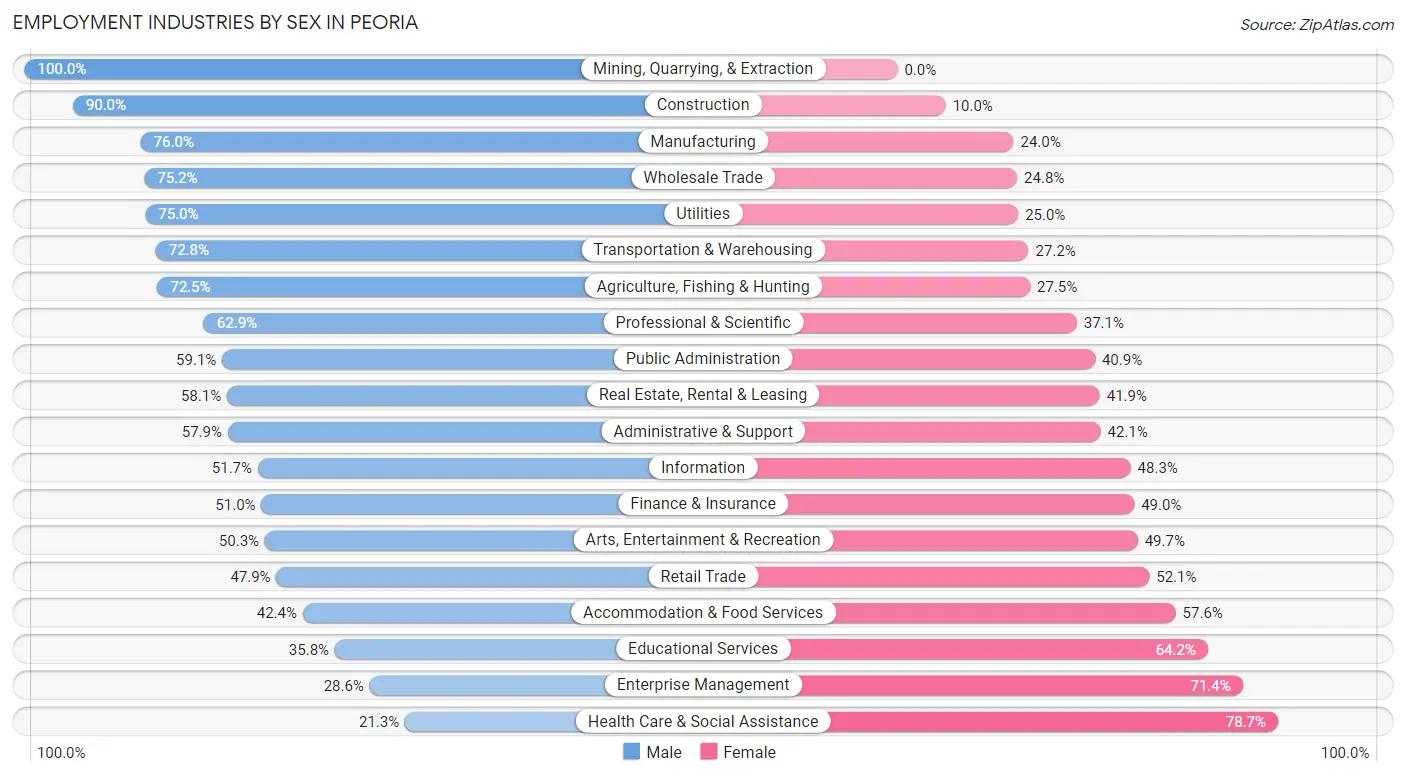
Employment Industries by Sex in Peoria
The Peoria industries that see more men than women are Mining, Quarrying, & Extraction (100.0%), Construction (90.0%), and Manufacturing (76.0%), whereas the industries that tend to have a higher number of women are Health Care & Social Assistance (78.7%), Enterprise Management (71.4%), and Educational Services (64.2%).
| Industry | Male | Female |
| Agriculture, Fishing & Hunting | 264 (72.5%) | 100 (27.5%) |
| Mining, Quarrying, & Extraction | 12 (100.0%) | 0 (0.0%) |
| Construction | 1,369 (90.0%) | 152 (10.0%) |
| Manufacturing | 5,759 (76.0%) | 1,822 (24.0%) |
| Wholesale Trade | 513 (75.2%) | 169 (24.8%) |
| Retail Trade | 2,263 (47.9%) | 2,464 (52.1%) |
| Transportation & Warehousing | 1,255 (72.8%) | 468 (27.2%) |
| Utilities | 243 (75.0%) | 81 (25.0%) |
| Information | 406 (51.7%) | 379 (48.3%) |
| Finance & Insurance | 848 (51.0%) | 815 (49.0%) |
| Real Estate, Rental & Leasing | 308 (58.1%) | 222 (41.9%) |
| Professional & Scientific | 1,897 (62.9%) | 1,120 (37.1%) |
| Enterprise Management | 44 (28.6%) | 110 (71.4%) |
| Administrative & Support | 1,452 (57.9%) | 1,054 (42.1%) |
| Educational Services | 1,739 (35.8%) | 3,123 (64.2%) |
| Health Care & Social Assistance | 2,364 (21.3%) | 8,758 (78.7%) |
| Arts, Entertainment & Recreation | 477 (50.3%) | 472 (49.7%) |
| Accommodation & Food Services | 1,785 (42.4%) | 2,424 (57.6%) |
| Public Administration | 652 (59.1%) | 451 (40.9%) |
| Total | 24,764 (49.3%) | 25,503 (50.7%) |
Education in Peoria
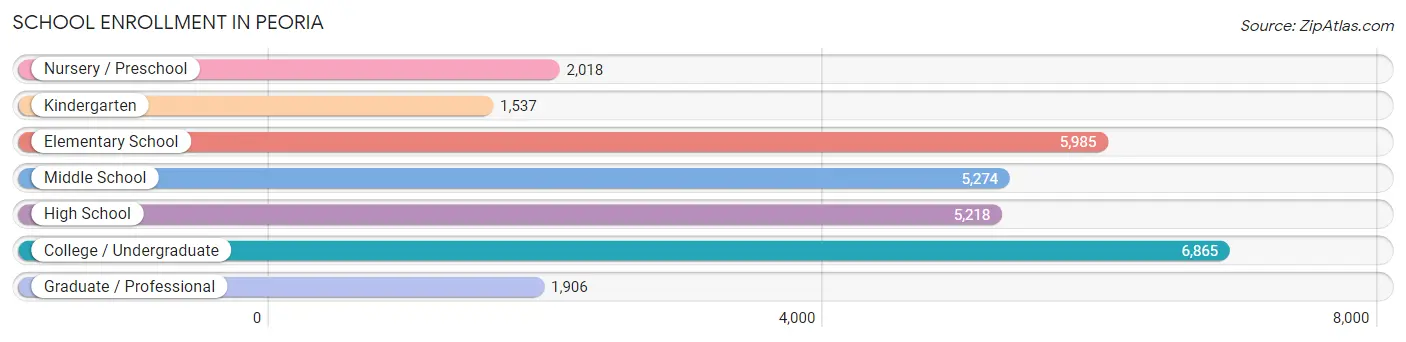
School Enrollment in Peoria
The most common levels of schooling among the 28,803 students in Peoria are college / undergraduate (6,865 | 23.8%), elementary school (5,985 | 20.8%), and middle school (5,274 | 18.3%).
| School Level | # Students | % Students |
| Nursery / Preschool | 2,018 | 7.0% |
| Kindergarten | 1,537 | 5.3% |
| Elementary School | 5,985 | 20.8% |
| Middle School | 5,274 | 18.3% |
| High School | 5,218 | 18.1% |
| College / Undergraduate | 6,865 | 23.8% |
| Graduate / Professional | 1,906 | 6.6% |
| Total | 28,803 | 100.0% |
School Enrollment by Age by Funding Source in Peoria
Out of a total of 28,803 students who are enrolled in schools in Peoria, 7,950 (27.6%) attend a private institution, while the remaining 20,853 (72.4%) are enrolled in public schools. The age group of 20 to 24 year olds has the highest likelihood of being enrolled in private schools, with 1,984 (52.9% in the age bracket) enrolled. Conversely, the age group of 15 to 17 year olds has the lowest likelihood of being enrolled in a private school, with 3,467 (90.3% in the age bracket) attending a public institution.
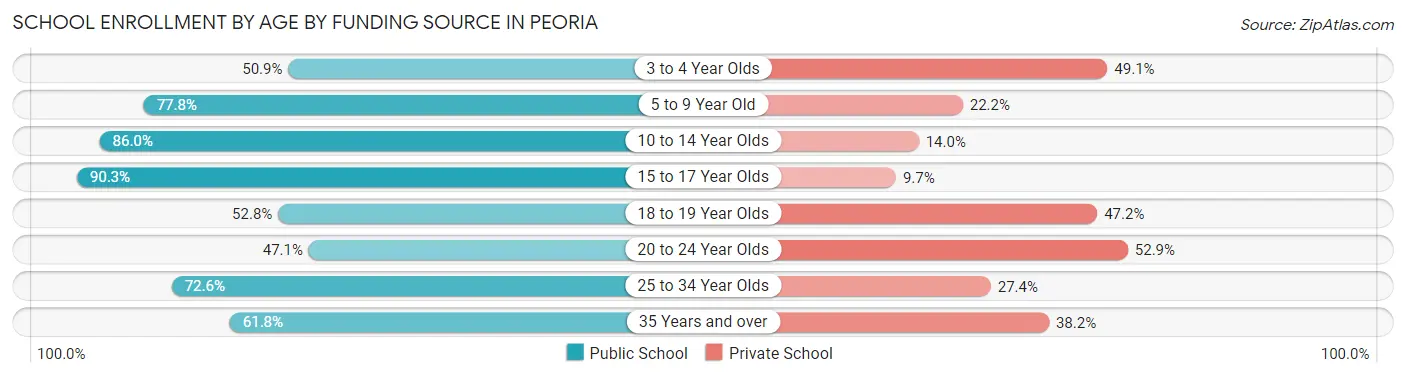
| Age Bracket | Public School | Private School |
| 3 to 4 Year Olds | 814 (50.9%) | 786 (49.1%) |
| 5 to 9 Year Old | 5,866 (77.8%) | 1,673 (22.2%) |
| 10 to 14 Year Olds | 5,284 (86.0%) | 859 (14.0%) |
| 15 to 17 Year Olds | 3,467 (90.3%) | 374 (9.7%) |
| 18 to 19 Year Olds | 1,326 (52.8%) | 1,187 (47.2%) |
| 20 to 24 Year Olds | 1,764 (47.1%) | 1,984 (52.9%) |
| 25 to 34 Year Olds | 1,417 (72.6%) | 535 (27.4%) |
| 35 Years and over | 906 (61.8%) | 561 (38.2%) |
| Total | 20,853 (72.4%) | 7,950 (27.6%) |
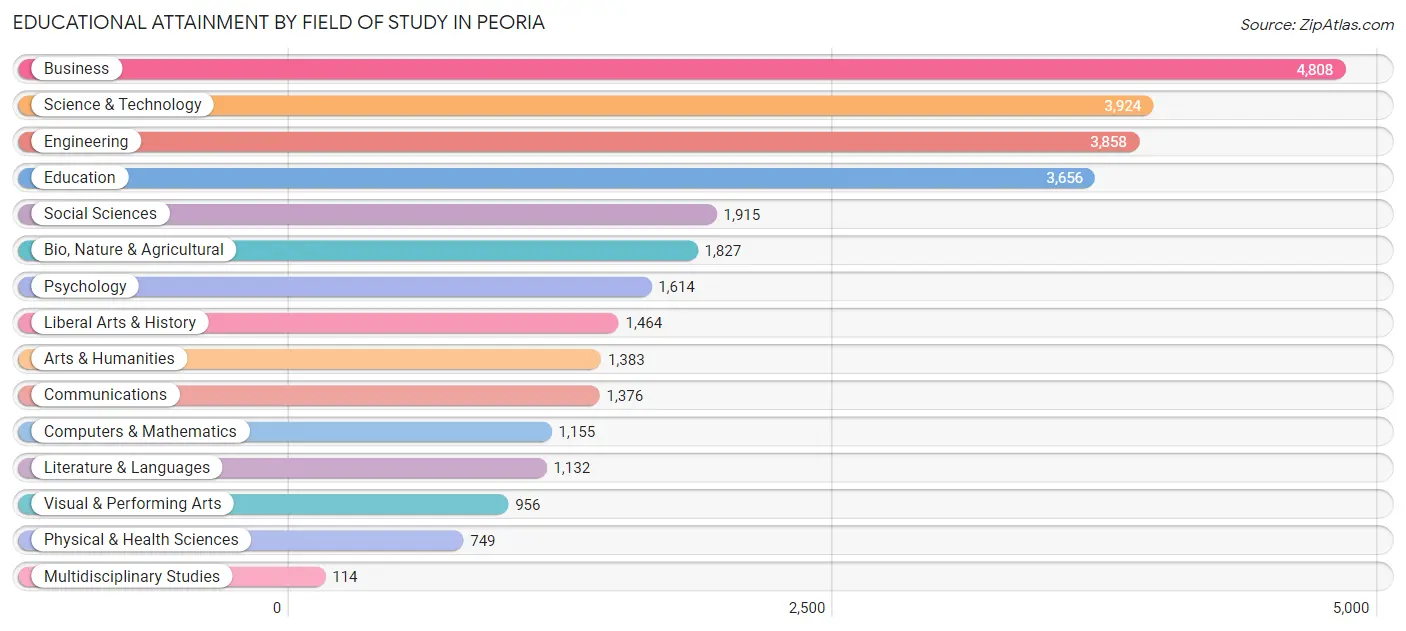
Educational Attainment by Field of Study in Peoria
Business (4,808 | 16.1%), science & technology (3,924 | 13.1%), engineering (3,858 | 12.9%), education (3,656 | 12.2%), and social sciences (1,915 | 6.4%) are the most common fields of study among 29,931 individuals in Peoria who have obtained a bachelor's degree or higher.
| Field of Study | # Graduates | % Graduates |
| Computers & Mathematics | 1,155 | 3.9% |
| Bio, Nature & Agricultural | 1,827 | 6.1% |
| Physical & Health Sciences | 749 | 2.5% |
| Psychology | 1,614 | 5.4% |
| Social Sciences | 1,915 | 6.4% |
| Engineering | 3,858 | 12.9% |
| Multidisciplinary Studies | 114 | 0.4% |
| Science & Technology | 3,924 | 13.1% |
| Business | 4,808 | 16.1% |
| Education | 3,656 | 12.2% |
| Literature & Languages | 1,132 | 3.8% |
| Liberal Arts & History | 1,464 | 4.9% |
| Visual & Performing Arts | 956 | 3.2% |
| Communications | 1,376 | 4.6% |
| Arts & Humanities | 1,383 | 4.6% |
| Total | 29,931 | 100.0% |
Transportation & Commute in Peoria
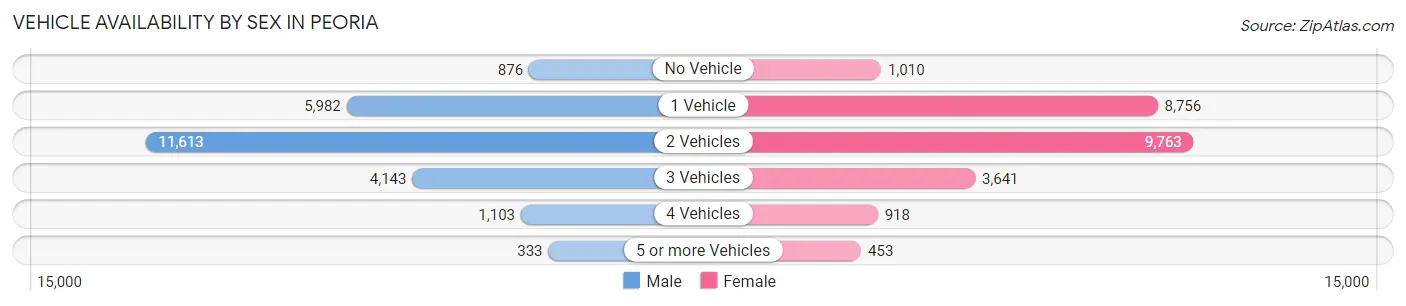
Vehicle Availability by Sex in Peoria
The most prevalent vehicle ownership categories in Peoria are males with 2 vehicles (11,613, accounting for 48.3%) and females with 2 vehicles (9,763, making up 47.3%).
| Vehicles Available | Male | Female |
| No Vehicle | 876 (3.6%) | 1,010 (4.1%) |
| 1 Vehicle | 5,982 (24.9%) | 8,756 (35.7%) |
| 2 Vehicles | 11,613 (48.3%) | 9,763 (39.8%) |
| 3 Vehicles | 4,143 (17.2%) | 3,641 (14.8%) |
| 4 Vehicles | 1,103 (4.6%) | 918 (3.7%) |
| 5 or more Vehicles | 333 (1.4%) | 453 (1.8%) |
| Total | 24,050 (100.0%) | 24,541 (100.0%) |
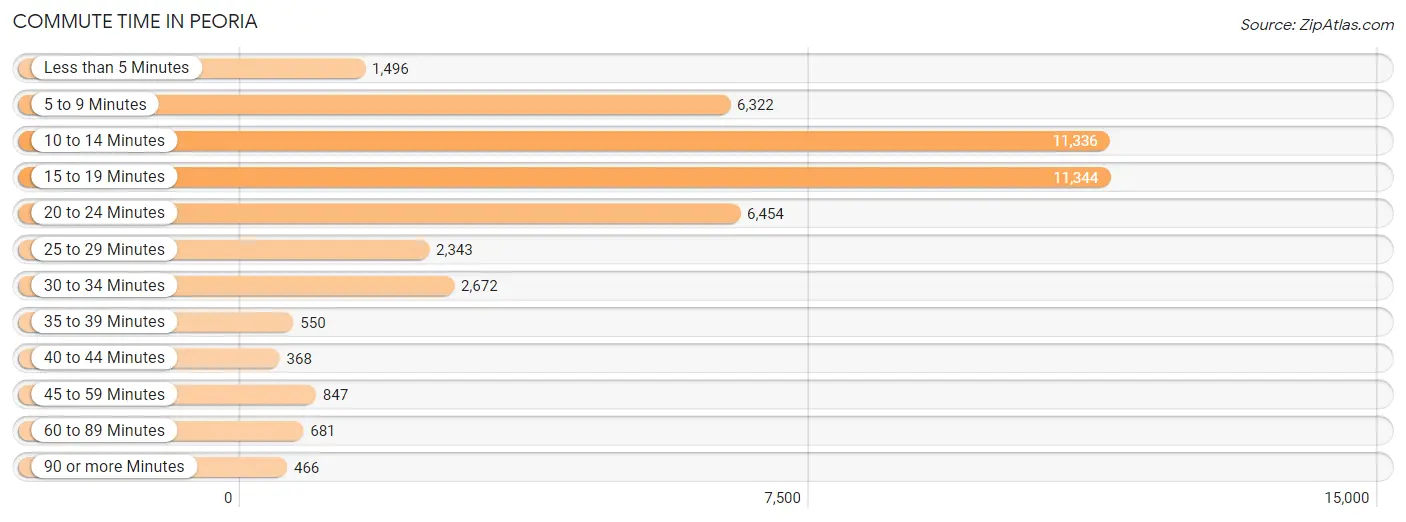
Commute Time in Peoria
The most frequently occuring commute durations in Peoria are 15 to 19 minutes (11,344 commuters, 25.3%), 10 to 14 minutes (11,336 commuters, 25.3%), and 20 to 24 minutes (6,454 commuters, 14.4%).
| Commute Time | # Commuters | % Commuters |
| Less than 5 Minutes | 1,496 | 3.3% |
| 5 to 9 Minutes | 6,322 | 14.1% |
| 10 to 14 Minutes | 11,336 | 25.3% |
| 15 to 19 Minutes | 11,344 | 25.3% |
| 20 to 24 Minutes | 6,454 | 14.4% |
| 25 to 29 Minutes | 2,343 | 5.2% |
| 30 to 34 Minutes | 2,672 | 5.9% |
| 35 to 39 Minutes | 550 | 1.2% |
| 40 to 44 Minutes | 368 | 0.8% |
| 45 to 59 Minutes | 847 | 1.9% |
| 60 to 89 Minutes | 681 | 1.5% |
| 90 or more Minutes | 466 | 1.0% |
Commute Time by Sex in Peoria
The most common commute times in Peoria are 15 to 19 minutes (6,019 commuters, 27.3%) for males and 10 to 14 minutes (6,248 commuters, 27.4%) for females.
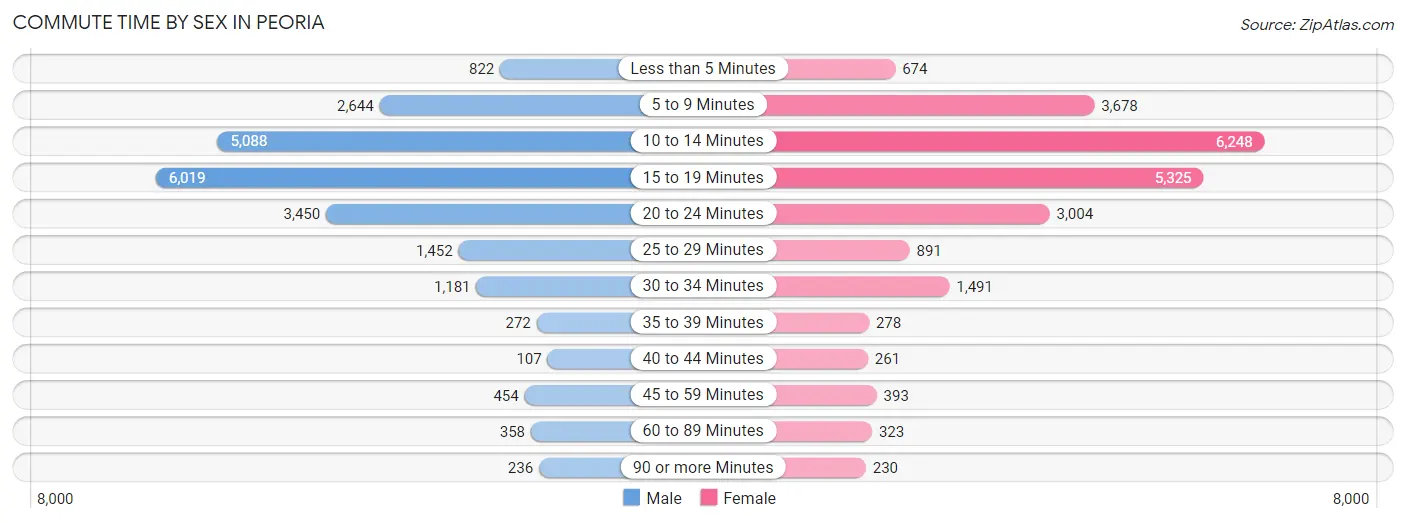
| Commute Time | Male | Female |
| Less than 5 Minutes | 822 (3.7%) | 674 (3.0%) |
| 5 to 9 Minutes | 2,644 (12.0%) | 3,678 (16.1%) |
| 10 to 14 Minutes | 5,088 (23.0%) | 6,248 (27.4%) |
| 15 to 19 Minutes | 6,019 (27.3%) | 5,325 (23.4%) |
| 20 to 24 Minutes | 3,450 (15.6%) | 3,004 (13.2%) |
| 25 to 29 Minutes | 1,452 (6.6%) | 891 (3.9%) |
| 30 to 34 Minutes | 1,181 (5.3%) | 1,491 (6.5%) |
| 35 to 39 Minutes | 272 (1.2%) | 278 (1.2%) |
| 40 to 44 Minutes | 107 (0.5%) | 261 (1.1%) |
| 45 to 59 Minutes | 454 (2.1%) | 393 (1.7%) |
| 60 to 89 Minutes | 358 (1.6%) | 323 (1.4%) |
| 90 or more Minutes | 236 (1.1%) | 230 (1.0%) |
Time of Departure to Work by Sex in Peoria
The most frequent times of departure to work in Peoria are 7:30 AM to 7:59 AM (2,894, 13.1%) for males and 7:30 AM to 7:59 AM (3,284, 14.4%) for females.
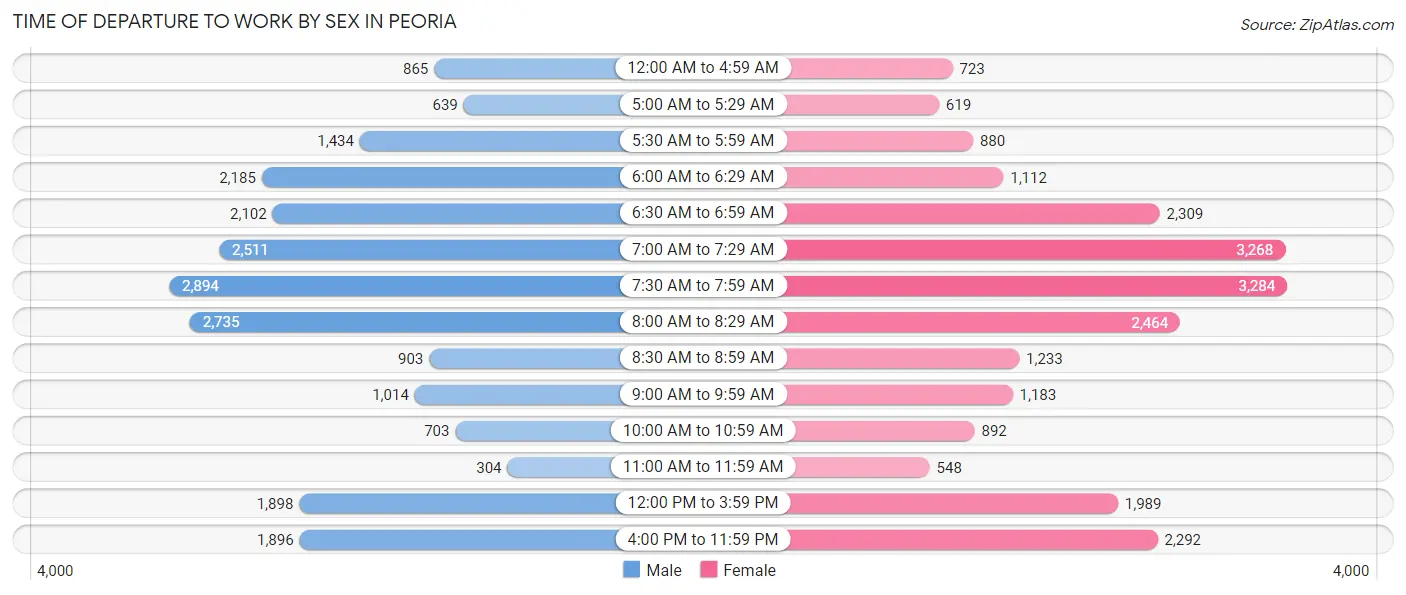
| Time of Departure | Male | Female |
| 12:00 AM to 4:59 AM | 865 (3.9%) | 723 (3.2%) |
| 5:00 AM to 5:29 AM | 639 (2.9%) | 619 (2.7%) |
| 5:30 AM to 5:59 AM | 1,434 (6.5%) | 880 (3.9%) |
| 6:00 AM to 6:29 AM | 2,185 (9.9%) | 1,112 (4.9%) |
| 6:30 AM to 6:59 AM | 2,102 (9.5%) | 2,309 (10.1%) |
| 7:00 AM to 7:29 AM | 2,511 (11.4%) | 3,268 (14.3%) |
| 7:30 AM to 7:59 AM | 2,894 (13.1%) | 3,284 (14.4%) |
| 8:00 AM to 8:29 AM | 2,735 (12.4%) | 2,464 (10.8%) |
| 8:30 AM to 8:59 AM | 903 (4.1%) | 1,233 (5.4%) |
| 9:00 AM to 9:59 AM | 1,014 (4.6%) | 1,183 (5.2%) |
| 10:00 AM to 10:59 AM | 703 (3.2%) | 892 (3.9%) |
| 11:00 AM to 11:59 AM | 304 (1.4%) | 548 (2.4%) |
| 12:00 PM to 3:59 PM | 1,898 (8.6%) | 1,989 (8.7%) |
| 4:00 PM to 11:59 PM | 1,896 (8.6%) | 2,292 (10.1%) |
| Total | 22,083 (100.0%) | 22,796 (100.0%) |
Housing Occupancy in Peoria
Occupancy by Ownership in Peoria
Of the total 48,542 dwellings in Peoria, owner-occupied units account for 27,316 (56.3%), while renter-occupied units make up 21,226 (43.7%).
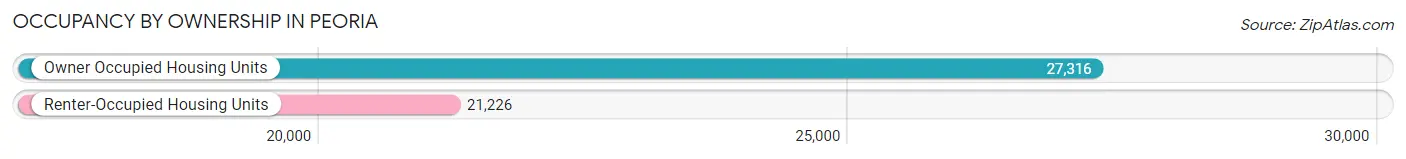
| Occupancy | # Housing Units | % Housing Units |
| Owner Occupied Housing Units | 27,316 | 56.3% |
| Renter-Occupied Housing Units | 21,226 | 43.7% |
| Total Occupied Housing Units | 48,542 | 100.0% |
Occupancy by Household Size in Peoria
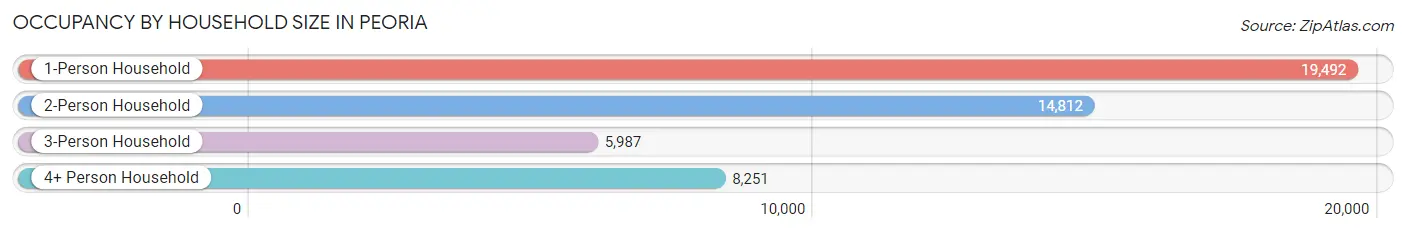
| Household Size | # Housing Units | % Housing Units |
| 1-Person Household | 19,492 | 40.2% |
| 2-Person Household | 14,812 | 30.5% |
| 3-Person Household | 5,987 | 12.3% |
| 4+ Person Household | 8,251 | 17.0% |
| Total Housing Units | 48,542 | 100.0% |
Occupancy by Ownership by Household Size in Peoria
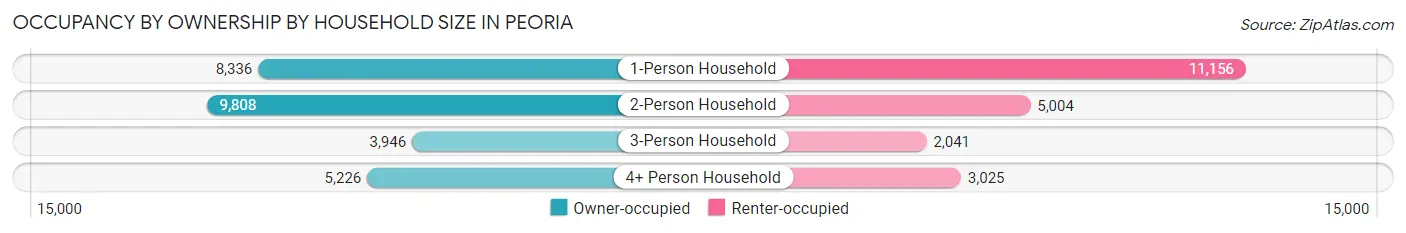
| Household Size | Owner-occupied | Renter-occupied |
| 1-Person Household | 8,336 (42.8%) | 11,156 (57.2%) |
| 2-Person Household | 9,808 (66.2%) | 5,004 (33.8%) |
| 3-Person Household | 3,946 (65.9%) | 2,041 (34.1%) |
| 4+ Person Household | 5,226 (63.3%) | 3,025 (36.7%) |
| Total Housing Units | 27,316 (56.3%) | 21,226 (43.7%) |
Occupancy by Educational Attainment in Peoria
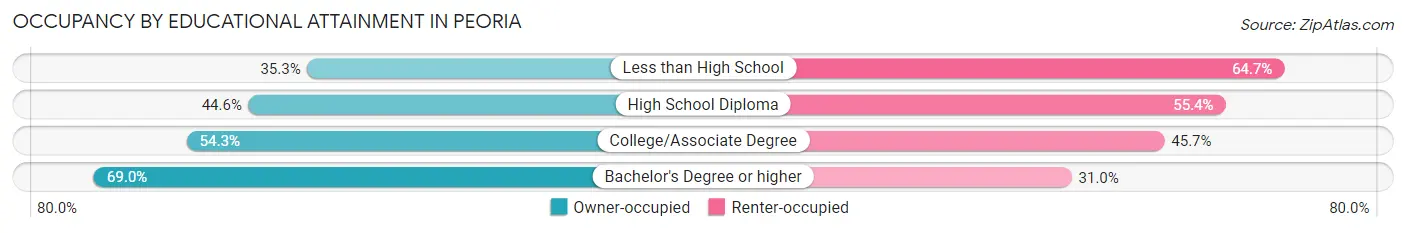
| Household Size | Owner-occupied | Renter-occupied |
| Less than High School | 1,394 (35.3%) | 2,556 (64.7%) |
| High School Diploma | 4,727 (44.6%) | 5,869 (55.4%) |
| College/Associate Degree | 8,356 (54.3%) | 7,034 (45.7%) |
| Bachelor's Degree or higher | 12,839 (69.0%) | 5,767 (31.0%) |
Occupancy by Age of Householder in Peoria
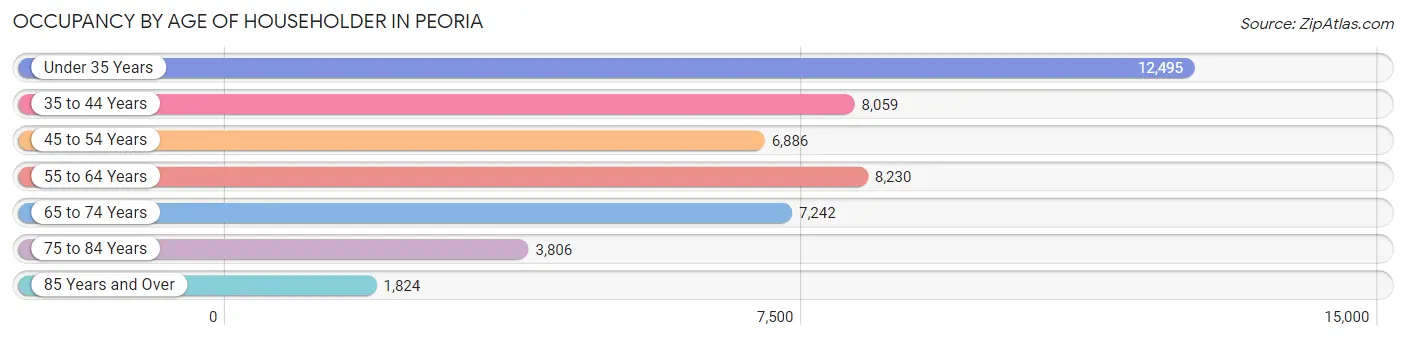
| Age Bracket | # Households | % Households |
| Under 35 Years | 12,495 | 25.7% |
| 35 to 44 Years | 8,059 | 16.6% |
| 45 to 54 Years | 6,886 | 14.2% |
| 55 to 64 Years | 8,230 | 17.0% |
| 65 to 74 Years | 7,242 | 14.9% |
| 75 to 84 Years | 3,806 | 7.8% |
| 85 Years and Over | 1,824 | 3.8% |
| Total | 48,542 | 100.0% |
Housing Finances in Peoria
Median Income by Occupancy in Peoria
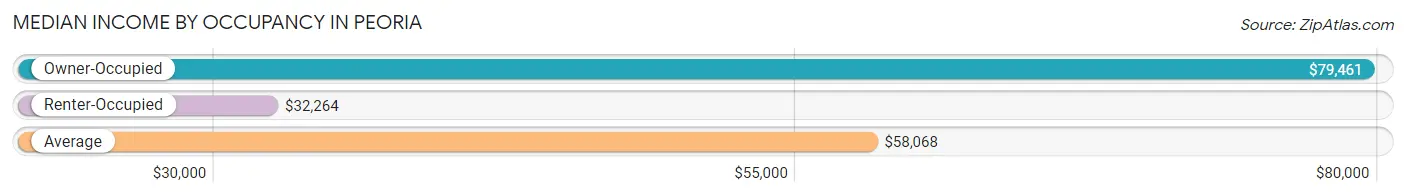
| Occupancy Type | # Households | Median Income |
| Owner-Occupied | 27,316 (56.3%) | $79,461 |
| Renter-Occupied | 21,226 (43.7%) | $32,264 |
| Average | 48,542 (100.0%) | $58,068 |
Occupancy by Householder Income Bracket in Peoria
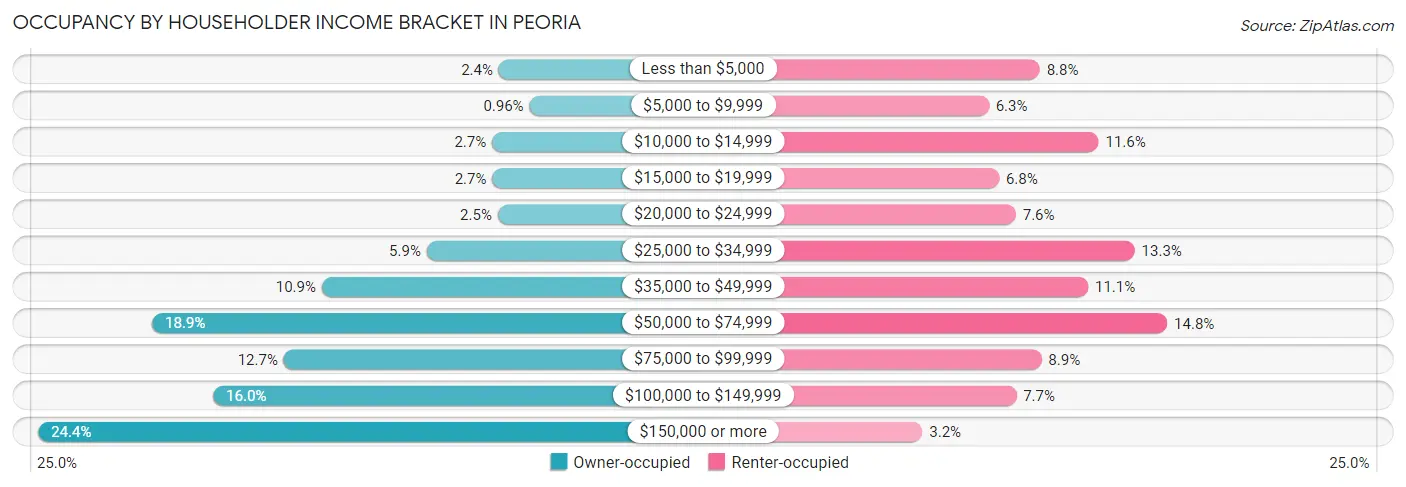
| Income Bracket | Owner-occupied | Renter-occupied |
| Less than $5,000 | 662 (2.4%) | 1,861 (8.8%) |
| $5,000 to $9,999 | 263 (1.0%) | 1,345 (6.3%) |
| $10,000 to $14,999 | 749 (2.7%) | 2,455 (11.6%) |
| $15,000 to $19,999 | 747 (2.7%) | 1,449 (6.8%) |
| $20,000 to $24,999 | 676 (2.5%) | 1,619 (7.6%) |
| $25,000 to $34,999 | 1,598 (5.9%) | 2,820 (13.3%) |
| $35,000 to $49,999 | 2,964 (10.8%) | 2,350 (11.1%) |
| $50,000 to $74,999 | 5,170 (18.9%) | 3,149 (14.8%) |
| $75,000 to $99,999 | 3,458 (12.7%) | 1,879 (8.8%) |
| $100,000 to $149,999 | 4,375 (16.0%) | 1,624 (7.6%) |
| $150,000 or more | 6,654 (24.4%) | 675 (3.2%) |
| Total | 27,316 (100.0%) | 21,226 (100.0%) |
Monthly Housing Cost Tiers in Peoria
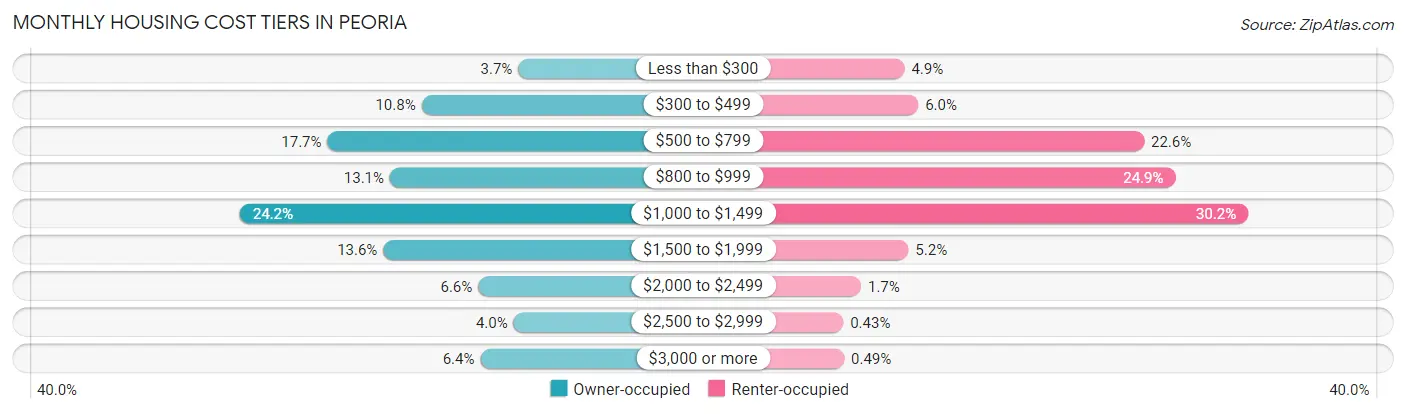
| Monthly Cost | Owner-occupied | Renter-occupied |
| Less than $300 | 997 (3.6%) | 1,049 (4.9%) |
| $300 to $499 | 2,943 (10.8%) | 1,262 (5.9%) |
| $500 to $799 | 4,834 (17.7%) | 4,793 (22.6%) |
| $800 to $999 | 3,578 (13.1%) | 5,281 (24.9%) |
| $1,000 to $1,499 | 6,598 (24.1%) | 6,418 (30.2%) |
| $1,500 to $1,999 | 3,712 (13.6%) | 1,110 (5.2%) |
| $2,000 to $2,499 | 1,803 (6.6%) | 369 (1.7%) |
| $2,500 to $2,999 | 1,091 (4.0%) | 92 (0.4%) |
| $3,000 or more | 1,760 (6.4%) | 105 (0.5%) |
| Total | 27,316 (100.0%) | 21,226 (100.0%) |
Physical Housing Characteristics in Peoria
Housing Structures in Peoria
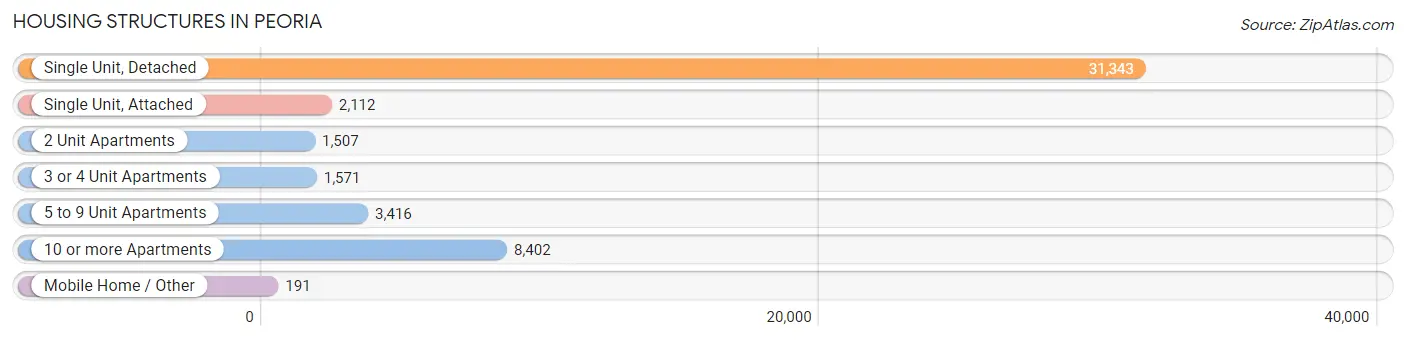
| Structure Type | # Housing Units | % Housing Units |
| Single Unit, Detached | 31,343 | 64.6% |
| Single Unit, Attached | 2,112 | 4.3% |
| 2 Unit Apartments | 1,507 | 3.1% |
| 3 or 4 Unit Apartments | 1,571 | 3.2% |
| 5 to 9 Unit Apartments | 3,416 | 7.0% |
| 10 or more Apartments | 8,402 | 17.3% |
| Mobile Home / Other | 191 | 0.4% |
| Total | 48,542 | 100.0% |
Housing Structures by Occupancy in Peoria
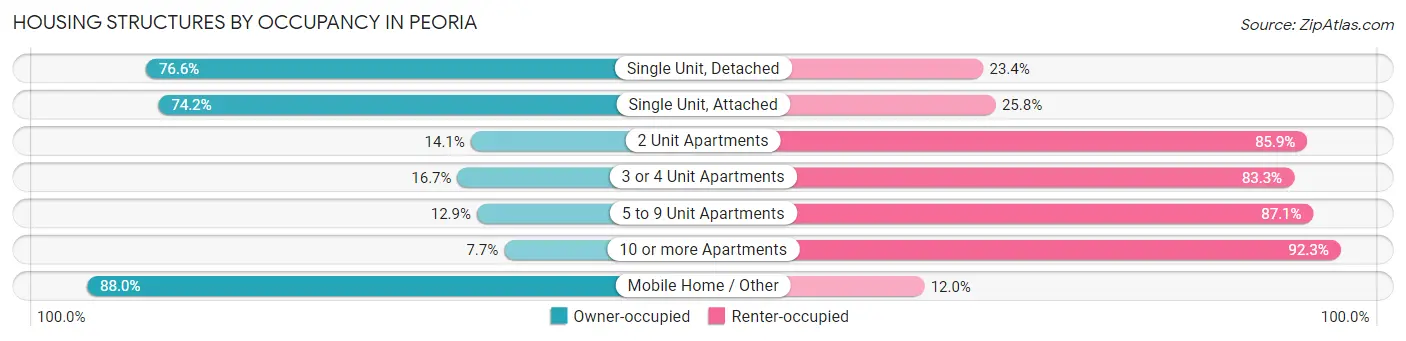
| Structure Type | Owner-occupied | Renter-occupied |
| Single Unit, Detached | 24,017 (76.6%) | 7,326 (23.4%) |
| Single Unit, Attached | 1,568 (74.2%) | 544 (25.8%) |
| 2 Unit Apartments | 213 (14.1%) | 1,294 (85.9%) |
| 3 or 4 Unit Apartments | 262 (16.7%) | 1,309 (83.3%) |
| 5 to 9 Unit Apartments | 442 (12.9%) | 2,974 (87.1%) |
| 10 or more Apartments | 646 (7.7%) | 7,756 (92.3%) |
| Mobile Home / Other | 168 (88.0%) | 23 (12.0%) |
| Total | 27,316 (56.3%) | 21,226 (43.7%) |
Housing Structures by Number of Rooms in Peoria
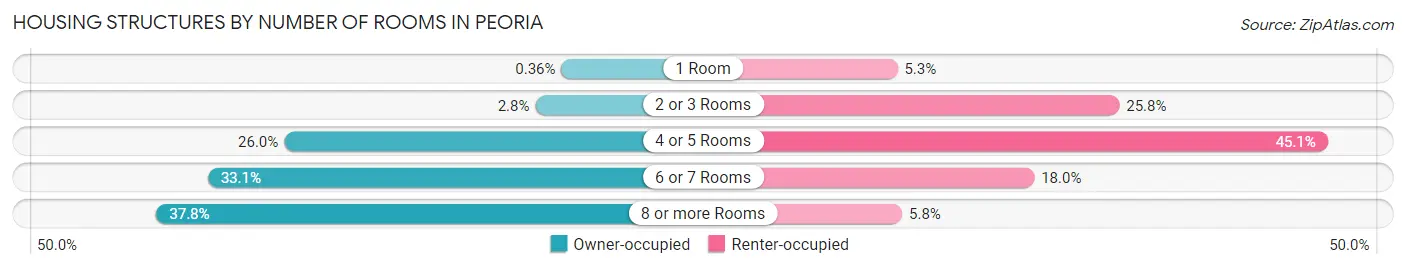
| Number of Rooms | Owner-occupied | Renter-occupied |
| 1 Room | 98 (0.4%) | 1,130 (5.3%) |
| 2 or 3 Rooms | 756 (2.8%) | 5,485 (25.8%) |
| 4 or 5 Rooms | 7,102 (26.0%) | 9,576 (45.1%) |
| 6 or 7 Rooms | 9,031 (33.1%) | 3,815 (18.0%) |
| 8 or more Rooms | 10,329 (37.8%) | 1,220 (5.8%) |
| Total | 27,316 (100.0%) | 21,226 (100.0%) |
Housing Structure by Heating Type in Peoria
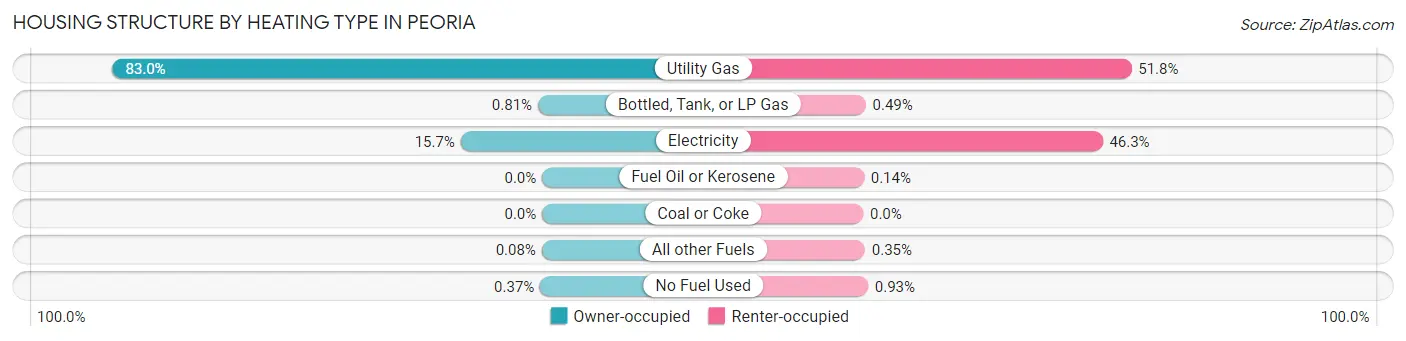
| Heating Type | Owner-occupied | Renter-occupied |
| Utility Gas | 22,677 (83.0%) | 11,002 (51.8%) |
| Bottled, Tank, or LP Gas | 221 (0.8%) | 105 (0.5%) |
| Electricity | 4,296 (15.7%) | 9,819 (46.3%) |
| Fuel Oil or Kerosene | 0 (0.0%) | 29 (0.1%) |
| Coal or Coke | 0 (0.0%) | 0 (0.0%) |
| All other Fuels | 21 (0.1%) | 74 (0.4%) |
| No Fuel Used | 101 (0.4%) | 197 (0.9%) |
| Total | 27,316 (100.0%) | 21,226 (100.0%) |
Household Vehicle Usage in Peoria
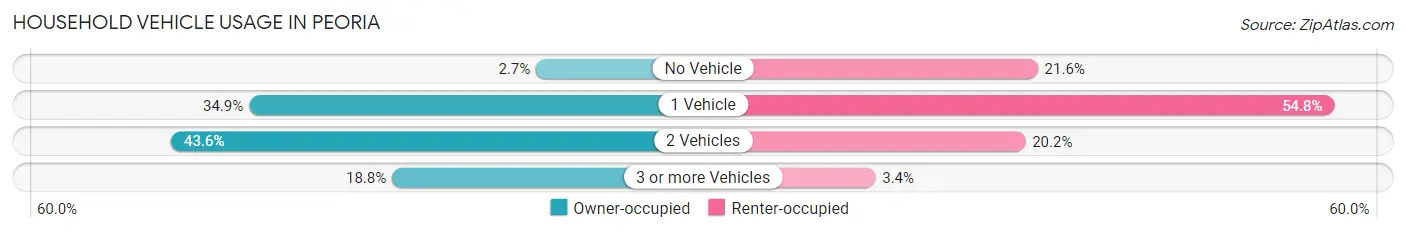
| Vehicles per Household | Owner-occupied | Renter-occupied |
| No Vehicle | 741 (2.7%) | 4,583 (21.6%) |
| 1 Vehicle | 9,522 (34.9%) | 11,634 (54.8%) |
| 2 Vehicles | 11,908 (43.6%) | 4,288 (20.2%) |
| 3 or more Vehicles | 5,145 (18.8%) | 721 (3.4%) |
| Total | 27,316 (100.0%) | 21,226 (100.0%) |
Real Estate & Mortgages in Peoria
Real Estate and Mortgage Overview in Peoria
| Characteristic | Without Mortgage | With Mortgage |
| Housing Units | 10,345 | 16,971 |
| Median Property Value | $136,100 | $152,300 |
| Median Household Income | $61,367 | $4,936 |
| Monthly Housing Costs | $622 | $1,752 |
| Real Estate Taxes | $3,090 | $116 |
Property Value by Mortgage Status in Peoria
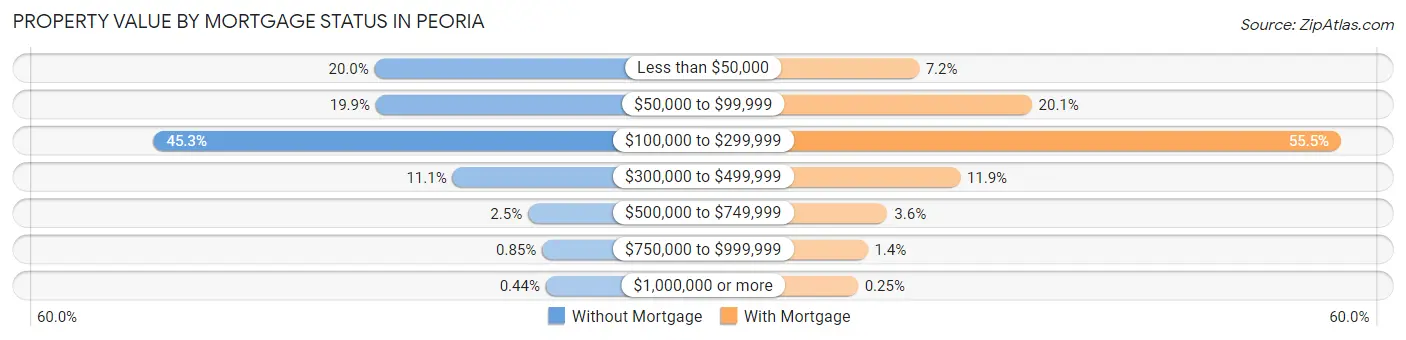
| Property Value | Without Mortgage | With Mortgage |
| Less than $50,000 | 2,070 (20.0%) | 1,226 (7.2%) |
| $50,000 to $99,999 | 2,055 (19.9%) | 3,415 (20.1%) |
| $100,000 to $299,999 | 4,682 (45.3%) | 9,414 (55.5%) |
| $300,000 to $499,999 | 1,148 (11.1%) | 2,025 (11.9%) |
| $500,000 to $749,999 | 256 (2.5%) | 618 (3.6%) |
| $750,000 to $999,999 | 88 (0.9%) | 231 (1.4%) |
| $1,000,000 or more | 46 (0.4%) | 42 (0.3%) |
| Total | 10,345 (100.0%) | 16,971 (100.0%) |
Household Income by Mortgage Status in Peoria
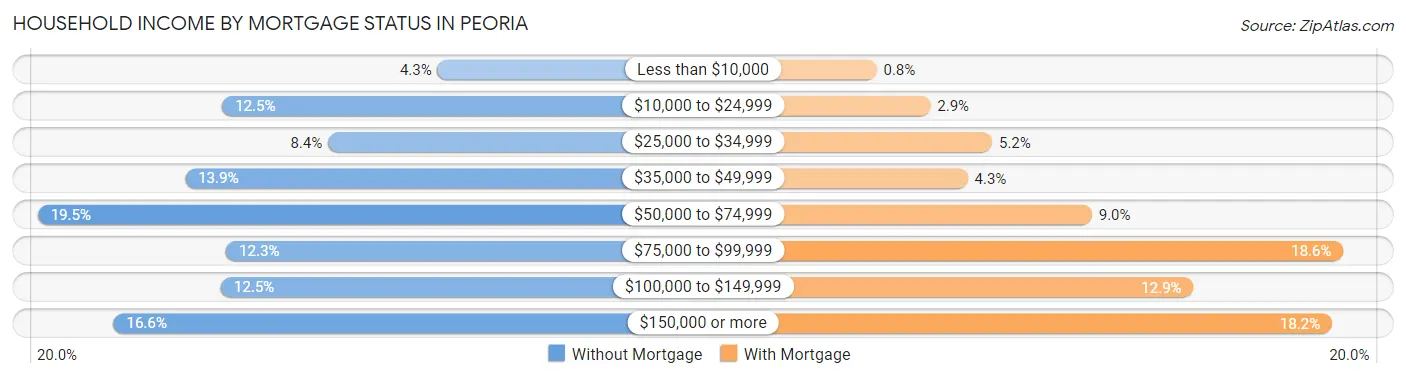
| Household Income | Without Mortgage | With Mortgage |
| Less than $10,000 | 442 (4.3%) | 136 (0.8%) |
| $10,000 to $24,999 | 1,290 (12.5%) | 483 (2.9%) |
| $25,000 to $34,999 | 873 (8.4%) | 882 (5.2%) |
| $35,000 to $49,999 | 1,436 (13.9%) | 725 (4.3%) |
| $50,000 to $74,999 | 2,017 (19.5%) | 1,528 (9.0%) |
| $75,000 to $99,999 | 1,274 (12.3%) | 3,153 (18.6%) |
| $100,000 to $149,999 | 1,295 (12.5%) | 2,184 (12.9%) |
| $150,000 or more | 1,718 (16.6%) | 3,080 (18.1%) |
| Total | 10,345 (100.0%) | 16,971 (100.0%) |
Property Value to Household Income Ratio in Peoria
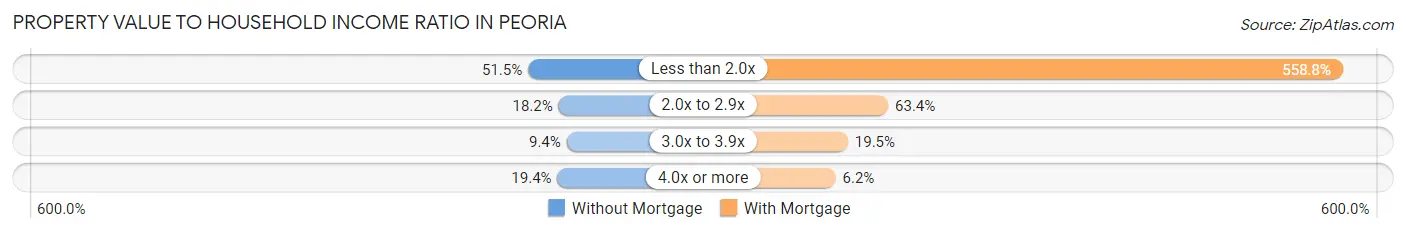
| Value-to-Income Ratio | Without Mortgage | With Mortgage |
| Less than 2.0x | 5,324 (51.5%) | 94,841 (558.8%) |
| 2.0x to 2.9x | 1,879 (18.2%) | 10,762 (63.4%) |
| 3.0x to 3.9x | 969 (9.4%) | 3,315 (19.5%) |
| 4.0x or more | 2,008 (19.4%) | 1,048 (6.2%) |
| Total | 10,345 (100.0%) | 16,971 (100.0%) |
Real Estate Taxes by Mortgage Status in Peoria
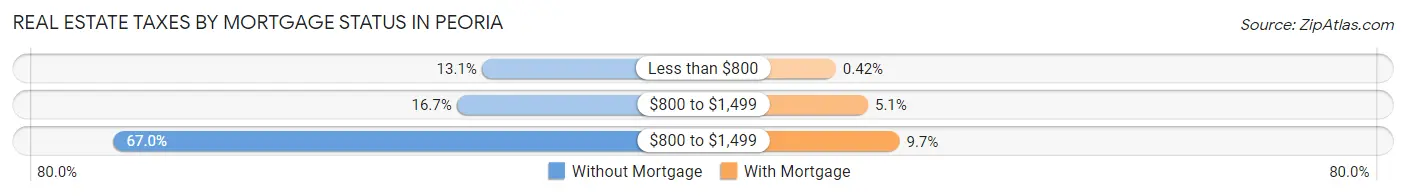
| Property Taxes | Without Mortgage | With Mortgage |
| Less than $800 | 1,352 (13.1%) | 71 (0.4%) |
| $800 to $1,499 | 1,732 (16.7%) | 868 (5.1%) |
| $800 to $1,499 | 6,929 (67.0%) | 1,649 (9.7%) |
| Total | 10,345 (100.0%) | 16,971 (100.0%) |
Health & Disability in Peoria
Health Insurance Coverage by Age in Peoria
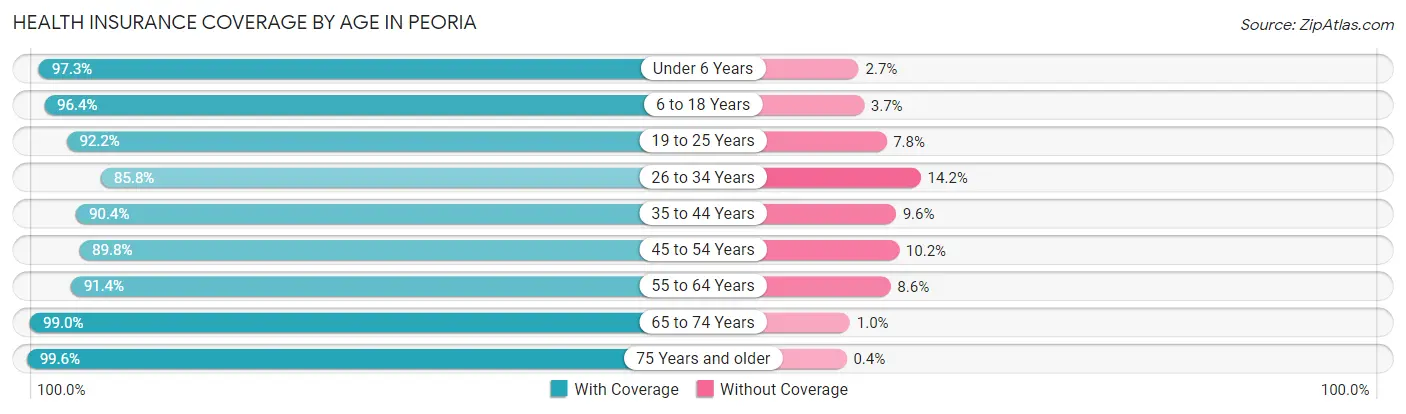
| Age Bracket | With Coverage | Without Coverage |
| Under 6 Years | 9,162 (97.3%) | 251 (2.7%) |
| 6 to 18 Years | 18,495 (96.4%) | 700 (3.6%) |
| 19 to 25 Years | 11,230 (92.2%) | 952 (7.8%) |
| 26 to 34 Years | 12,525 (85.8%) | 2,079 (14.2%) |
| 35 to 44 Years | 12,610 (90.4%) | 1,337 (9.6%) |
| 45 to 54 Years | 10,795 (89.8%) | 1,223 (10.2%) |
| 55 to 64 Years | 11,601 (91.4%) | 1,091 (8.6%) |
| 65 to 74 Years | 10,209 (99.0%) | 107 (1.0%) |
| 75 Years and older | 7,408 (99.6%) | 30 (0.4%) |
| Total | 104,035 (93.0%) | 7,770 (7.0%) |
Health Insurance Coverage by Citizenship Status in Peoria
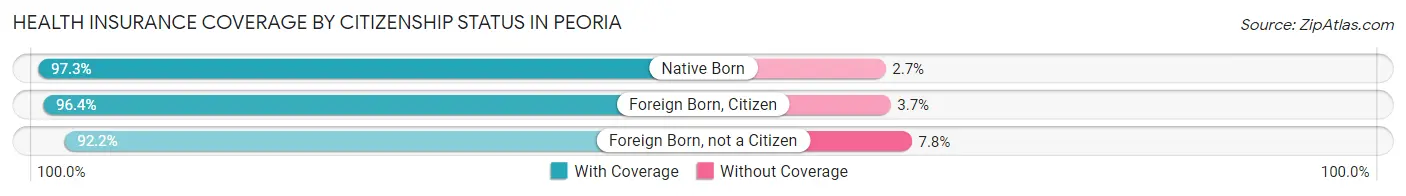
| Citizenship Status | With Coverage | Without Coverage |
| Native Born | 9,162 (97.3%) | 251 (2.7%) |
| Foreign Born, Citizen | 18,495 (96.4%) | 700 (3.6%) |
| Foreign Born, not a Citizen | 11,230 (92.2%) | 952 (7.8%) |
Health Insurance Coverage by Household Income in Peoria
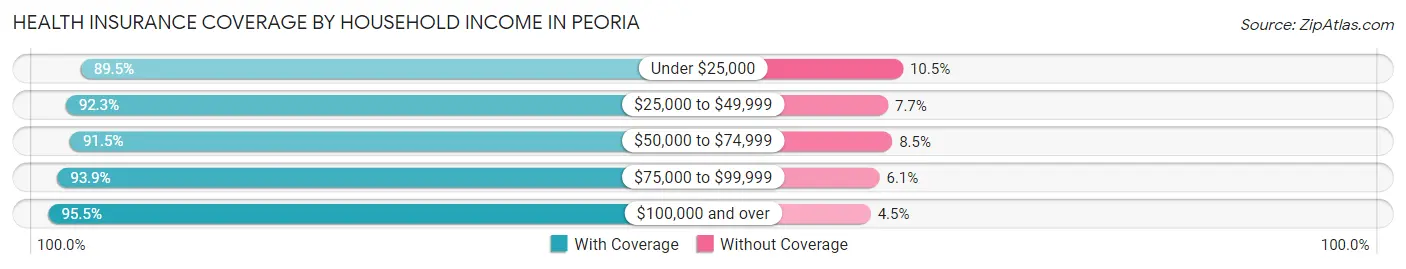
| Household Income | With Coverage | Without Coverage |
| Under $25,000 | 17,638 (89.5%) | 2,076 (10.5%) |
| $25,000 to $49,999 | 18,942 (92.3%) | 1,587 (7.7%) |
| $50,000 to $74,999 | 16,146 (91.5%) | 1,501 (8.5%) |
| $75,000 to $99,999 | 12,367 (93.9%) | 807 (6.1%) |
| $100,000 and over | 36,287 (95.5%) | 1,703 (4.5%) |
Public vs Private Health Insurance Coverage by Age in Peoria
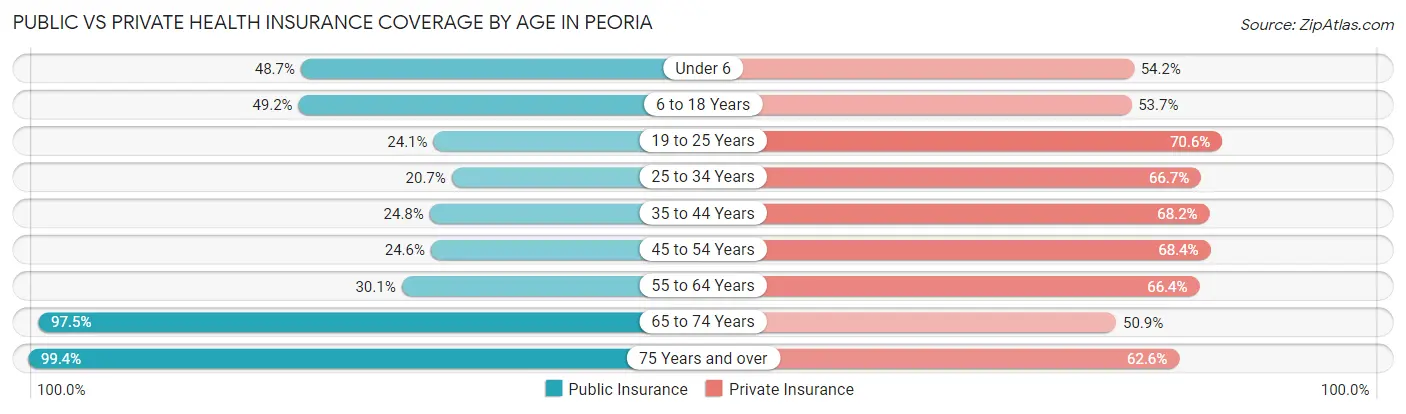
| Age Bracket | Public Insurance | Private Insurance |
| Under 6 | 4,587 (48.7%) | 5,100 (54.2%) |
| 6 to 18 Years | 9,438 (49.2%) | 10,312 (53.7%) |
| 19 to 25 Years | 2,939 (24.1%) | 8,600 (70.6%) |
| 25 to 34 Years | 3,029 (20.7%) | 9,736 (66.7%) |
| 35 to 44 Years | 3,462 (24.8%) | 9,516 (68.2%) |
| 45 to 54 Years | 2,957 (24.6%) | 8,223 (68.4%) |
| 55 to 64 Years | 3,814 (30.0%) | 8,422 (66.4%) |
| 65 to 74 Years | 10,058 (97.5%) | 5,251 (50.9%) |
| 75 Years and over | 7,393 (99.4%) | 4,656 (62.6%) |
| Total | 47,677 (42.6%) | 69,816 (62.4%) |
Disability Status by Sex by Age in Peoria
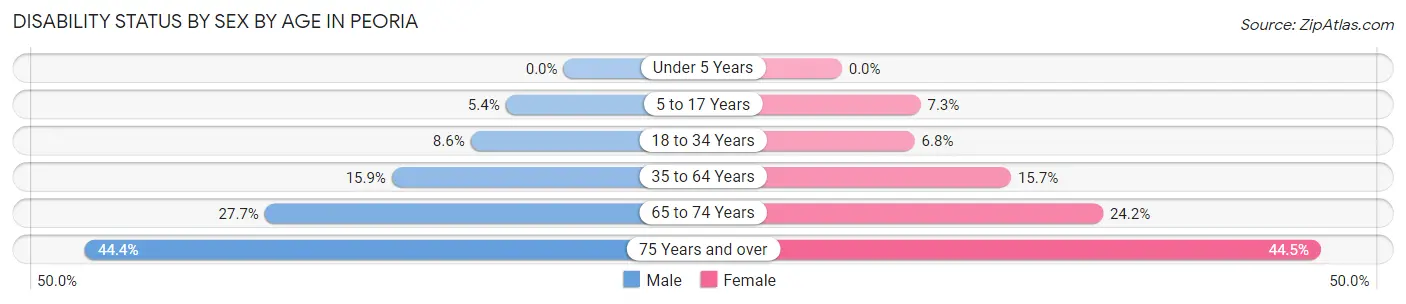
| Age Bracket | Male | Female |
| Under 5 Years | 0 (0.0%) | 0 (0.0%) |
| 5 to 17 Years | 518 (5.4%) | 674 (7.3%) |
| 18 to 34 Years | 1,202 (8.6%) | 988 (6.8%) |
| 35 to 64 Years | 2,944 (15.9%) | 3,168 (15.7%) |
| 65 to 74 Years | 1,336 (27.7%) | 1,332 (24.2%) |
| 75 Years and over | 1,331 (44.4%) | 1,973 (44.5%) |
Disability Class by Sex by Age in Peoria
Disability Class: Hearing Difficulty
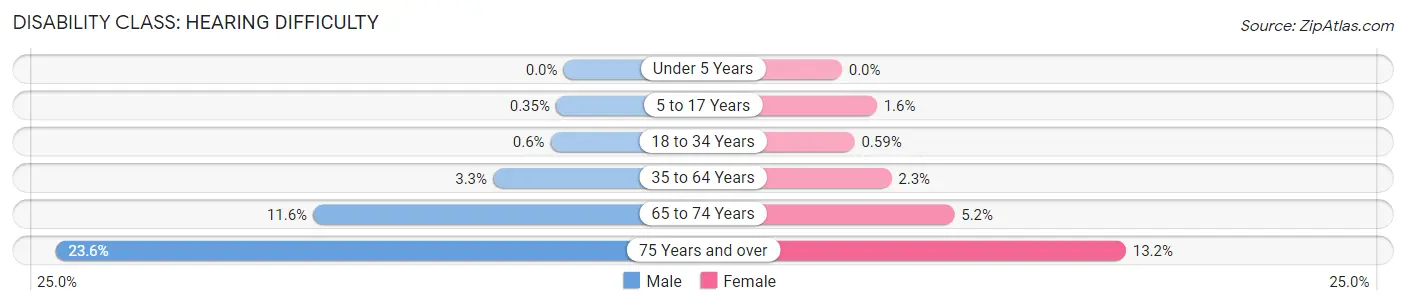
| Age Bracket | Male | Female |
| Under 5 Years | 0 (0.0%) | 0 (0.0%) |
| 5 to 17 Years | 34 (0.4%) | 149 (1.6%) |
| 18 to 34 Years | 84 (0.6%) | 86 (0.6%) |
| 35 to 64 Years | 604 (3.3%) | 465 (2.3%) |
| 65 to 74 Years | 560 (11.6%) | 287 (5.2%) |
| 75 Years and over | 707 (23.6%) | 585 (13.2%) |
Disability Class: Vision Difficulty
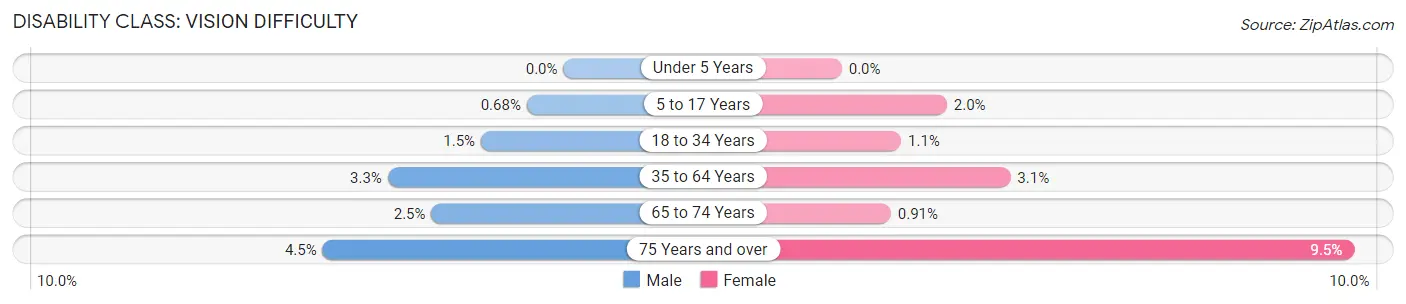
| Age Bracket | Male | Female |
| Under 5 Years | 0 (0.0%) | 0 (0.0%) |
| 5 to 17 Years | 66 (0.7%) | 180 (1.9%) |
| 18 to 34 Years | 214 (1.5%) | 161 (1.1%) |
| 35 to 64 Years | 602 (3.3%) | 631 (3.1%) |
| 65 to 74 Years | 118 (2.5%) | 50 (0.9%) |
| 75 Years and over | 134 (4.5%) | 422 (9.5%) |
Disability Class: Cognitive Difficulty
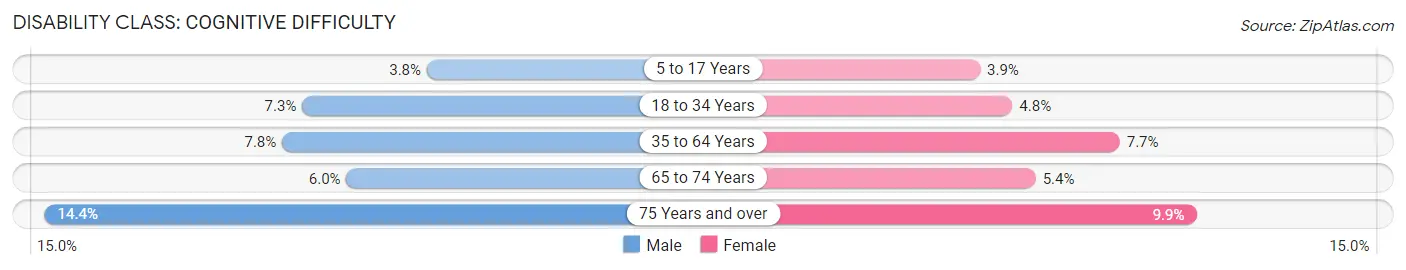
| Age Bracket | Male | Female |
| 5 to 17 Years | 366 (3.8%) | 355 (3.8%) |
| 18 to 34 Years | 1,013 (7.3%) | 694 (4.8%) |
| 35 to 64 Years | 1,446 (7.8%) | 1,562 (7.7%) |
| 65 to 74 Years | 291 (6.0%) | 297 (5.4%) |
| 75 Years and over | 433 (14.4%) | 438 (9.9%) |
Disability Class: Ambulatory Difficulty
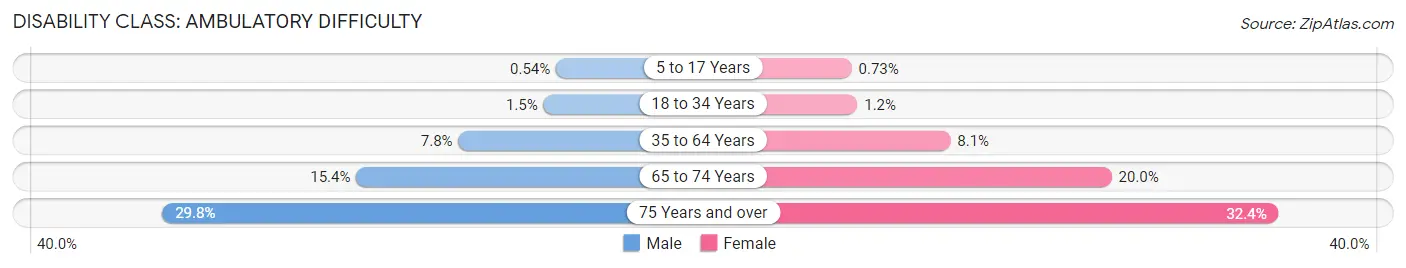
| Age Bracket | Male | Female |
| 5 to 17 Years | 52 (0.5%) | 67 (0.7%) |
| 18 to 34 Years | 205 (1.5%) | 168 (1.1%) |
| 35 to 64 Years | 1,439 (7.8%) | 1,626 (8.1%) |
| 65 to 74 Years | 741 (15.4%) | 1,101 (20.0%) |
| 75 Years and over | 893 (29.8%) | 1,439 (32.4%) |
Disability Class: Self-Care Difficulty
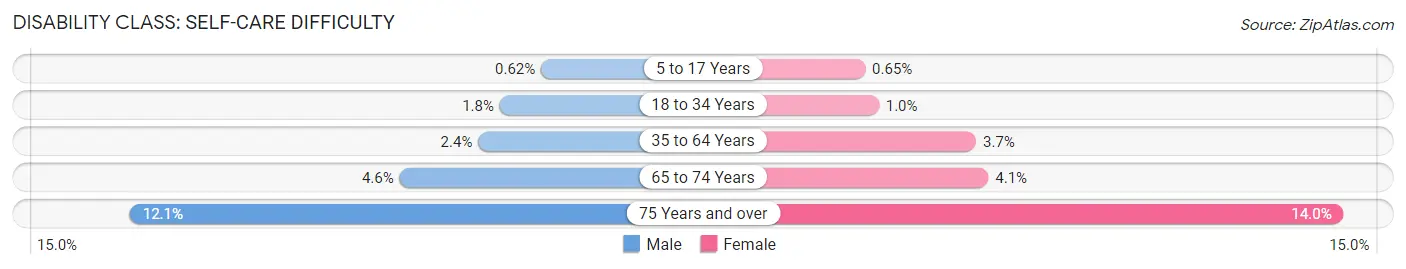
| Age Bracket | Male | Female |
| 5 to 17 Years | 60 (0.6%) | 60 (0.6%) |
| 18 to 34 Years | 247 (1.8%) | 151 (1.0%) |
| 35 to 64 Years | 438 (2.4%) | 754 (3.7%) |
| 65 to 74 Years | 220 (4.6%) | 224 (4.1%) |
| 75 Years and over | 362 (12.1%) | 620 (14.0%) |
Technology Access in Peoria
Computing Device Access in Peoria
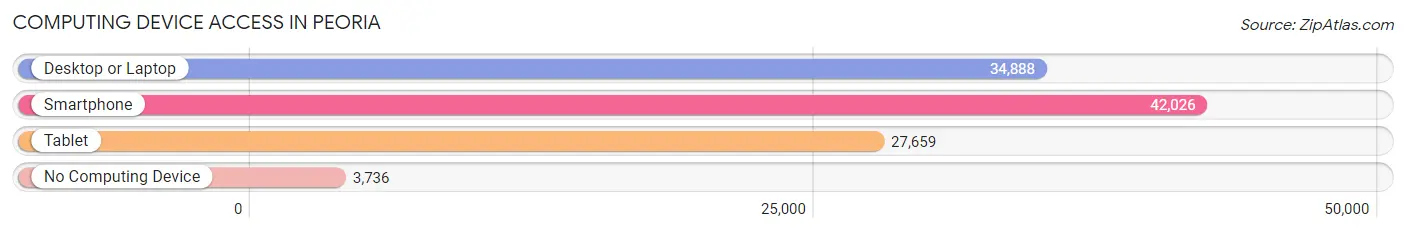
| Device Type | # Households | % Households |
| Desktop or Laptop | 34,888 | 71.9% |
| Smartphone | 42,026 | 86.6% |
| Tablet | 27,659 | 57.0% |
| No Computing Device | 3,736 | 7.7% |
| Total | 48,542 | 100.0% |
Internet Access in Peoria
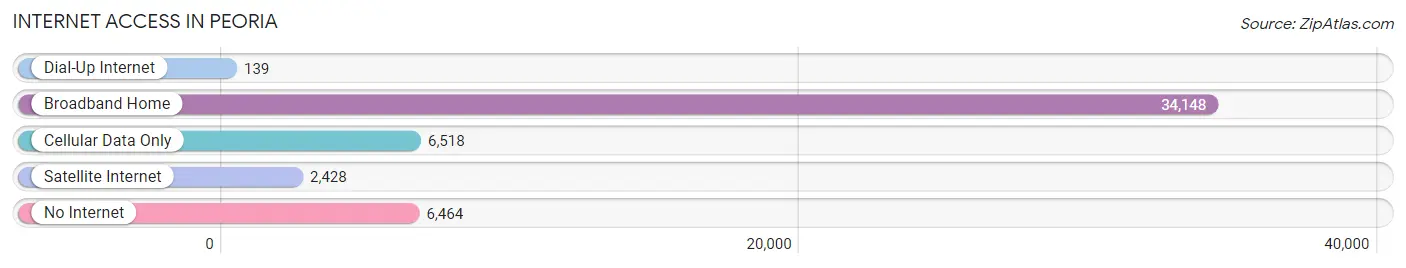
| Internet Type | # Households | % Households |
| Dial-Up Internet | 139 | 0.3% |
| Broadband Home | 34,148 | 70.4% |
| Cellular Data Only | 6,518 | 13.4% |
| Satellite Internet | 2,428 | 5.0% |
| No Internet | 6,464 | 13.3% |
| Total | 48,542 | 100.0% |
Peoria Summary
Peoria, Illinois is a city located in the central part of the state, along the Illinois River. It is the county seat of Peoria County and the largest city on the Illinois River. The city has a population of 115,007 as of the 2019 census, making it the third-largest city in the state of Illinois.
History
Peoria was first settled in 1680 by French explorers, who named the area after the Peoria tribe of Native Americans. The city was officially founded in 1825 and incorporated in 1845. During the 19th century, Peoria was a major transportation hub, with the Illinois and Michigan Canal connecting the city to the Great Lakes. The city was also a major manufacturing center, with the Caterpillar Tractor Company being founded in the city in 1910.
Geography
Peoria is located in the central part of the state of Illinois, along the Illinois River. The city is situated in the Illinois River Valley, which is part of the larger Midwestern United States. The city is located approximately halfway between Chicago and St. Louis. The city has a total area of 44.3 square miles, of which 42.2 square miles is land and 2.1 square miles is water.
Economy
Peoria has a diverse economy, with a variety of industries represented in the city. The city is home to several major employers, including Caterpillar Inc., OSF Healthcare, and UnityPoint Health. The city is also home to several higher education institutions, including Bradley University, Illinois Central College, and Midstate College.
Demographics
As of the 2019 census, Peoria had a population of 115,007. The racial makeup of the city was 75.2% White, 15.3% African American, 0.5% Native American, 2.2% Asian, 0.1% Pacific Islander, 4.2% from other races, and 2.5% from two or more races. The median household income in the city was $45,945, and the median family income was $54,945. The per capita income in the city was $25,945.
Peoria is home to a variety of religious denominations, including Christianity, Judaism, Islam, and Buddhism. The city is also home to a variety of cultural attractions, including the Peoria Riverfront Museum, the Peoria Zoo, and the Peoria Civic Center.
Conclusion
Peoria, Illinois is a city located in the central part of the state, along the Illinois River. It is the county seat of Peoria County and the largest city on the Illinois River. The city has a population of 115,007 as of the 2019 census, making it the third-largest city in the state of Illinois. Peoria has a diverse economy, with a variety of industries represented in the city. The city is also home to several higher education institutions, and a variety of cultural attractions. Peoria is a vibrant city with a rich history and a bright future.
Common Questions
What is the Total Population of Peoria?
Total Population of Peoria is 113,054.
What is the Total Male Population of Peoria?
Total Male Population of Peoria is 54,547.
What is the Total Female Population of Peoria?
Total Female Population of Peoria is 58,507.
What is the Ratio of Males per 100 Females in Peoria?
There are 93.23 Males per 100 Females in Peoria.
What is the Ratio of Females per 100 Males in Peoria?
There are 107.26 Females per 100 Males in Peoria.
What is the Median Population Age in Peoria?
Median Population Age in Peoria is 35.6 Years.
What is the Average Family Size in Peoria
Average Family Size in Peoria is 3.1 People.
What is the Average Household Size in Peoria
Average Household Size in Peoria is 2.2 People.
What is Per Capita Income in Peoria?
Per Capita income in Peoria is $38,547.
What is the Median Family Income in Peoria?
Median Family Income in Peoria is $79,465.
What is the Median Household income in Peoria?
Median Household Income in Peoria is $58,068.
What is Income or Wage Gap in Peoria?
Income or Wage Gap in Peoria is 29.8%.
Women in Peoria earn 70.2 cents for every dollar earned by a man.
What is Family Income Deficit in Peoria?
Family Income Deficit in Peoria is $11,754.
Families that are below poverty line in Peoria earn $11,754 less on average than the poverty threshold level.
What is Inequality or Gini Index in Peoria?
Inequality or Gini Index in Peoria is 0.53.
How Large is the Labor Force in Peoria?
There are 54,802 People in the Labor Forcein in Peoria.
What is the Percentage of People in the Labor Force in Peoria?
61.8% of People are in the Labor Force in Peoria.
What is the Unemployment Rate in Peoria?
Unemployment Rate in Peoria is 8.0%.