Cities with the Highest Percentage of Immigrants from Eastern Asia in Minnesota
RELATED REPORTS & OPTIONS
Eastern Asia
Minnesota
Compare Cities
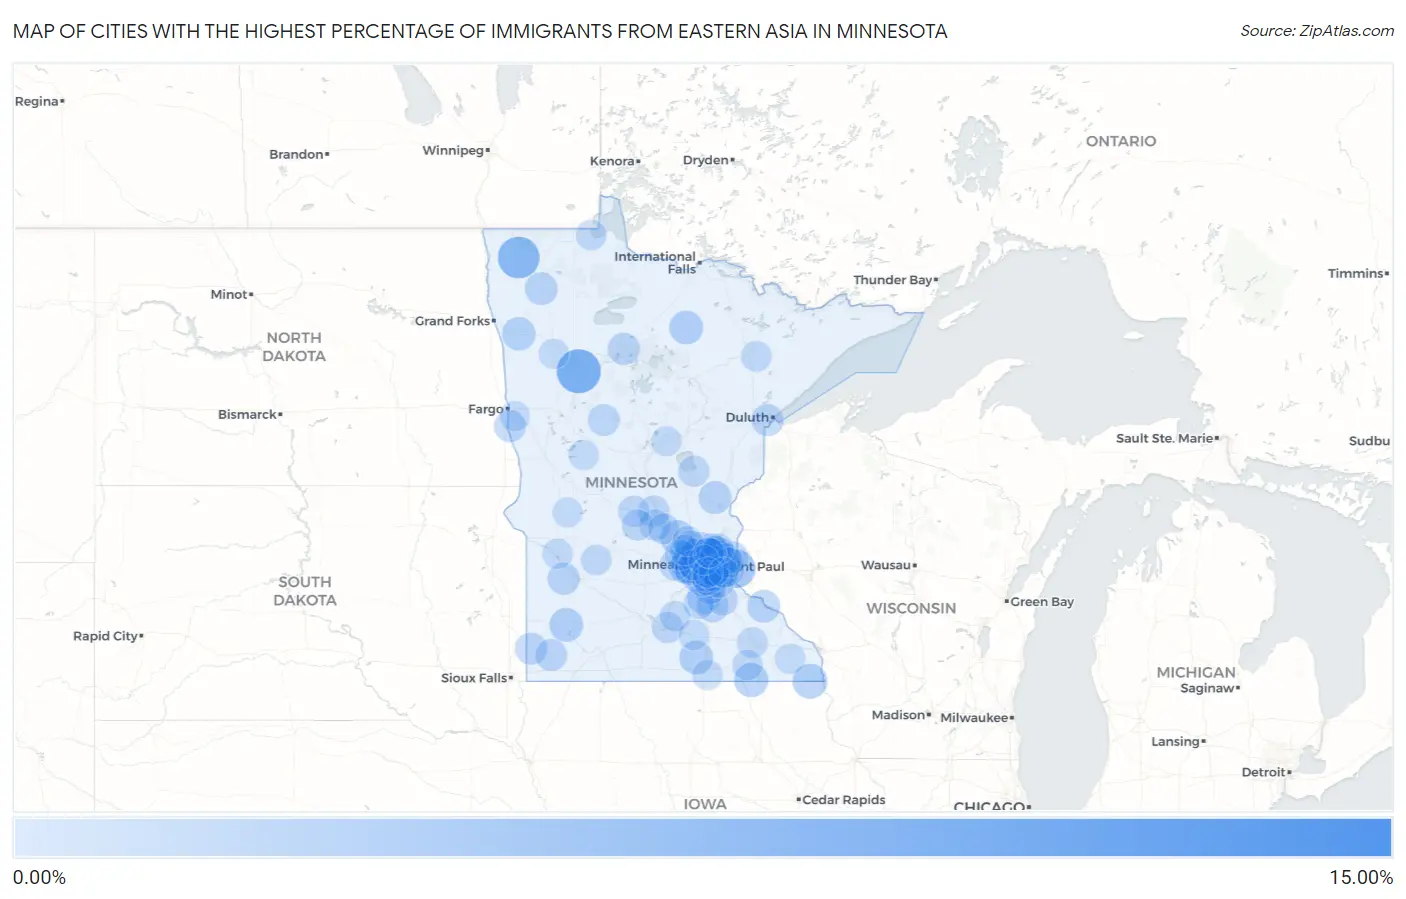
Map of Cities with the Highest Percentage of Immigrants from Eastern Asia in Minnesota
0.00%
15.00%
Cities with the Highest Percentage of Immigrants from Eastern Asia in Minnesota
| City | Eastern Asia | vs State | vs National | |
| 1. | Pickwick | 10.56% | 0.61%(+9.95)#1 | 1.28%(+9.29)#150 |
| 2. | Lauderdale | 8.84% | 0.61%(+8.23)#2 | 1.28%(+7.57)#207 |
| 3. | Roy Lake | 6.45% | 0.61%(+5.84)#3 | 1.28%(+5.18)#334 |
| 4. | Falcon Heights | 5.89% | 0.61%(+5.28)#4 | 1.28%(+4.61)#383 |
| 5. | Halma | 5.41% | 0.61%(+4.80)#5 | 1.28%(+4.13)#443 |
| 6. | Lake St Croix Beach | 4.07% | 0.61%(+3.46)#6 | 1.28%(+2.79)#653 |
| 7. | Orono | 3.31% | 0.61%(+2.70)#7 | 1.28%(+2.03)#865 |
| 8. | St. John's University | 3.23% | 0.61%(+2.62)#8 | 1.28%(+1.95)#893 |
| 9. | Medina | 2.77% | 0.61%(+2.16)#9 | 1.28%(+1.50)#1,058 |
| 10. | Sunfish Lake | 2.71% | 0.61%(+2.10)#10 | 1.28%(+1.44)#1,082 |
| 11. | Shoreview | 2.71% | 0.61%(+2.10)#11 | 1.28%(+1.43)#1,083 |
| 12. | Eitzen | 2.51% | 0.61%(+1.90)#12 | 1.28%(+1.23)#1,182 |
| 13. | Monticello | 2.39% | 0.61%(+1.78)#13 | 1.28%(+1.11)#1,229 |
| 14. | North Oaks | 2.37% | 0.61%(+1.76)#14 | 1.28%(+1.09)#1,245 |
| 15. | Le Roy | 2.27% | 0.61%(+1.66)#15 | 1.28%(+0.991)#1,305 |
| 16. | Arden Hills | 2.20% | 0.61%(+1.59)#16 | 1.28%(+0.927)#1,349 |
| 17. | Effie | 2.11% | 0.61%(+1.50)#17 | 1.28%(+0.830)#1,418 |
| 18. | Garvin | 2.08% | 0.61%(+1.47)#18 | 1.28%(+0.808)#1,436 |
| 19. | Hartland | 2.07% | 0.61%(+1.46)#19 | 1.28%(+0.797)#1,447 |
| 20. | Edina | 2.02% | 0.61%(+1.41)#20 | 1.28%(+0.740)#1,477 |
| 21. | Crookston | 1.97% | 0.61%(+1.36)#21 | 1.28%(+0.692)#1,521 |
| 22. | Woodbury | 1.96% | 0.61%(+1.35)#22 | 1.28%(+0.685)#1,530 |
| 23. | Eden Prairie | 1.89% | 0.61%(+1.28)#23 | 1.28%(+0.612)#1,588 |
| 24. | Elko New Market | 1.88% | 0.61%(+1.27)#24 | 1.28%(+0.601)#1,594 |
| 25. | Lake City | 1.68% | 0.61%(+1.07)#25 | 1.28%(+0.408)#1,788 |
| 26. | Grasston | 1.68% | 0.61%(+1.07)#26 | 1.28%(+0.405)#1,797 |
| 27. | Holt | 1.67% | 0.61%(+1.06)#27 | 1.28%(+0.391)#1,814 |
| 28. | Clarkfield | 1.53% | 0.61%(+0.921)#28 | 1.28%(+0.255)#1,976 |
| 29. | Turtle River | 1.49% | 0.61%(+0.883)#29 | 1.28%(+0.217)#2,023 |
| 30. | St Anthony City Hennepin And Ramsey Counties | 1.48% | 0.61%(+0.869)#30 | 1.28%(+0.203)#2,044 |
| 31. | Proctor | 1.45% | 0.61%(+0.836)#31 | 1.28%(+0.170)#2,088 |
| 32. | New Brighton | 1.43% | 0.61%(+0.817)#32 | 1.28%(+0.150)#2,115 |
| 33. | Ihlen | 1.41% | 0.61%(+0.799)#33 | 1.28%(+0.133)#2,149 |
| 34. | Mound | 1.38% | 0.61%(+0.771)#34 | 1.28%(+0.105)#2,200 |
| 35. | Leota | 1.37% | 0.61%(+0.760)#35 | 1.28%(+0.094)#2,211 |
| 36. | Northfield | 1.35% | 0.61%(+0.746)#36 | 1.28%(+0.079)#2,235 |
| 37. | Minnetonka | 1.35% | 0.61%(+0.743)#37 | 1.28%(+0.077)#2,239 |
| 38. | Comstock | 1.33% | 0.61%(+0.724)#38 | 1.28%(+0.058)#2,279 |
| 39. | Menahga | 1.31% | 0.61%(+0.704)#39 | 1.28%(+0.038)#2,303 |
| 40. | St Louis Park | 1.29% | 0.61%(+0.686)#40 | 1.28%(+0.019)#2,347 |
| 41. | Stillwater | 1.27% | 0.61%(+0.664)#41 | 1.28%(-0.002)#2,392 |
| 42. | Minneapolis | 1.19% | 0.61%(+0.579)#42 | 1.28%(-0.087)#2,536 |
| 43. | Sartell | 1.18% | 0.61%(+0.567)#43 | 1.28%(-0.099)#2,556 |
| 44. | St Augusta | 1.16% | 0.61%(+0.555)#44 | 1.28%(-0.111)#2,585 |
| 45. | Plymouth | 1.16% | 0.61%(+0.549)#45 | 1.28%(-0.117)#2,598 |
| 46. | Wahkon | 1.11% | 0.61%(+0.498)#46 | 1.28%(-0.169)#2,688 |
| 47. | Mankato | 1.10% | 0.61%(+0.495)#47 | 1.28%(-0.171)#2,690 |
| 48. | Albany | 1.07% | 0.61%(+0.464)#48 | 1.28%(-0.202)#2,766 |
| 49. | Richmond | 1.05% | 0.61%(+0.444)#49 | 1.28%(-0.222)#2,810 |
| 50. | Maplewood | 1.03% | 0.61%(+0.424)#50 | 1.28%(-0.242)#2,858 |
| 51. | Randolph | 1.03% | 0.61%(+0.424)#51 | 1.28%(-0.243)#2,862 |
| 52. | Corcoran | 1.01% | 0.61%(+0.398)#52 | 1.28%(-0.268)#2,935 |
| 53. | Champlin | 0.98% | 0.61%(+0.375)#53 | 1.28%(-0.291)#3,008 |
| 54. | Clearwater | 0.98% | 0.61%(+0.371)#54 | 1.28%(-0.295)#3,019 |
| 55. | Watertown | 0.98% | 0.61%(+0.367)#55 | 1.28%(-0.299)#3,027 |
| 56. | Rogers | 0.97% | 0.61%(+0.362)#56 | 1.28%(-0.305)#3,043 |
| 57. | Mckinley | 0.96% | 0.61%(+0.352)#57 | 1.28%(-0.314)#3,073 |
| 58. | Circle Pines | 0.96% | 0.61%(+0.351)#58 | 1.28%(-0.315)#3,074 |
| 59. | Rochester | 0.95% | 0.61%(+0.344)#59 | 1.28%(-0.322)#3,101 |
| 60. | Apple Valley | 0.94% | 0.61%(+0.335)#60 | 1.28%(-0.331)#3,132 |
| 61. | Lakeville | 0.94% | 0.61%(+0.330)#61 | 1.28%(-0.336)#3,148 |
| 62. | St Paul | 0.94% | 0.61%(+0.329)#62 | 1.28%(-0.338)#3,151 |
| 63. | Raymond | 0.94% | 0.61%(+0.328)#63 | 1.28%(-0.339)#3,157 |
| 64. | Roseville | 0.93% | 0.61%(+0.319)#64 | 1.28%(-0.347)#3,184 |
| 65. | Maple Grove | 0.93% | 0.61%(+0.316)#65 | 1.28%(-0.350)#3,191 |
| 66. | Lilydale | 0.92% | 0.61%(+0.310)#66 | 1.28%(-0.356)#3,212 |
| 67. | Pine Springs | 0.90% | 0.61%(+0.294)#67 | 1.28%(-0.373)#3,254 |
| 68. | Rockford | 0.88% | 0.61%(+0.275)#68 | 1.28%(-0.392)#3,301 |
| 69. | Columbia Heights | 0.85% | 0.61%(+0.243)#69 | 1.28%(-0.423)#3,400 |
| 70. | Lonsdale | 0.85% | 0.61%(+0.237)#70 | 1.28%(-0.429)#3,422 |
| 71. | Savage | 0.84% | 0.61%(+0.232)#71 | 1.28%(-0.434)#3,434 |
| 72. | Grand Meadow | 0.84% | 0.61%(+0.230)#72 | 1.28%(-0.436)#3,442 |
| 73. | Bloomington | 0.84% | 0.61%(+0.229)#73 | 1.28%(-0.438)#3,449 |
| 74. | Cleveland | 0.83% | 0.61%(+0.225)#74 | 1.28%(-0.441)#3,460 |
| 75. | Rosemount | 0.83% | 0.61%(+0.222)#75 | 1.28%(-0.445)#3,474 |
| 76. | Shorewood | 0.83% | 0.61%(+0.219)#76 | 1.28%(-0.447)#3,480 |
| 77. | Warroad | 0.82% | 0.61%(+0.210)#77 | 1.28%(-0.457)#3,504 |
| 78. | Wayzata | 0.80% | 0.61%(+0.192)#78 | 1.28%(-0.474)#3,580 |
| 79. | Blaine | 0.80% | 0.61%(+0.186)#79 | 1.28%(-0.480)#3,606 |
| 80. | Eagan | 0.78% | 0.61%(+0.173)#80 | 1.28%(-0.493)#3,646 |
| 81. | Hanover | 0.78% | 0.61%(+0.172)#81 | 1.28%(-0.494)#3,648 |
| 82. | Henning | 0.78% | 0.61%(+0.169)#82 | 1.28%(-0.497)#3,661 |
| 83. | Burnsville | 0.76% | 0.61%(+0.154)#83 | 1.28%(-0.513)#3,731 |
| 84. | Lake Elmo | 0.76% | 0.61%(+0.149)#84 | 1.28%(-0.517)#3,754 |
| 85. | Milan | 0.75% | 0.61%(+0.144)#85 | 1.28%(-0.522)#3,778 |
| 86. | Peterson | 0.75% | 0.61%(+0.137)#86 | 1.28%(-0.529)#3,805 |
| 87. | Lino Lakes | 0.73% | 0.61%(+0.125)#87 | 1.28%(-0.542)#3,850 |
| 88. | Waseca | 0.73% | 0.61%(+0.118)#88 | 1.28%(-0.548)#3,873 |
| 89. | Ironton | 0.72% | 0.61%(+0.106)#89 | 1.28%(-0.560)#3,917 |
| 90. | Glenville | 0.71% | 0.61%(+0.102)#90 | 1.28%(-0.564)#3,928 |
| 91. | Mendota | 0.70% | 0.61%(+0.095)#91 | 1.28%(-0.571)#3,957 |
| 92. | Otsego | 0.68% | 0.61%(+0.075)#92 | 1.28%(-0.591)#4,050 |
| 93. | Mounds View | 0.68% | 0.61%(+0.070)#93 | 1.28%(-0.596)#4,068 |
| 94. | Robbinsdale | 0.68% | 0.61%(+0.069)#94 | 1.28%(-0.598)#4,073 |
| 95. | Richfield | 0.68% | 0.61%(+0.067)#95 | 1.28%(-0.599)#4,080 |
| 96. | Newport | 0.67% | 0.61%(+0.063)#96 | 1.28%(-0.603)#4,101 |
| 97. | Spring Lake Park | 0.66% | 0.61%(+0.051)#97 | 1.28%(-0.615)#4,161 |
| 98. | Cyrus | 0.66% | 0.61%(+0.049)#98 | 1.28%(-0.618)#4,178 |
| 99. | Sabin | 0.65% | 0.61%(+0.037)#99 | 1.28%(-0.629)#4,221 |
| 100. | Winger | 0.65% | 0.61%(+0.036)#100 | 1.28%(-0.631)#4,226 |
Common Questions
What are the Top 10 Cities with the Highest Percentage of Immigrants from Eastern Asia in Minnesota?
Top 10 Cities with the Highest Percentage of Immigrants from Eastern Asia in Minnesota are:
#1
8.84%
#2
6.45%
#3
5.89%
#4
5.41%
#5
4.07%
#6
3.31%
#7
2.77%
#8
2.71%
#9
2.71%
#10
2.51%
What city has the Highest Percentage of Immigrants from Eastern Asia in Minnesota?
Lauderdale has the Highest Percentage of Immigrants from Eastern Asia in Minnesota with 8.84%.
What is the Percentage of Immigrants from Eastern Asia in the State of Minnesota?
Percentage of Immigrants from Eastern Asia in Minnesota is 0.61%.
What is the Percentage of Immigrants from Eastern Asia in the United States?
Percentage of Immigrants from Eastern Asia in the United States is 1.28%.