Cities with the Highest Percentage of Immigrants from Eastern Asia in Indiana
RELATED REPORTS & OPTIONS
Eastern Asia
Indiana
Compare Cities
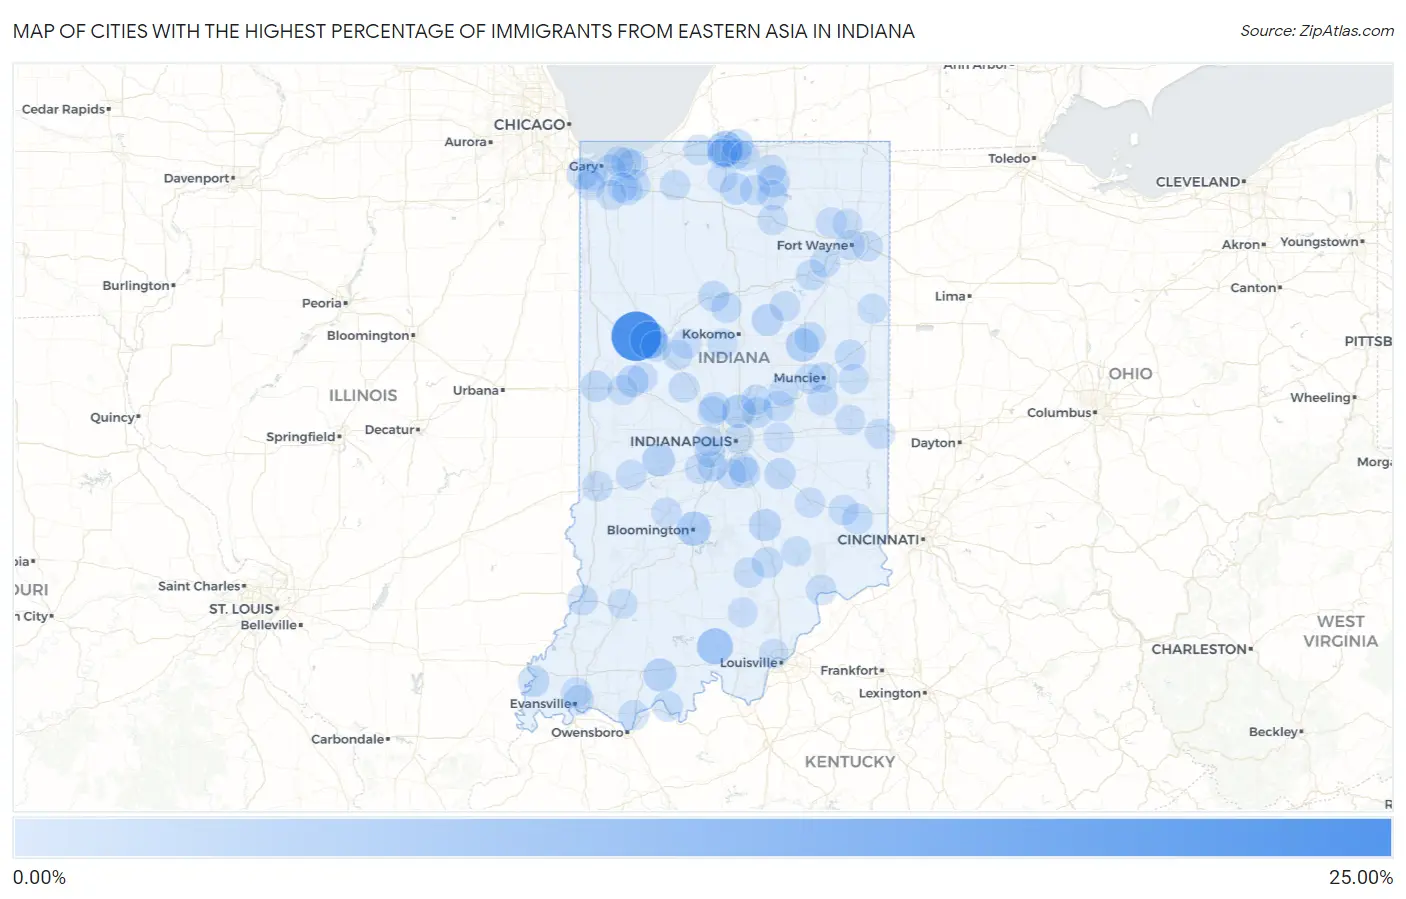
Map of Cities with the Highest Percentage of Immigrants from Eastern Asia in Indiana
0.00%
25.00%
Cities with the Highest Percentage of Immigrants from Eastern Asia in Indiana
| City | Eastern Asia | vs State | vs National | |
| 1. | Montmorenci | 20.95% | 0.52%(+20.4)#1 | 1.28%(+19.7)#42 |
| 2. | West Lafayette | 7.91% | 0.52%(+7.39)#2 | 1.28%(+6.63)#254 |
| 3. | Marengo | 6.27% | 0.52%(+5.75)#3 | 1.28%(+5.00)#347 |
| 4. | Roseland | 5.92% | 0.52%(+5.40)#4 | 1.28%(+4.64)#379 |
| 5. | Thayer | 5.10% | 0.52%(+4.58)#5 | 1.28%(+3.82)#476 |
| 6. | Bloomington | 4.55% | 0.52%(+4.03)#6 | 1.28%(+3.28)#565 |
| 7. | Fowlerton | 3.65% | 0.52%(+3.13)#7 | 1.28%(+2.38)#755 |
| 8. | Carmel | 3.56% | 0.52%(+3.04)#8 | 1.28%(+2.28)#781 |
| 9. | St Meinrad | 3.31% | 0.52%(+2.79)#9 | 1.28%(+2.03)#864 |
| 10. | Greencastle | 2.98% | 0.52%(+2.46)#10 | 1.28%(+1.70)#966 |
| 11. | Columbus | 2.47% | 0.52%(+1.95)#11 | 1.28%(+1.20)#1,197 |
| 12. | Lake Eliza | 2.22% | 0.52%(+1.70)#12 | 1.28%(+0.940)#1,340 |
| 13. | Notre Dame | 2.13% | 0.52%(+1.61)#13 | 1.28%(+0.854)#1,396 |
| 14. | New Paris | 2.13% | 0.52%(+1.61)#14 | 1.28%(+0.849)#1,401 |
| 15. | Wingate | 1.99% | 0.52%(+1.47)#15 | 1.28%(+0.718)#1,498 |
| 16. | Converse | 1.96% | 0.52%(+1.45)#16 | 1.28%(+0.689)#1,523 |
| 17. | Bremen | 1.86% | 0.52%(+1.35)#17 | 1.28%(+0.588)#1,608 |
| 18. | Munster | 1.82% | 0.52%(+1.30)#18 | 1.28%(+0.545)#1,650 |
| 19. | New Harmony | 1.70% | 0.52%(+1.18)#19 | 1.28%(+0.421)#1,774 |
| 20. | Covington | 1.68% | 0.52%(+1.16)#20 | 1.28%(+0.403)#1,798 |
| 21. | Granger | 1.65% | 0.52%(+1.13)#21 | 1.28%(+0.373)#1,841 |
| 22. | Shelbyville | 1.58% | 0.52%(+1.06)#22 | 1.28%(+0.305)#1,924 |
| 23. | Seymour | 1.38% | 0.52%(+0.857)#23 | 1.28%(+0.100)#2,203 |
| 24. | Upland | 1.36% | 0.52%(+0.844)#24 | 1.28%(+0.087)#2,226 |
| 25. | Zionsville | 1.33% | 0.52%(+0.811)#25 | 1.28%(+0.054)#2,286 |
| 26. | Whiteland | 1.31% | 0.52%(+0.790)#26 | 1.28%(+0.033)#2,313 |
| 27. | Lake Station | 1.24% | 0.52%(+0.717)#27 | 1.28%(-0.040)#2,456 |
| 28. | Logansport | 1.23% | 0.52%(+0.709)#28 | 1.28%(-0.048)#2,466 |
| 29. | Fishers | 1.12% | 0.52%(+0.606)#29 | 1.28%(-0.151)#2,655 |
| 30. | Springport | 1.12% | 0.52%(+0.598)#30 | 1.28%(-0.158)#2,672 |
| 31. | Pendleton | 1.07% | 0.52%(+0.555)#31 | 1.28%(-0.202)#2,765 |
| 32. | Huntington | 1.03% | 0.52%(+0.515)#32 | 1.28%(-0.241)#2,856 |
| 33. | Redkey | 1.03% | 0.52%(+0.515)#33 | 1.28%(-0.241)#2,857 |
| 34. | Chesterton | 1.03% | 0.52%(+0.510)#34 | 1.28%(-0.247)#2,872 |
| 35. | Tell City | 0.98% | 0.52%(+0.458)#35 | 1.28%(-0.298)#3,025 |
| 36. | Vincennes | 0.96% | 0.52%(+0.438)#36 | 1.28%(-0.318)#3,090 |
| 37. | Sunman | 0.96% | 0.52%(+0.437)#37 | 1.28%(-0.320)#3,094 |
| 38. | Valparaiso | 0.95% | 0.52%(+0.428)#38 | 1.28%(-0.328)#3,121 |
| 39. | Walton | 0.91% | 0.52%(+0.390)#39 | 1.28%(-0.367)#3,239 |
| 40. | Lafayette | 0.90% | 0.52%(+0.379)#40 | 1.28%(-0.378)#3,262 |
| 41. | Mishawaka | 0.86% | 0.52%(+0.344)#41 | 1.28%(-0.413)#3,370 |
| 42. | Harmony | 0.81% | 0.52%(+0.295)#42 | 1.28%(-0.462)#3,528 |
| 43. | Noblesville | 0.81% | 0.52%(+0.294)#43 | 1.28%(-0.462)#3,532 |
| 44. | Aberdeen | 0.80% | 0.52%(+0.278)#44 | 1.28%(-0.478)#3,598 |
| 45. | Terre Haute | 0.77% | 0.52%(+0.252)#45 | 1.28%(-0.504)#3,694 |
| 46. | Madison | 0.76% | 0.52%(+0.237)#46 | 1.28%(-0.520)#3,766 |
| 47. | New Carlisle | 0.74% | 0.52%(+0.221)#47 | 1.28%(-0.536)#3,826 |
| 48. | Kingsford Heights | 0.72% | 0.52%(+0.200)#48 | 1.28%(-0.557)#3,903 |
| 49. | Thorntown | 0.71% | 0.52%(+0.196)#49 | 1.28%(-0.561)#3,921 |
| 50. | Goshen | 0.70% | 0.52%(+0.181)#50 | 1.28%(-0.575)#3,978 |
| 51. | Batesville | 0.68% | 0.52%(+0.162)#51 | 1.28%(-0.595)#4,062 |
| 52. | Yorktown | 0.67% | 0.52%(+0.156)#52 | 1.28%(-0.601)#4,090 |
| 53. | La Fontaine | 0.67% | 0.52%(+0.150)#53 | 1.28%(-0.607)#4,119 |
| 54. | Bargersville | 0.66% | 0.52%(+0.143)#54 | 1.28%(-0.614)#4,151 |
| 55. | Churubusco | 0.66% | 0.52%(+0.137)#55 | 1.28%(-0.620)#4,183 |
| 56. | Monrovia | 0.64% | 0.52%(+0.116)#56 | 1.28%(-0.640)#4,266 |
| 57. | Griffith | 0.63% | 0.52%(+0.111)#57 | 1.28%(-0.645)#4,290 |
| 58. | New Haven | 0.62% | 0.52%(+0.098)#58 | 1.28%(-0.658)#4,349 |
| 59. | Greenwood | 0.61% | 0.52%(+0.091)#59 | 1.28%(-0.665)#4,378 |
| 60. | Richmond | 0.60% | 0.52%(+0.084)#60 | 1.28%(-0.672)#4,414 |
| 61. | Mooresville | 0.60% | 0.52%(+0.079)#61 | 1.28%(-0.677)#4,440 |
| 62. | Brownstown | 0.60% | 0.52%(+0.078)#62 | 1.28%(-0.679)#4,444 |
| 63. | Highland | 0.59% | 0.52%(+0.071)#63 | 1.28%(-0.685)#4,480 |
| 64. | Plainfield | 0.58% | 0.52%(+0.057)#64 | 1.28%(-0.700)#4,544 |
| 65. | Milford | 0.57% | 0.52%(+0.049)#65 | 1.28%(-0.708)#4,589 |
| 66. | Nappanee | 0.56% | 0.52%(+0.045)#66 | 1.28%(-0.712)#4,615 |
| 67. | Evansville | 0.56% | 0.52%(+0.038)#67 | 1.28%(-0.719)#4,660 |
| 68. | Rockport | 0.55% | 0.52%(+0.031)#68 | 1.28%(-0.726)#4,705 |
| 69. | Whitestown | 0.55% | 0.52%(+0.027)#69 | 1.28%(-0.729)#4,736 |
| 70. | Mulberry | 0.55% | 0.52%(+0.027)#70 | 1.28%(-0.730)#4,738 |
| 71. | Warsaw | 0.54% | 0.52%(+0.021)#71 | 1.28%(-0.735)#4,778 |
| 72. | Roanoke | 0.54% | 0.52%(+0.021)#72 | 1.28%(-0.736)#4,779 |
| 73. | Burns Harbor | 0.54% | 0.52%(+0.021)#73 | 1.28%(-0.736)#4,782 |
| 74. | Muncie | 0.54% | 0.52%(+0.018)#74 | 1.28%(-0.739)#4,799 |
| 75. | Russiaville | 0.52% | 0.52%(-0.000)#75 | 1.28%(-0.757)#4,906 |
| 76. | Schererville | 0.52% | 0.52%(-0.002)#76 | 1.28%(-0.758)#4,913 |
| 77. | Rossville | 0.51% | 0.52%(-0.004)#77 | 1.28%(-0.761)#4,933 |
| 78. | Ogden Dunes | 0.49% | 0.52%(-0.027)#78 | 1.28%(-0.783)#5,070 |
| 79. | New Richmond | 0.49% | 0.52%(-0.028)#79 | 1.28%(-0.784)#5,078 |
| 80. | South Bend | 0.48% | 0.52%(-0.039)#80 | 1.28%(-0.795)#5,147 |
| 81. | Shorewood Forest | 0.47% | 0.52%(-0.052)#81 | 1.28%(-0.809)#5,236 |
| 82. | Hillsboro | 0.46% | 0.52%(-0.060)#82 | 1.28%(-0.816)#5,268 |
| 83. | Greensburg | 0.45% | 0.52%(-0.064)#83 | 1.28%(-0.821)#5,300 |
| 84. | Huntertown | 0.45% | 0.52%(-0.068)#84 | 1.28%(-0.825)#5,333 |
| 85. | Spencer | 0.45% | 0.52%(-0.073)#85 | 1.28%(-0.829)#5,367 |
| 86. | Lakeville | 0.43% | 0.52%(-0.084)#86 | 1.28%(-0.841)#5,460 |
| 87. | Greenfield | 0.42% | 0.52%(-0.096)#87 | 1.28%(-0.853)#5,559 |
| 88. | Avon | 0.40% | 0.52%(-0.115)#88 | 1.28%(-0.872)#5,703 |
| 89. | North Vernon | 0.39% | 0.52%(-0.130)#89 | 1.28%(-0.886)#5,814 |
| 90. | Osceola | 0.39% | 0.52%(-0.133)#90 | 1.28%(-0.889)#5,839 |
| 91. | Farmland | 0.39% | 0.52%(-0.134)#91 | 1.28%(-0.890)#5,850 |
| 92. | Winfield | 0.36% | 0.52%(-0.159)#92 | 1.28%(-0.916)#6,020 |
| 93. | Indianapolis | 0.36% | 0.52%(-0.159)#93 | 1.28%(-0.916)#6,025 |
| 94. | Edgewood | 0.36% | 0.52%(-0.163)#94 | 1.28%(-0.920)#6,057 |
| 95. | Berne | 0.33% | 0.52%(-0.188)#95 | 1.28%(-0.945)#6,245 |
| 96. | Fort Wayne | 0.31% | 0.52%(-0.208)#96 | 1.28%(-0.965)#6,425 |
| 97. | Hagerstown | 0.31% | 0.52%(-0.208)#97 | 1.28%(-0.965)#6,428 |
| 98. | New Albany | 0.31% | 0.52%(-0.210)#98 | 1.28%(-0.967)#6,450 |
| 99. | Salem | 0.30% | 0.52%(-0.219)#99 | 1.28%(-0.976)#6,517 |
| 100. | Washington | 0.30% | 0.52%(-0.221)#100 | 1.28%(-0.978)#6,537 |
Common Questions
What are the Top 10 Cities with the Highest Percentage of Immigrants from Eastern Asia in Indiana?
Top 10 Cities with the Highest Percentage of Immigrants from Eastern Asia in Indiana are:
#1
20.95%
#2
7.91%
#3
6.27%
#4
5.92%
#5
4.55%
#6
3.65%
#7
3.56%
#8
3.31%
#9
2.98%
#10
2.47%
What city has the Highest Percentage of Immigrants from Eastern Asia in Indiana?
Montmorenci has the Highest Percentage of Immigrants from Eastern Asia in Indiana with 20.95%.
What is the Percentage of Immigrants from Eastern Asia in the State of Indiana?
Percentage of Immigrants from Eastern Asia in Indiana is 0.52%.
What is the Percentage of Immigrants from Eastern Asia in the United States?
Percentage of Immigrants from Eastern Asia in the United States is 1.28%.