Cities with the Most Immigrants from Western Asia in New York
RELATED REPORTS & OPTIONS
Western Asia
New York
Compare Cities
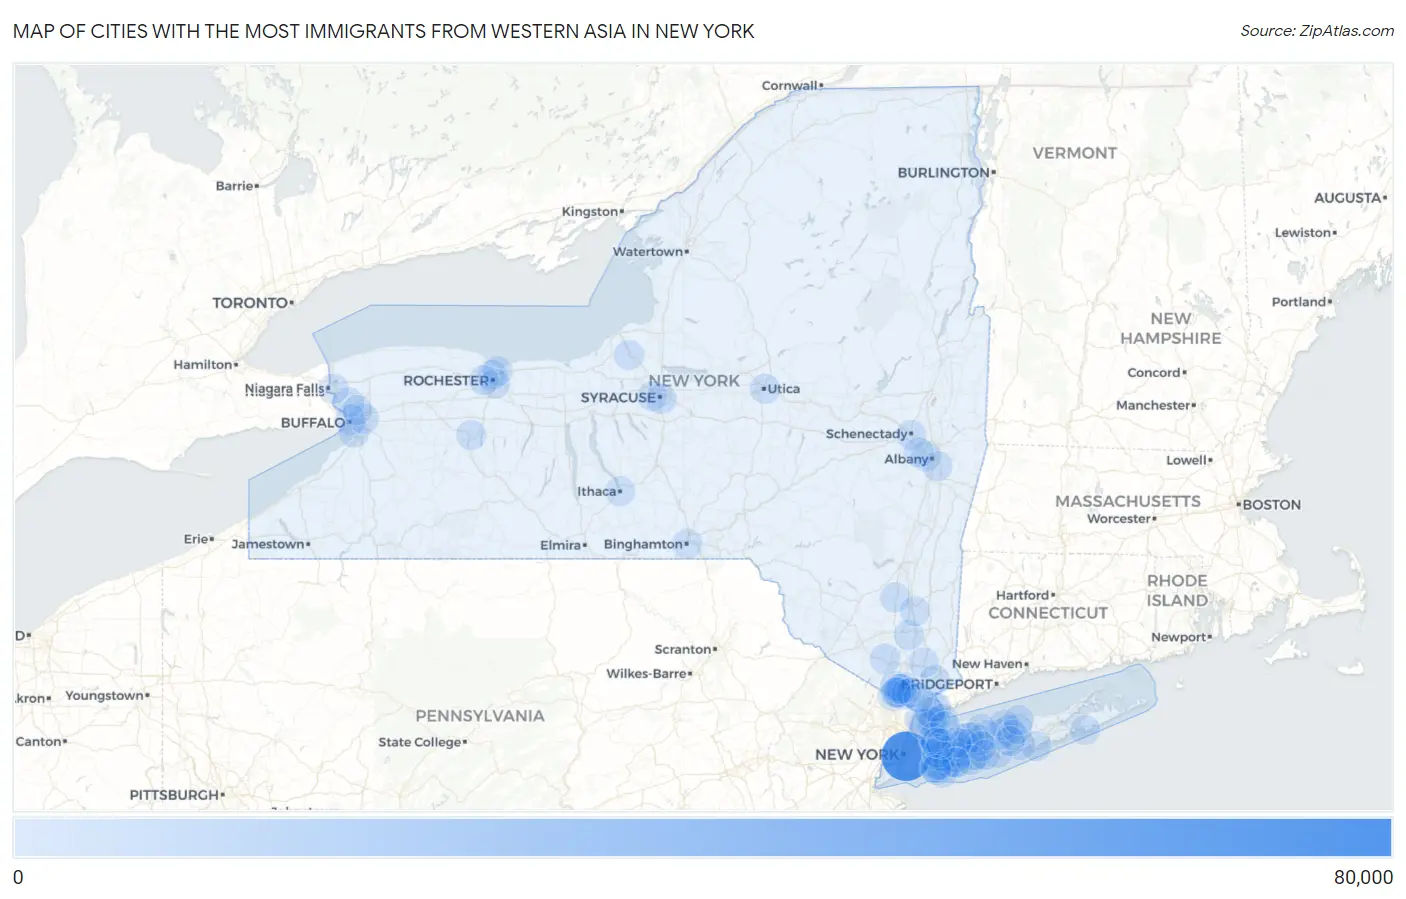
Map of Cities with the Most Immigrants from Western Asia in New York
0
80,000
Cities with the Most Immigrants from Western Asia in New York
| City | Western Asia | vs State | vs National | |
| 1. | New York | 77,480 | 124,568(62.20%)#1 | 1,204,112(6.43%)#1 |
| 2. | Yonkers | 2,220 | 124,568(1.78%)#2 | 1,204,112(0.18%)#55 |
| 3. | Buffalo | 1,550 | 124,568(1.24%)#3 | 1,204,112(0.13%)#81 |
| 4. | Syracuse | 1,302 | 124,568(1.05%)#4 | 1,204,112(0.11%)#101 |
| 5. | Kiryas Joel | 1,088 | 124,568(0.87%)#5 | 1,204,112(0.09%)#132 |
| 6. | Lackawanna | 1,044 | 124,568(0.84%)#6 | 1,204,112(0.09%)#139 |
| 7. | Cheektowaga | 883 | 124,568(0.71%)#7 | 1,204,112(0.07%)#173 |
| 8. | Utica | 673 | 124,568(0.54%)#8 | 1,204,112(0.06%)#247 |
| 9. | Rochester | 641 | 124,568(0.51%)#9 | 1,204,112(0.05%)#260 |
| 10. | Albany | 547 | 124,568(0.44%)#10 | 1,204,112(0.05%)#305 |
| 11. | Centereach | 514 | 124,568(0.41%)#11 | 1,204,112(0.04%)#327 |
| 12. | Tonawanda | 428 | 124,568(0.34%)#12 | 1,204,112(0.04%)#406 |
| 13. | Binghamton | 419 | 124,568(0.34%)#13 | 1,204,112(0.03%)#417 |
| 14. | East Patchogue | 412 | 124,568(0.33%)#14 | 1,204,112(0.03%)#423 |
| 15. | Monsey | 411 | 124,568(0.33%)#15 | 1,204,112(0.03%)#425 |
| 16. | West Babylon | 393 | 124,568(0.32%)#16 | 1,204,112(0.03%)#442 |
| 17. | Woodmere | 387 | 124,568(0.31%)#17 | 1,204,112(0.03%)#453 |
| 18. | Nesconset | 353 | 124,568(0.28%)#18 | 1,204,112(0.03%)#495 |
| 19. | Levittown | 337 | 124,568(0.27%)#19 | 1,204,112(0.03%)#518 |
| 20. | New City | 327 | 124,568(0.26%)#20 | 1,204,112(0.03%)#531 |
| 21. | Mount Kisco | 322 | 124,568(0.26%)#21 | 1,204,112(0.03%)#540 |
| 22. | Brighton | 319 | 124,568(0.26%)#22 | 1,204,112(0.03%)#545 |
| 23. | West Hempstead | 294 | 124,568(0.24%)#23 | 1,204,112(0.02%)#588 |
| 24. | Solvay | 287 | 124,568(0.23%)#24 | 1,204,112(0.02%)#602 |
| 25. | New Rochelle | 285 | 124,568(0.23%)#25 | 1,204,112(0.02%)#606 |
| 26. | Oceanside | 281 | 124,568(0.23%)#26 | 1,204,112(0.02%)#615 |
| 27. | White Plains | 276 | 124,568(0.22%)#27 | 1,204,112(0.02%)#631 |
| 28. | Great Neck | 268 | 124,568(0.22%)#28 | 1,204,112(0.02%)#647 |
| 29. | Nanuet | 262 | 124,568(0.21%)#29 | 1,204,112(0.02%)#666 |
| 30. | Melville | 257 | 124,568(0.21%)#30 | 1,204,112(0.02%)#678 |
| 31. | Long Beach | 252 | 124,568(0.20%)#31 | 1,204,112(0.02%)#691 |
| 32. | Elmont | 251 | 124,568(0.20%)#32 | 1,204,112(0.02%)#693 |
| 33. | Schenectady | 248 | 124,568(0.20%)#33 | 1,204,112(0.02%)#700 |
| 34. | Great Neck Plaza | 224 | 124,568(0.18%)#34 | 1,204,112(0.02%)#764 |
| 35. | Irondequoit | 221 | 124,568(0.18%)#35 | 1,204,112(0.02%)#771 |
| 36. | East Meadow | 221 | 124,568(0.18%)#36 | 1,204,112(0.02%)#772 |
| 37. | Eggertsville | 221 | 124,568(0.18%)#37 | 1,204,112(0.02%)#774 |
| 38. | Mamaroneck | 218 | 124,568(0.18%)#38 | 1,204,112(0.02%)#782 |
| 39. | North Lindenhurst | 218 | 124,568(0.18%)#39 | 1,204,112(0.02%)#783 |
| 40. | Airmont | 205 | 124,568(0.16%)#40 | 1,204,112(0.02%)#822 |
| 41. | Wesley Hills | 202 | 124,568(0.16%)#41 | 1,204,112(0.02%)#833 |
| 42. | Westmere | 196 | 124,568(0.16%)#42 | 1,204,112(0.02%)#854 |
| 43. | East Islip | 191 | 124,568(0.15%)#43 | 1,204,112(0.02%)#865 |
| 44. | New Paltz | 184 | 124,568(0.15%)#44 | 1,204,112(0.02%)#895 |
| 45. | Franklin Square | 183 | 124,568(0.15%)#45 | 1,204,112(0.02%)#896 |
| 46. | Roessleville | 183 | 124,568(0.15%)#46 | 1,204,112(0.02%)#899 |
| 47. | Baldwin | 182 | 124,568(0.15%)#47 | 1,204,112(0.02%)#901 |
| 48. | Dix Hills | 181 | 124,568(0.15%)#48 | 1,204,112(0.02%)#907 |
| 49. | Syosset | 176 | 124,568(0.14%)#49 | 1,204,112(0.01%)#925 |
| 50. | Cedarhurst | 175 | 124,568(0.14%)#50 | 1,204,112(0.01%)#928 |
| 51. | Mastic Beach | 174 | 124,568(0.14%)#51 | 1,204,112(0.01%)#930 |
| 52. | Latham | 171 | 124,568(0.14%)#52 | 1,204,112(0.01%)#939 |
| 53. | Shrub Oak | 168 | 124,568(0.13%)#53 | 1,204,112(0.01%)#952 |
| 54. | East Northport | 164 | 124,568(0.13%)#54 | 1,204,112(0.01%)#971 |
| 55. | South Huntington | 163 | 124,568(0.13%)#55 | 1,204,112(0.01%)#983 |
| 56. | Larchmont | 162 | 124,568(0.13%)#56 | 1,204,112(0.01%)#988 |
| 57. | Harrison | 160 | 124,568(0.13%)#57 | 1,204,112(0.01%)#998 |
| 58. | Hicksville | 156 | 124,568(0.13%)#58 | 1,204,112(0.01%)#1,009 |
| 59. | Mount Vernon | 155 | 124,568(0.12%)#59 | 1,204,112(0.01%)#1,012 |
| 60. | Spring Valley | 154 | 124,568(0.12%)#60 | 1,204,112(0.01%)#1,022 |
| 61. | Commack | 151 | 124,568(0.12%)#61 | 1,204,112(0.01%)#1,035 |
| 62. | North New Hyde Park | 149 | 124,568(0.12%)#62 | 1,204,112(0.01%)#1,045 |
| 63. | New Hempstead | 146 | 124,568(0.12%)#63 | 1,204,112(0.01%)#1,061 |
| 64. | North Bellmore | 138 | 124,568(0.11%)#64 | 1,204,112(0.01%)#1,099 |
| 65. | Gates | 138 | 124,568(0.11%)#65 | 1,204,112(0.01%)#1,103 |
| 66. | Rye | 135 | 124,568(0.11%)#66 | 1,204,112(0.01%)#1,123 |
| 67. | West Hills | 134 | 124,568(0.11%)#67 | 1,204,112(0.01%)#1,136 |
| 68. | Bellmore | 133 | 124,568(0.11%)#68 | 1,204,112(0.01%)#1,138 |
| 69. | Plainview | 131 | 124,568(0.11%)#69 | 1,204,112(0.01%)#1,149 |
| 70. | Deer Park | 130 | 124,568(0.10%)#70 | 1,204,112(0.01%)#1,154 |
| 71. | Amityville | 130 | 124,568(0.10%)#71 | 1,204,112(0.01%)#1,156 |
| 72. | Hewlett | 127 | 124,568(0.10%)#72 | 1,204,112(0.01%)#1,181 |
| 73. | East Greenbush | 125 | 124,568(0.10%)#73 | 1,204,112(0.01%)#1,196 |
| 74. | Geneseo | 123 | 124,568(0.10%)#74 | 1,204,112(0.01%)#1,212 |
| 75. | Jericho | 121 | 124,568(0.10%)#75 | 1,204,112(0.01%)#1,223 |
| 76. | Ithaca | 120 | 124,568(0.10%)#76 | 1,204,112(0.01%)#1,235 |
| 77. | Bardonia | 119 | 124,568(0.10%)#77 | 1,204,112(0.01%)#1,240 |
| 78. | Stony Brook | 116 | 124,568(0.09%)#78 | 1,204,112(0.01%)#1,255 |
| 79. | Floral Park | 113 | 124,568(0.09%)#79 | 1,204,112(0.01%)#1,274 |
| 80. | Kings Point | 113 | 124,568(0.09%)#80 | 1,204,112(0.01%)#1,276 |
| 81. | West Islip | 112 | 124,568(0.09%)#81 | 1,204,112(0.01%)#1,281 |
| 82. | Farmingville | 112 | 124,568(0.09%)#82 | 1,204,112(0.01%)#1,283 |
| 83. | Thomaston | 112 | 124,568(0.09%)#83 | 1,204,112(0.01%)#1,288 |
| 84. | Scarsdale | 111 | 124,568(0.09%)#84 | 1,204,112(0.01%)#1,300 |
| 85. | Coram | 109 | 124,568(0.09%)#85 | 1,204,112(0.01%)#1,311 |
| 86. | Beacon | 109 | 124,568(0.09%)#86 | 1,204,112(0.01%)#1,319 |
| 87. | Merrick | 108 | 124,568(0.09%)#87 | 1,204,112(0.01%)#1,326 |
| 88. | Fulton | 108 | 124,568(0.09%)#88 | 1,204,112(0.01%)#1,327 |
| 89. | Southampton | 108 | 124,568(0.09%)#89 | 1,204,112(0.01%)#1,329 |
| 90. | Spackenkill | 108 | 124,568(0.09%)#90 | 1,204,112(0.01%)#1,330 |
| 91. | Miller Place | 106 | 124,568(0.09%)#91 | 1,204,112(0.01%)#1,346 |
| 92. | North Hills | 106 | 124,568(0.09%)#92 | 1,204,112(0.01%)#1,348 |
| 93. | Glen Cove | 103 | 124,568(0.08%)#93 | 1,204,112(0.01%)#1,362 |
| 94. | Valley Cottage | 103 | 124,568(0.08%)#94 | 1,204,112(0.01%)#1,364 |
| 95. | Holbrook | 100 | 124,568(0.08%)#95 | 1,204,112(0.01%)#1,376 |
| 96. | New Square | 100 | 124,568(0.08%)#96 | 1,204,112(0.01%)#1,379 |
| 97. | Niagara Falls | 99 | 124,568(0.08%)#97 | 1,204,112(0.01%)#1,385 |
| 98. | Sleepy Hollow | 99 | 124,568(0.08%)#98 | 1,204,112(0.01%)#1,390 |
| 99. | Kaser | 99 | 124,568(0.08%)#99 | 1,204,112(0.01%)#1,395 |
| 100. | Lawrence | 98 | 124,568(0.08%)#100 | 1,204,112(0.01%)#1,401 |
Common Questions
What are the Top 10 Cities with the Most Immigrants from Western Asia in New York?
Top 10 Cities with the Most Immigrants from Western Asia in New York are:
#1
77,480
#2
2,220
#3
1,550
#4
1,302
#5
1,088
#6
1,044
#7
883
#8
673
#9
641
#10
547
What city has the Most Immigrants from Western Asia in New York?
New York has the Most Immigrants from Western Asia in New York with 77,480.
What is the Total Immigrants from Western Asia in the State of New York?
Total Immigrants from Western Asia in New York is 124,568.
What is the Total Immigrants from Western Asia in the United States?
Total Immigrants from Western Asia in the United States is 1,204,112.