Cities with the Most Immigrants from Western Asia in Iowa
RELATED REPORTS & OPTIONS
Western Asia
Iowa
Compare Cities
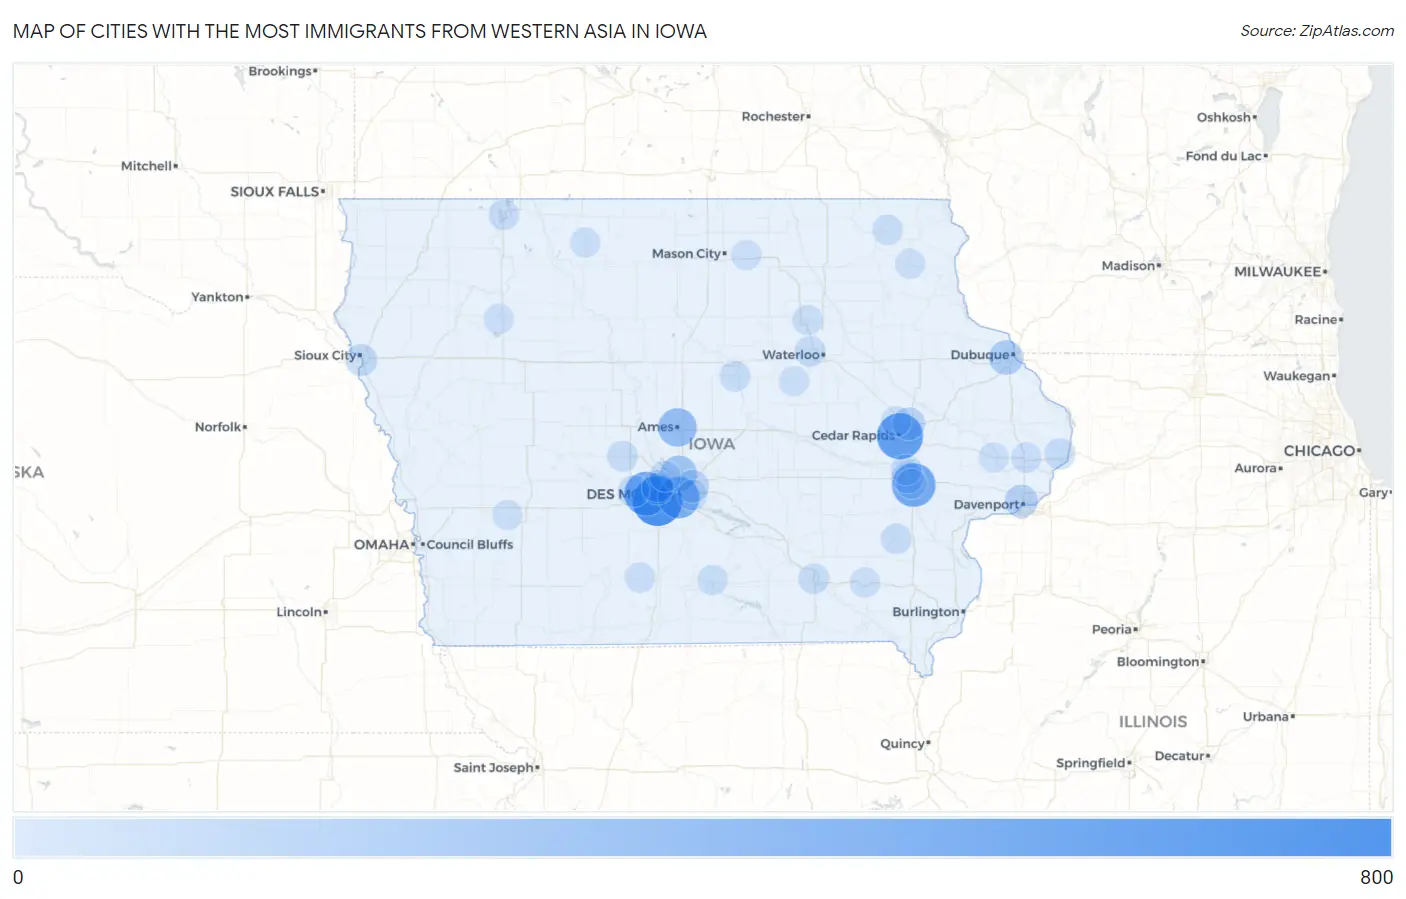
Map of Cities with the Most Immigrants from Western Asia in Iowa
0
800
Cities with the Most Immigrants from Western Asia in Iowa
| City | Western Asia | vs State | vs National | |
| 1. | West Des Moines | 655 | 4,156(15.76%)#1 | 1,204,112(0.05%)#255 |
| 2. | Cedar Rapids | 535 | 4,156(12.87%)#2 | 1,204,112(0.04%)#315 |
| 3. | Waukee | 464 | 4,156(11.16%)#3 | 1,204,112(0.04%)#370 |
| 4. | Iowa City | 453 | 4,156(10.90%)#4 | 1,204,112(0.04%)#381 |
| 5. | Des Moines | 388 | 4,156(9.34%)#5 | 1,204,112(0.03%)#452 |
| 6. | Ames | 277 | 4,156(6.67%)#6 | 1,204,112(0.02%)#626 |
| 7. | Ankeny | 202 | 4,156(4.86%)#7 | 1,204,112(0.02%)#831 |
| 8. | Dubuque | 138 | 4,156(3.32%)#8 | 1,204,112(0.01%)#1,096 |
| 9. | Davenport | 102 | 4,156(2.45%)#9 | 1,204,112(0.01%)#1,365 |
| 10. | Marion | 88 | 4,156(2.12%)#10 | 1,204,112(0.01%)#1,491 |
| 11. | Altoona | 88 | 4,156(2.12%)#11 | 1,204,112(0.01%)#1,494 |
| 12. | Urbandale | 62 | 4,156(1.49%)#12 | 1,204,112(0.01%)#1,843 |
| 13. | Sioux City | 54 | 4,156(1.30%)#13 | 1,204,112(0.00%)#1,971 |
| 14. | Clive | 54 | 4,156(1.30%)#14 | 1,204,112(0.00%)#1,979 |
| 15. | Coralville | 50 | 4,156(1.20%)#15 | 1,204,112(0.00%)#2,056 |
| 16. | Adel | 47 | 4,156(1.13%)#16 | 1,204,112(0.00%)#2,134 |
| 17. | Clinton | 31 | 4,156(0.75%)#17 | 1,204,112(0.00%)#2,552 |
| 18. | Johnston | 27 | 4,156(0.65%)#18 | 1,204,112(0.00%)#2,713 |
| 19. | Perry | 24 | 4,156(0.58%)#19 | 1,204,112(0.00%)#2,872 |
| 20. | North Liberty | 23 | 4,156(0.55%)#20 | 1,204,112(0.00%)#2,912 |
| 21. | Eldora | 22 | 4,156(0.53%)#21 | 1,204,112(0.00%)#3,005 |
| 22. | Ottumwa | 21 | 4,156(0.51%)#22 | 1,204,112(0.00%)#3,020 |
| 23. | Cedar Falls | 19 | 4,156(0.46%)#23 | 1,204,112(0.00%)#3,111 |
| 24. | Washington | 19 | 4,156(0.46%)#24 | 1,204,112(0.00%)#3,146 |
| 25. | Decorah | 16 | 4,156(0.38%)#25 | 1,204,112(0.00%)#3,353 |
| 26. | Pleasant Hill | 15 | 4,156(0.36%)#26 | 1,204,112(0.00%)#3,421 |
| 27. | Dewitt | 15 | 4,156(0.36%)#27 | 1,204,112(0.00%)#3,437 |
| 28. | Okoboji | 13 | 4,156(0.31%)#28 | 1,204,112(0.00%)#3,592 |
| 29. | Hiawatha | 9 | 4,156(0.22%)#29 | 1,204,112(0.00%)#3,926 |
| 30. | Waverly | 8 | 4,156(0.19%)#30 | 1,204,112(0.00%)#4,008 |
| 31. | University Heights | 8 | 4,156(0.19%)#31 | 1,204,112(0.00%)#4,064 |
| 32. | Chariton | 7 | 4,156(0.17%)#32 | 1,204,112(0.00%)#4,131 |
| 33. | Murray | 6 | 4,156(0.14%)#33 | 1,204,112(0.00%)#4,243 |
| 34. | Postville | 4 | 4,156(0.10%)#34 | 1,204,112(0.00%)#4,367 |
| 35. | Nora Springs | 4 | 4,156(0.10%)#35 | 1,204,112(0.00%)#4,382 |
| 36. | Reinbeck | 3 | 4,156(0.07%)#36 | 1,204,112(0.00%)#4,458 |
| 37. | Wheatland | 3 | 4,156(0.07%)#37 | 1,204,112(0.00%)#4,492 |
| 38. | Marne | 2 | 4,156(0.05%)#38 | 1,204,112(0.00%)#4,598 |
| 39. | Fairfield | 1 | 4,156(0.02%)#39 | 1,204,112(0.00%)#4,609 |
| 40. | Fenton | 1 | 4,156(0.02%)#40 | 1,204,112(0.00%)#4,646 |
| 41. | Truesdale | 1 | 4,156(0.02%)#41 | 1,204,112(0.00%)#4,652 |
Common Questions
What are the Top 10 Cities with the Most Immigrants from Western Asia in Iowa?
Top 10 Cities with the Most Immigrants from Western Asia in Iowa are:
#1
655
#2
535
#3
464
#4
453
#5
388
#6
277
#7
202
#8
138
#9
102
#10
88
What city has the Most Immigrants from Western Asia in Iowa?
West Des Moines has the Most Immigrants from Western Asia in Iowa with 655.
What is the Total Immigrants from Western Asia in the State of Iowa?
Total Immigrants from Western Asia in Iowa is 4,156.
What is the Total Immigrants from Western Asia in the United States?
Total Immigrants from Western Asia in the United States is 1,204,112.