Cities with the Most Immigrants from Western Asia in Connecticut
RELATED REPORTS & OPTIONS
Western Asia
Connecticut
Compare Cities
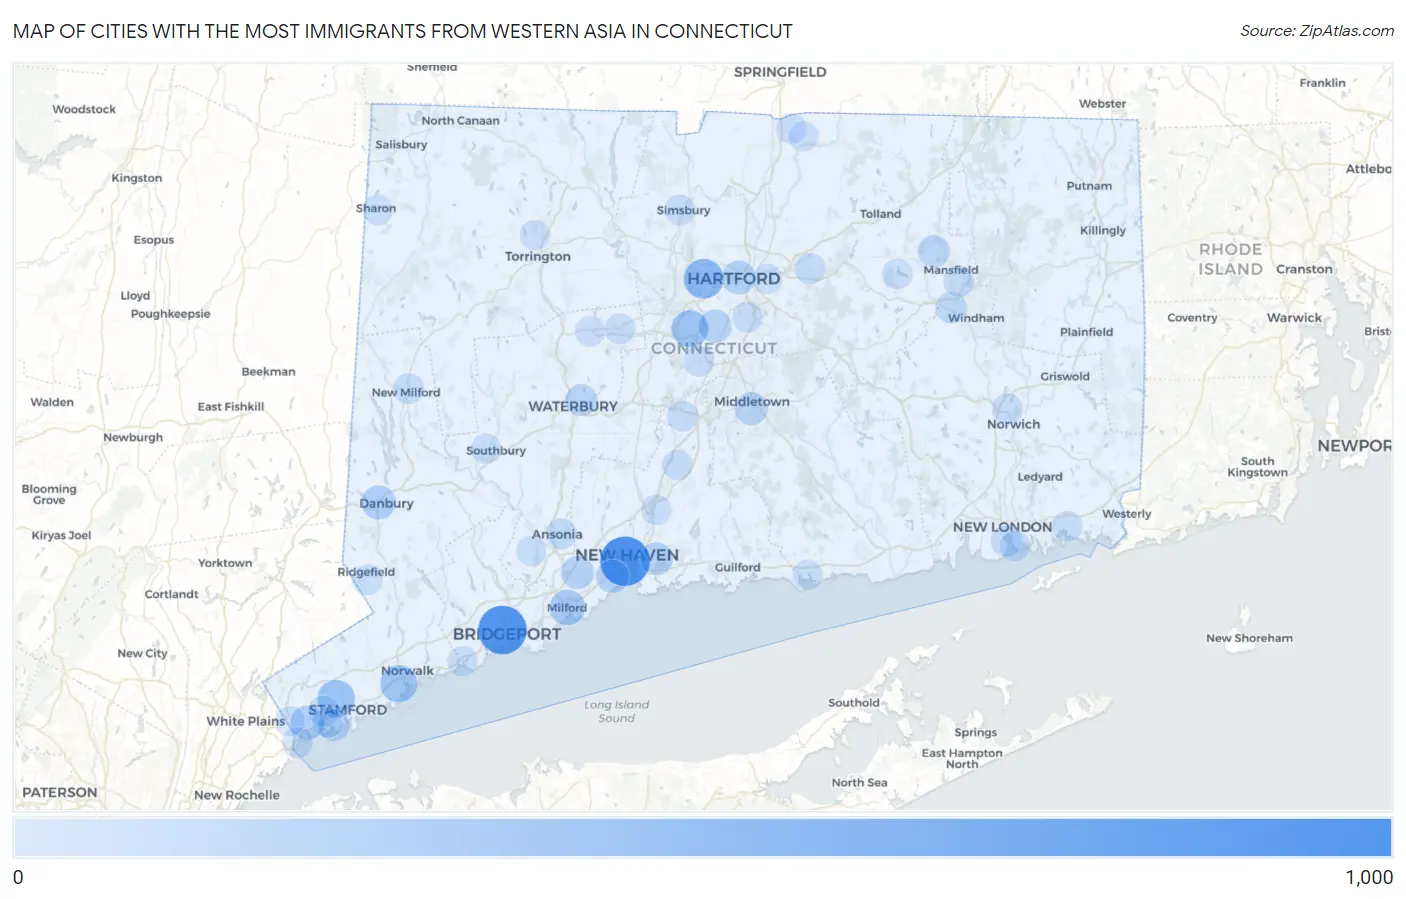
Map of Cities with the Most Immigrants from Western Asia in Connecticut
0
1,000
Cities with the Most Immigrants from Western Asia in Connecticut
| City | Western Asia | vs State | vs National | |
| 1. | New Haven | 890 | 10,185(8.74%)#1 | 1,204,112(0.07%)#170 |
| 2. | Bridgeport | 843 | 10,185(8.28%)#2 | 1,204,112(0.07%)#189 |
| 3. | West Hartford | 429 | 10,185(4.21%)#3 | 1,204,112(0.04%)#405 |
| 4. | Stamford | 331 | 10,185(3.25%)#4 | 1,204,112(0.03%)#526 |
| 5. | New Britain | 306 | 10,185(3.00%)#5 | 1,204,112(0.03%)#563 |
| 6. | Norwalk | 302 | 10,185(2.97%)#6 | 1,204,112(0.03%)#571 |
| 7. | Milford City Balance | 235 | 10,185(2.31%)#7 | 1,204,112(0.02%)#734 |
| 8. | Danbury | 177 | 10,185(1.74%)#8 | 1,204,112(0.01%)#917 |
| 9. | Greenwich | 177 | 10,185(1.74%)#9 | 1,204,112(0.01%)#922 |
| 10. | Hartford | 161 | 10,185(1.58%)#10 | 1,204,112(0.01%)#989 |
| 11. | West Haven | 140 | 10,185(1.37%)#11 | 1,204,112(0.01%)#1,082 |
| 12. | Newington | 140 | 10,185(1.37%)#12 | 1,204,112(0.01%)#1,086 |
| 13. | Orange | 133 | 10,185(1.31%)#13 | 1,204,112(0.01%)#1,140 |
| 14. | East Haven | 129 | 10,185(1.27%)#14 | 1,204,112(0.01%)#1,162 |
| 15. | Middletown | 124 | 10,185(1.22%)#15 | 1,204,112(0.01%)#1,198 |
| 16. | Storrs | 95 | 10,185(0.93%)#16 | 1,204,112(0.01%)#1,420 |
| 17. | Old Greenwich | 90 | 10,185(0.88%)#17 | 1,204,112(0.01%)#1,477 |
| 18. | Waterbury | 85 | 10,185(0.83%)#18 | 1,204,112(0.01%)#1,524 |
| 19. | Northford | 67 | 10,185(0.66%)#19 | 1,204,112(0.01%)#1,758 |
| 20. | Stepney | 62 | 10,185(0.61%)#20 | 1,204,112(0.01%)#1,857 |
| 21. | Willimantic | 58 | 10,185(0.57%)#21 | 1,204,112(0.00%)#1,920 |
| 22. | Coleytown | 56 | 10,185(0.55%)#22 | 1,204,112(0.00%)#1,947 |
| 23. | Naugatuck Borough | 49 | 10,185(0.48%)#23 | 1,204,112(0.00%)#2,075 |
| 24. | New London | 45 | 10,185(0.44%)#24 | 1,204,112(0.00%)#2,165 |
| 25. | South Wilton | 42 | 10,185(0.41%)#25 | 1,204,112(0.00%)#2,252 |
| 26. | Manchester | 39 | 10,185(0.38%)#26 | 1,204,112(0.00%)#2,309 |
| 27. | Ansonia | 39 | 10,185(0.38%)#27 | 1,204,112(0.00%)#2,313 |
| 28. | Meriden | 37 | 10,185(0.36%)#28 | 1,204,112(0.00%)#2,356 |
| 29. | Cos Cob | 35 | 10,185(0.34%)#29 | 1,204,112(0.00%)#2,430 |
| 30. | Mansfield Center | 34 | 10,185(0.33%)#30 | 1,204,112(0.00%)#2,468 |
| 31. | Kensington | 33 | 10,185(0.32%)#31 | 1,204,112(0.00%)#2,498 |
| 32. | Byram | 31 | 10,185(0.30%)#32 | 1,204,112(0.00%)#2,569 |
| 33. | Norwich | 30 | 10,185(0.29%)#33 | 1,204,112(0.00%)#2,582 |
| 34. | Simsbury Center | 30 | 10,185(0.29%)#34 | 1,204,112(0.00%)#2,601 |
| 35. | New Milford | 29 | 10,185(0.28%)#35 | 1,204,112(0.00%)#2,642 |
| 36. | Trumbull Center | 28 | 10,185(0.27%)#36 | 1,204,112(0.00%)#2,684 |
| 37. | Wallingford Center | 27 | 10,185(0.27%)#37 | 1,204,112(0.00%)#2,719 |
| 38. | Bristol | 24 | 10,185(0.24%)#38 | 1,204,112(0.00%)#2,851 |
| 39. | Groton | 24 | 10,185(0.24%)#39 | 1,204,112(0.00%)#2,867 |
| 40. | Wethersfield | 23 | 10,185(0.23%)#40 | 1,204,112(0.00%)#2,904 |
| 41. | Riverside | 22 | 10,185(0.22%)#41 | 1,204,112(0.00%)#2,982 |
| 42. | Greens Farms | 22 | 10,185(0.22%)#42 | 1,204,112(0.00%)#3,002 |
| 43. | Sandy Hook | 21 | 10,185(0.21%)#43 | 1,204,112(0.00%)#3,035 |
| 44. | North Haven | 19 | 10,185(0.19%)#44 | 1,204,112(0.00%)#3,119 |
| 45. | Ridgefield | 19 | 10,185(0.19%)#45 | 1,204,112(0.00%)#3,145 |
| 46. | Terryville | 17 | 10,185(0.17%)#46 | 1,204,112(0.00%)#3,285 |
| 47. | Clinton | 17 | 10,185(0.17%)#47 | 1,204,112(0.00%)#3,296 |
| 48. | Coventry Lake | 17 | 10,185(0.17%)#48 | 1,204,112(0.00%)#3,301 |
| 49. | Indian Field | 16 | 10,185(0.16%)#49 | 1,204,112(0.00%)#3,390 |
| 50. | Staples | 14 | 10,185(0.14%)#50 | 1,204,112(0.00%)#3,507 |
| 51. | Noroton Heights | 14 | 10,185(0.14%)#51 | 1,204,112(0.00%)#3,525 |
| 52. | Sherwood Manor | 13 | 10,185(0.13%)#52 | 1,204,112(0.00%)#3,567 |
| 53. | Noroton | 13 | 10,185(0.13%)#53 | 1,204,112(0.00%)#3,568 |
| 54. | Taylor Corners | 13 | 10,185(0.13%)#54 | 1,204,112(0.00%)#3,596 |
| 55. | New Canaan | 12 | 10,185(0.12%)#55 | 1,204,112(0.00%)#3,643 |
| 56. | Heritage Village | 12 | 10,185(0.12%)#56 | 1,204,112(0.00%)#3,657 |
| 57. | Mechanicsville | 12 | 10,185(0.12%)#57 | 1,204,112(0.00%)#3,692 |
| 58. | Glenville | 10 | 10,185(0.10%)#58 | 1,204,112(0.00%)#3,846 |
| 59. | Southport | 10 | 10,185(0.10%)#59 | 1,204,112(0.00%)#3,872 |
| 60. | Shelton | 9 | 10,185(0.09%)#60 | 1,204,112(0.00%)#3,888 |
| 61. | Mystic | 8 | 10,185(0.08%)#61 | 1,204,112(0.00%)#4,036 |
| 62. | Compo | 8 | 10,185(0.08%)#62 | 1,204,112(0.00%)#4,041 |
| 63. | Torrington | 7 | 10,185(0.07%)#63 | 1,204,112(0.00%)#4,083 |
| 64. | East Hartford | 6 | 10,185(0.06%)#64 | 1,204,112(0.00%)#4,162 |
| 65. | Hazardville | 5 | 10,185(0.05%)#65 | 1,204,112(0.00%)#4,279 |
| 66. | Sharon | 5 | 10,185(0.05%)#66 | 1,204,112(0.00%)#4,340 |
| 67. | Stonington Borough | 3 | 10,185(0.03%)#67 | 1,204,112(0.00%)#4,489 |
| 68. | Sacred Heart University | 2 | 10,185(0.02%)#68 | 1,204,112(0.00%)#4,548 |
1
2Common Questions
What are the Top 10 Cities with the Most Immigrants from Western Asia in Connecticut?
Top 10 Cities with the Most Immigrants from Western Asia in Connecticut are:
#1
890
#2
843
#3
429
#4
331
#5
306
#6
302
#7
235
#8
177
#9
177
#10
161
What city has the Most Immigrants from Western Asia in Connecticut?
New Haven has the Most Immigrants from Western Asia in Connecticut with 890.
What is the Total Immigrants from Western Asia in the State of Connecticut?
Total Immigrants from Western Asia in Connecticut is 10,185.
What is the Total Immigrants from Western Asia in the United States?
Total Immigrants from Western Asia in the United States is 1,204,112.