Cities with the Most Immigrants from Western Asia in Wisconsin
RELATED REPORTS & OPTIONS
Western Asia
Wisconsin
Compare Cities
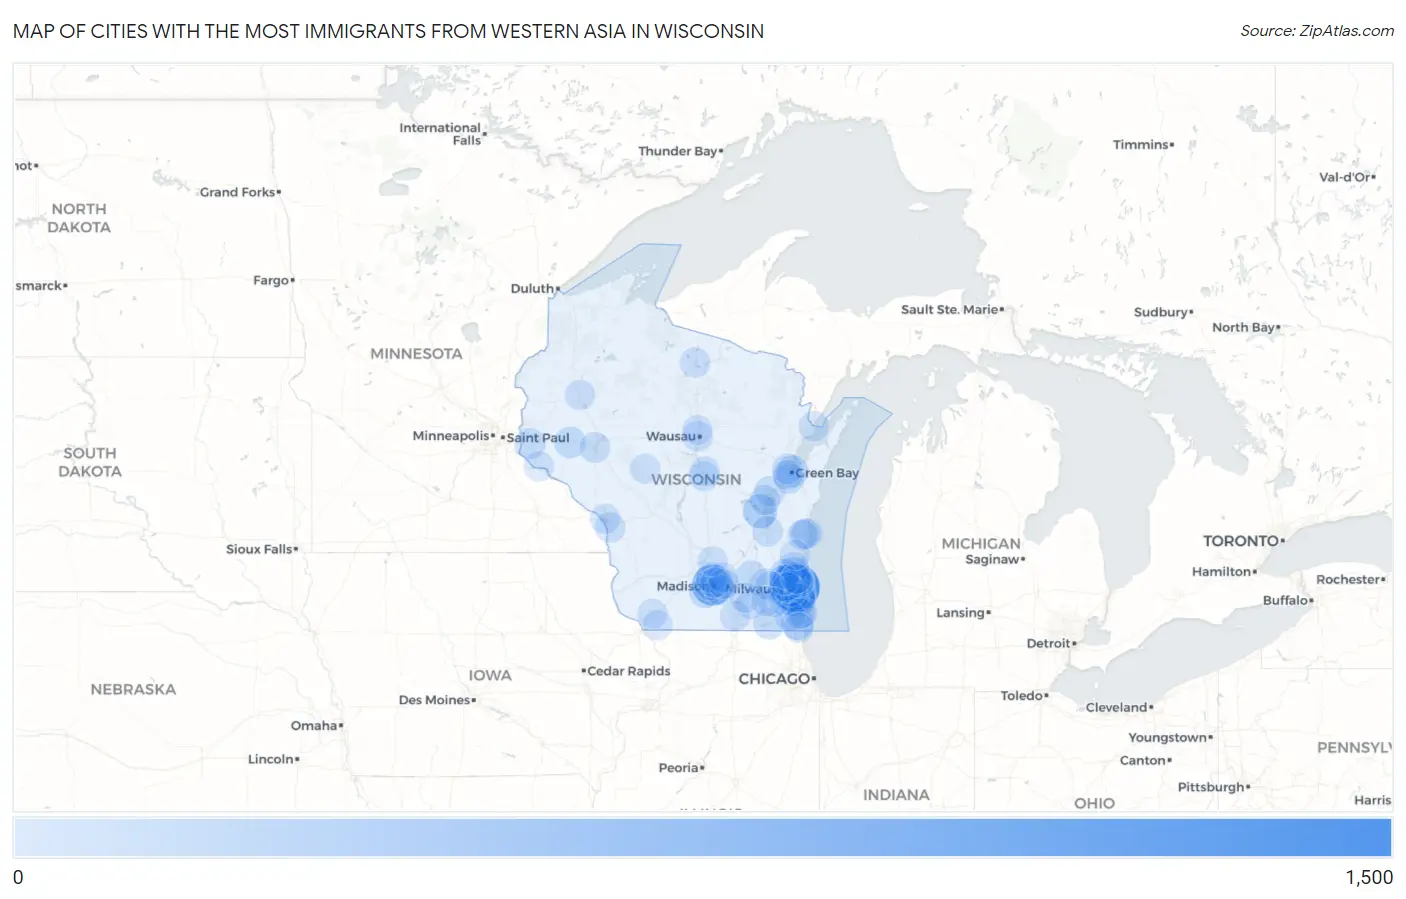
Map of Cities with the Most Immigrants from Western Asia in Wisconsin
0
1,500
Cities with the Most Immigrants from Western Asia in Wisconsin
| City | Western Asia | vs State | vs National | |
| 1. | Milwaukee | 1,436 | 6,392(22.47%)#1 | 1,204,112(0.12%)#91 |
| 2. | Madison | 778 | 6,392(12.17%)#2 | 1,204,112(0.06%)#204 |
| 3. | Greenfield | 297 | 6,392(4.65%)#3 | 1,204,112(0.02%)#581 |
| 4. | Oshkosh | 284 | 6,392(4.44%)#4 | 1,204,112(0.02%)#610 |
| 5. | Oak Creek | 265 | 6,392(4.15%)#5 | 1,204,112(0.02%)#656 |
| 6. | Brown Deer | 235 | 6,392(3.68%)#6 | 1,204,112(0.02%)#736 |
| 7. | Mequon | 211 | 6,392(3.30%)#7 | 1,204,112(0.02%)#807 |
| 8. | Glendale | 179 | 6,392(2.80%)#8 | 1,204,112(0.01%)#911 |
| 9. | Kenosha | 161 | 6,392(2.52%)#9 | 1,204,112(0.01%)#990 |
| 10. | Green Bay | 133 | 6,392(2.08%)#10 | 1,204,112(0.01%)#1,137 |
| 11. | Cudahy | 123 | 6,392(1.92%)#11 | 1,204,112(0.01%)#1,208 |
| 12. | Wauwatosa | 118 | 6,392(1.85%)#12 | 1,204,112(0.01%)#1,241 |
| 13. | Franklin | 99 | 6,392(1.55%)#13 | 1,204,112(0.01%)#1,386 |
| 14. | Verona | 99 | 6,392(1.55%)#14 | 1,204,112(0.01%)#1,389 |
| 15. | Menomonie | 90 | 6,392(1.41%)#15 | 1,204,112(0.01%)#1,474 |
| 16. | Shorewood | 88 | 6,392(1.38%)#16 | 1,204,112(0.01%)#1,496 |
| 17. | Brookfield | 83 | 6,392(1.30%)#17 | 1,204,112(0.01%)#1,545 |
| 18. | Watertown | 76 | 6,392(1.19%)#18 | 1,204,112(0.01%)#1,638 |
| 19. | St Francis | 74 | 6,392(1.16%)#19 | 1,204,112(0.01%)#1,666 |
| 20. | Lake Geneva | 63 | 6,392(0.99%)#20 | 1,204,112(0.01%)#1,833 |
| 21. | Muskego | 61 | 6,392(0.95%)#21 | 1,204,112(0.01%)#1,862 |
| 22. | River Falls | 60 | 6,392(0.94%)#22 | 1,204,112(0.00%)#1,884 |
| 23. | Appleton | 57 | 6,392(0.89%)#23 | 1,204,112(0.00%)#1,928 |
| 24. | Greendale | 54 | 6,392(0.84%)#24 | 1,204,112(0.00%)#1,982 |
| 25. | Sheboygan | 53 | 6,392(0.83%)#25 | 1,204,112(0.00%)#1,992 |
| 26. | De Pere | 45 | 6,392(0.70%)#26 | 1,204,112(0.00%)#2,166 |
| 27. | Bayside | 45 | 6,392(0.70%)#27 | 1,204,112(0.00%)#2,186 |
| 28. | Eau Claire | 40 | 6,392(0.63%)#28 | 1,204,112(0.00%)#2,277 |
| 29. | South Milwaukee | 40 | 6,392(0.63%)#29 | 1,204,112(0.00%)#2,288 |
| 30. | Fond Du Lac | 38 | 6,392(0.59%)#30 | 1,204,112(0.00%)#2,331 |
| 31. | Mount Pleasant | 37 | 6,392(0.58%)#31 | 1,204,112(0.00%)#2,362 |
| 32. | Howard | 37 | 6,392(0.58%)#32 | 1,204,112(0.00%)#2,365 |
| 33. | Shorewood Hills | 35 | 6,392(0.55%)#33 | 1,204,112(0.00%)#2,435 |
| 34. | Neenah | 32 | 6,392(0.50%)#34 | 1,204,112(0.00%)#2,520 |
| 35. | Waunakee | 32 | 6,392(0.50%)#35 | 1,204,112(0.00%)#2,528 |
| 36. | La Crosse | 30 | 6,392(0.47%)#36 | 1,204,112(0.00%)#2,580 |
| 37. | Whitewater | 29 | 6,392(0.45%)#37 | 1,204,112(0.00%)#2,625 |
| 38. | Menomonee Falls | 27 | 6,392(0.42%)#38 | 1,204,112(0.00%)#2,706 |
| 39. | Cedarburg | 27 | 6,392(0.42%)#39 | 1,204,112(0.00%)#2,726 |
| 40. | Minocqua | 27 | 6,392(0.42%)#40 | 1,204,112(0.00%)#2,753 |
| 41. | Marinette | 25 | 6,392(0.39%)#41 | 1,204,112(0.00%)#2,821 |
| 42. | Janesville | 24 | 6,392(0.38%)#42 | 1,204,112(0.00%)#2,849 |
| 43. | Wausau | 24 | 6,392(0.38%)#43 | 1,204,112(0.00%)#2,852 |
| 44. | Oconomowoc | 24 | 6,392(0.38%)#44 | 1,204,112(0.00%)#2,859 |
| 45. | Kohler | 23 | 6,392(0.36%)#45 | 1,204,112(0.00%)#2,946 |
| 46. | Mcfarland | 22 | 6,392(0.34%)#46 | 1,204,112(0.00%)#2,981 |
| 47. | Sun Prairie | 20 | 6,392(0.31%)#47 | 1,204,112(0.00%)#3,058 |
| 48. | Whitefish Bay | 19 | 6,392(0.30%)#48 | 1,204,112(0.00%)#3,131 |
| 49. | West Allis | 18 | 6,392(0.28%)#49 | 1,204,112(0.00%)#3,173 |
| 50. | Fort Atkinson | 18 | 6,392(0.28%)#50 | 1,204,112(0.00%)#3,195 |
| 51. | Cottage Grove | 18 | 6,392(0.28%)#51 | 1,204,112(0.00%)#3,204 |
| 52. | Fox Point | 18 | 6,392(0.28%)#52 | 1,204,112(0.00%)#3,205 |
| 53. | Germantown | 17 | 6,392(0.27%)#53 | 1,204,112(0.00%)#3,256 |
| 54. | Racine | 14 | 6,392(0.22%)#54 | 1,204,112(0.00%)#3,466 |
| 55. | Plover | 14 | 6,392(0.22%)#55 | 1,204,112(0.00%)#3,488 |
| 56. | Rice Lake | 13 | 6,392(0.20%)#56 | 1,204,112(0.00%)#3,558 |
| 57. | Union Grove | 13 | 6,392(0.20%)#57 | 1,204,112(0.00%)#3,571 |
| 58. | Sheboygan Falls | 11 | 6,392(0.17%)#58 | 1,204,112(0.00%)#3,733 |
| 59. | Brice Prairie | 10 | 6,392(0.16%)#59 | 1,204,112(0.00%)#3,859 |
| 60. | Lannon | 9 | 6,392(0.14%)#60 | 1,204,112(0.00%)#3,970 |
| 61. | Delafield | 8 | 6,392(0.13%)#61 | 1,204,112(0.00%)#4,025 |
| 62. | Benton | 8 | 6,392(0.13%)#62 | 1,204,112(0.00%)#4,072 |
| 63. | Ashwaubenon | 7 | 6,392(0.11%)#63 | 1,204,112(0.00%)#4,096 |
| 64. | Mukwonago | 7 | 6,392(0.11%)#64 | 1,204,112(0.00%)#4,111 |
| 65. | Platteville | 6 | 6,392(0.09%)#65 | 1,204,112(0.00%)#4,188 |
| 66. | Eagle | 6 | 6,392(0.09%)#66 | 1,204,112(0.00%)#4,226 |
| 67. | Elm Grove | 5 | 6,392(0.08%)#67 | 1,204,112(0.00%)#4,278 |
| 68. | Poynette | 5 | 6,392(0.08%)#68 | 1,204,112(0.00%)#4,304 |
| 69. | Fredonia | 5 | 6,392(0.08%)#69 | 1,204,112(0.00%)#4,309 |
| 70. | Neillsville | 5 | 6,392(0.08%)#70 | 1,204,112(0.00%)#4,311 |
| 71. | Stevens Point | 3 | 6,392(0.05%)#71 | 1,204,112(0.00%)#4,426 |
| 72. | River Hills | 3 | 6,392(0.05%)#72 | 1,204,112(0.00%)#4,466 |
| 73. | Pleasant Prairie | 2 | 6,392(0.03%)#73 | 1,204,112(0.00%)#4,514 |
| 74. | Maine | 2 | 6,392(0.03%)#74 | 1,204,112(0.00%)#4,529 |
| 75. | Maple Bluff | 2 | 6,392(0.03%)#75 | 1,204,112(0.00%)#4,546 |
| 76. | Bay City | 2 | 6,392(0.03%)#76 | 1,204,112(0.00%)#4,584 |
Common Questions
What are the Top 10 Cities with the Most Immigrants from Western Asia in Wisconsin?
Top 10 Cities with the Most Immigrants from Western Asia in Wisconsin are:
#1
1,436
#2
778
#3
297
#4
284
#5
265
#6
235
#7
211
#8
179
#9
161
#10
133
What city has the Most Immigrants from Western Asia in Wisconsin?
Milwaukee has the Most Immigrants from Western Asia in Wisconsin with 1,436.
What is the Total Immigrants from Western Asia in the State of Wisconsin?
Total Immigrants from Western Asia in Wisconsin is 6,392.
What is the Total Immigrants from Western Asia in the United States?
Total Immigrants from Western Asia in the United States is 1,204,112.