Cities with the Most Immigrants from Western Asia in Washington
RELATED REPORTS & OPTIONS
Western Asia
Washington
Compare Cities
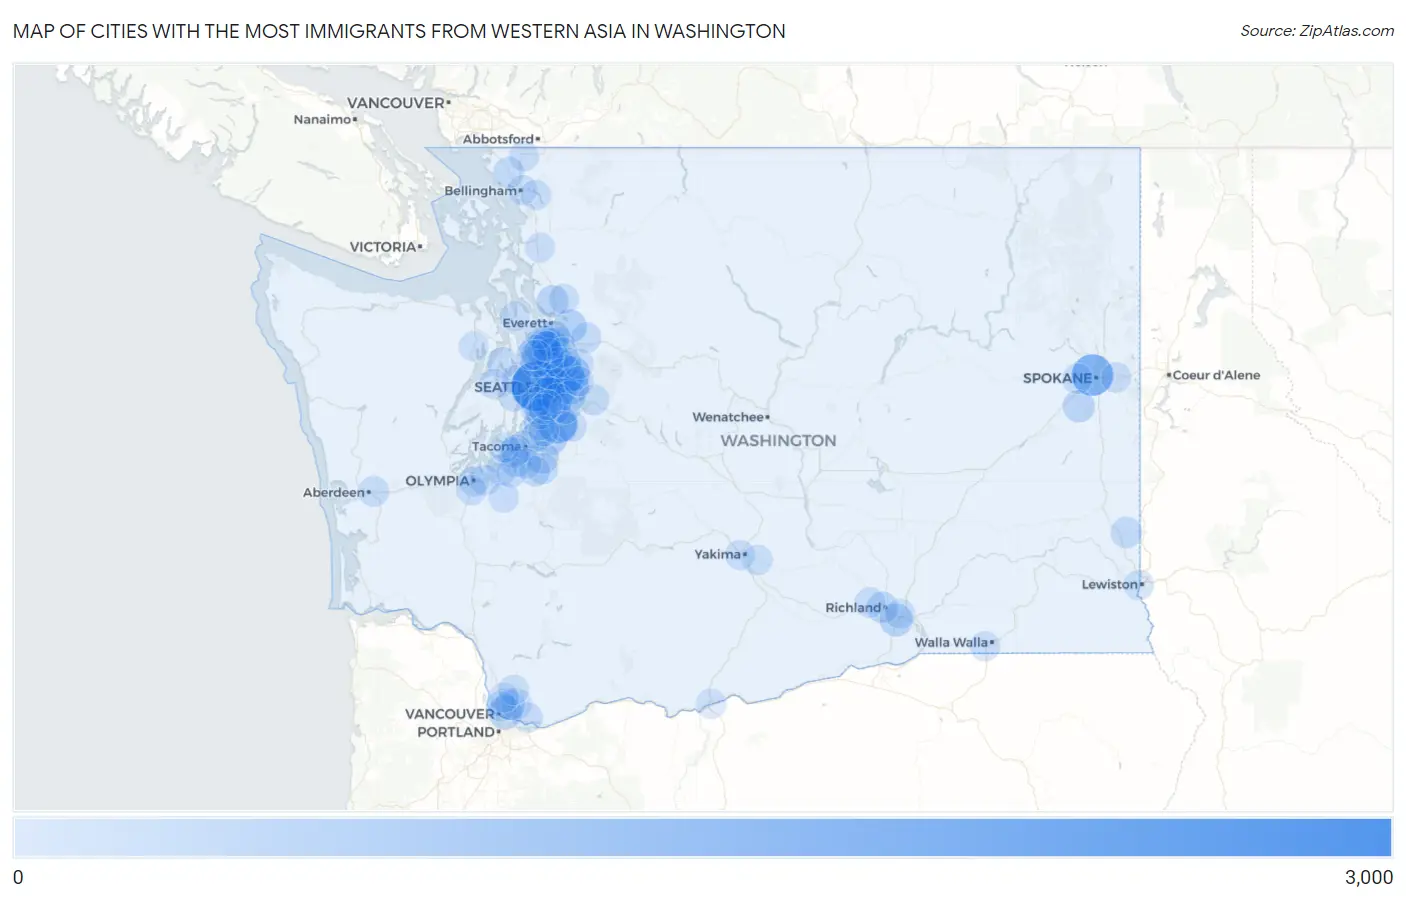
Map of Cities with the Most Immigrants from Western Asia in Washington
0
3,000
Cities with the Most Immigrants from Western Asia in Washington
| City | Western Asia | vs State | vs National | |
| 1. | Seattle | 2,872 | 23,576(12.18%)#1 | 1,204,112(0.24%)#38 |
| 2. | Spokane | 1,650 | 23,576(7.00%)#2 | 1,204,112(0.14%)#74 |
| 3. | Redmond | 1,443 | 23,576(6.12%)#3 | 1,204,112(0.12%)#90 |
| 4. | Kent | 1,319 | 23,576(5.59%)#4 | 1,204,112(0.11%)#99 |
| 5. | Kirkland | 929 | 23,576(3.94%)#5 | 1,204,112(0.08%)#165 |
| 6. | Bellevue | 910 | 23,576(3.86%)#6 | 1,204,112(0.08%)#169 |
| 7. | Sammamish | 784 | 23,576(3.33%)#7 | 1,204,112(0.07%)#202 |
| 8. | Union Hill Novelty Hill | 709 | 23,576(3.01%)#8 | 1,204,112(0.06%)#227 |
| 9. | Renton | 544 | 23,576(2.31%)#9 | 1,204,112(0.05%)#310 |
| 10. | Vancouver | 538 | 23,576(2.28%)#10 | 1,204,112(0.04%)#312 |
| 11. | Everett | 467 | 23,576(1.98%)#11 | 1,204,112(0.04%)#365 |
| 12. | Alderwood Manor | 441 | 23,576(1.87%)#12 | 1,204,112(0.04%)#388 |
| 13. | Kennewick | 435 | 23,576(1.85%)#13 | 1,204,112(0.04%)#393 |
| 14. | Lynnwood | 359 | 23,576(1.52%)#14 | 1,204,112(0.03%)#488 |
| 15. | Auburn | 353 | 23,576(1.50%)#15 | 1,204,112(0.03%)#494 |
| 16. | Des Moines | 335 | 23,576(1.42%)#16 | 1,204,112(0.03%)#519 |
| 17. | Bothell | 311 | 23,576(1.32%)#17 | 1,204,112(0.03%)#557 |
| 18. | Kenmore | 304 | 23,576(1.29%)#18 | 1,204,112(0.03%)#567 |
| 19. | Marysville | 296 | 23,576(1.26%)#19 | 1,204,112(0.02%)#582 |
| 20. | Shoreline | 292 | 23,576(1.24%)#20 | 1,204,112(0.02%)#589 |
| 21. | Cheney | 291 | 23,576(1.23%)#21 | 1,204,112(0.02%)#594 |
| 22. | Puyallup | 286 | 23,576(1.21%)#22 | 1,204,112(0.02%)#605 |
| 23. | Martha Lake | 279 | 23,576(1.18%)#23 | 1,204,112(0.02%)#621 |
| 24. | Mercer Island | 259 | 23,576(1.10%)#24 | 1,204,112(0.02%)#672 |
| 25. | Richland | 243 | 23,576(1.03%)#25 | 1,204,112(0.02%)#717 |
| 26. | Pullman | 208 | 23,576(0.88%)#26 | 1,204,112(0.02%)#810 |
| 27. | Issaquah | 184 | 23,576(0.78%)#27 | 1,204,112(0.02%)#893 |
| 28. | Mill Creek East | 183 | 23,576(0.78%)#28 | 1,204,112(0.02%)#897 |
| 29. | Lakewood | 170 | 23,576(0.72%)#29 | 1,204,112(0.01%)#941 |
| 30. | Silver Firs | 166 | 23,576(0.70%)#30 | 1,204,112(0.01%)#960 |
| 31. | Lake Stickney | 164 | 23,576(0.70%)#31 | 1,204,112(0.01%)#973 |
| 32. | South Hill | 154 | 23,576(0.65%)#32 | 1,204,112(0.01%)#1,019 |
| 33. | Tacoma | 147 | 23,576(0.62%)#33 | 1,204,112(0.01%)#1,051 |
| 34. | Burien | 144 | 23,576(0.61%)#34 | 1,204,112(0.01%)#1,070 |
| 35. | Mill Creek | 142 | 23,576(0.60%)#35 | 1,204,112(0.01%)#1,078 |
| 36. | Federal Way | 134 | 23,576(0.57%)#36 | 1,204,112(0.01%)#1,130 |
| 37. | North Lynnwood | 131 | 23,576(0.56%)#37 | 1,204,112(0.01%)#1,150 |
| 38. | Dupont | 128 | 23,576(0.54%)#38 | 1,204,112(0.01%)#1,173 |
| 39. | Seatac | 127 | 23,576(0.54%)#39 | 1,204,112(0.01%)#1,177 |
| 40. | Ferndale | 126 | 23,576(0.53%)#40 | 1,204,112(0.01%)#1,187 |
| 41. | Snoqualmie | 126 | 23,576(0.53%)#41 | 1,204,112(0.01%)#1,188 |
| 42. | Maple Valley | 118 | 23,576(0.50%)#42 | 1,204,112(0.01%)#1,242 |
| 43. | Cottage Lake | 114 | 23,576(0.48%)#43 | 1,204,112(0.01%)#1,267 |
| 44. | Orchards | 113 | 23,576(0.48%)#44 | 1,204,112(0.01%)#1,271 |
| 45. | White Center | 112 | 23,576(0.48%)#45 | 1,204,112(0.01%)#1,285 |
| 46. | Eastmont | 111 | 23,576(0.47%)#46 | 1,204,112(0.01%)#1,297 |
| 47. | Aberdeen | 109 | 23,576(0.46%)#47 | 1,204,112(0.01%)#1,315 |
| 48. | Poulsbo | 105 | 23,576(0.45%)#48 | 1,204,112(0.01%)#1,351 |
| 49. | Fircrest | 105 | 23,576(0.45%)#49 | 1,204,112(0.01%)#1,353 |
| 50. | Woodinville | 98 | 23,576(0.42%)#50 | 1,204,112(0.01%)#1,400 |
| 51. | Airway Heights | 91 | 23,576(0.39%)#51 | 1,204,112(0.01%)#1,460 |
| 52. | Hazel Dell | 90 | 23,576(0.38%)#52 | 1,204,112(0.01%)#1,472 |
| 53. | Lacey | 88 | 23,576(0.37%)#53 | 1,204,112(0.01%)#1,488 |
| 54. | West Richland | 87 | 23,576(0.37%)#54 | 1,204,112(0.01%)#1,505 |
| 55. | Manchester | 84 | 23,576(0.36%)#55 | 1,204,112(0.01%)#1,540 |
| 56. | Olympia | 82 | 23,576(0.35%)#56 | 1,204,112(0.01%)#1,553 |
| 57. | Newcastle | 82 | 23,576(0.35%)#57 | 1,204,112(0.01%)#1,559 |
| 58. | Frederickson | 80 | 23,576(0.34%)#58 | 1,204,112(0.01%)#1,587 |
| 59. | Covington | 79 | 23,576(0.34%)#59 | 1,204,112(0.01%)#1,594 |
| 60. | Fairwood Cdp King County | 79 | 23,576(0.34%)#60 | 1,204,112(0.01%)#1,595 |
| 61. | University Place | 77 | 23,576(0.33%)#61 | 1,204,112(0.01%)#1,623 |
| 62. | Woods Creek | 74 | 23,576(0.31%)#62 | 1,204,112(0.01%)#1,668 |
| 63. | Camas | 73 | 23,576(0.31%)#63 | 1,204,112(0.01%)#1,672 |
| 64. | Edmonds | 68 | 23,576(0.29%)#64 | 1,204,112(0.01%)#1,734 |
| 65. | Moxee | 64 | 23,576(0.27%)#65 | 1,204,112(0.01%)#1,818 |
| 66. | Spokane Valley | 62 | 23,576(0.26%)#66 | 1,204,112(0.01%)#1,840 |
| 67. | Five Corners | 60 | 23,576(0.25%)#67 | 1,204,112(0.00%)#1,882 |
| 68. | Battle Ground | 51 | 23,576(0.22%)#68 | 1,204,112(0.00%)#2,039 |
| 69. | Yelm | 49 | 23,576(0.21%)#69 | 1,204,112(0.00%)#2,083 |
| 70. | Lynden | 47 | 23,576(0.20%)#70 | 1,204,112(0.00%)#2,127 |
| 71. | Chico | 47 | 23,576(0.20%)#71 | 1,204,112(0.00%)#2,140 |
| 72. | Clarkston | 46 | 23,576(0.20%)#72 | 1,204,112(0.00%)#2,159 |
| 73. | Tukwila | 45 | 23,576(0.19%)#73 | 1,204,112(0.00%)#2,168 |
| 74. | Tumwater | 43 | 23,576(0.18%)#74 | 1,204,112(0.00%)#2,215 |
| 75. | Bainbridge Island | 37 | 23,576(0.16%)#75 | 1,204,112(0.00%)#2,364 |
| 76. | Duvall | 35 | 23,576(0.15%)#76 | 1,204,112(0.00%)#2,427 |
| 77. | Sudden Valley | 34 | 23,576(0.14%)#77 | 1,204,112(0.00%)#2,458 |
| 78. | Maltby | 33 | 23,576(0.14%)#78 | 1,204,112(0.00%)#2,496 |
| 79. | Bothell West | 32 | 23,576(0.14%)#79 | 1,204,112(0.00%)#2,524 |
| 80. | Lakeland North | 32 | 23,576(0.14%)#80 | 1,204,112(0.00%)#2,527 |
| 81. | Sisco Heights | 28 | 23,576(0.12%)#81 | 1,204,112(0.00%)#2,698 |
| 82. | East Renton Highlands | 27 | 23,576(0.11%)#82 | 1,204,112(0.00%)#2,727 |
| 83. | Freeland | 27 | 23,576(0.11%)#83 | 1,204,112(0.00%)#2,749 |
| 84. | Fort Lewis | 26 | 23,576(0.11%)#84 | 1,204,112(0.00%)#2,773 |
| 85. | Woodway | 26 | 23,576(0.11%)#85 | 1,204,112(0.00%)#2,802 |
| 86. | Mukilteo | 25 | 23,576(0.11%)#86 | 1,204,112(0.00%)#2,811 |
| 87. | Yakima | 24 | 23,576(0.10%)#87 | 1,204,112(0.00%)#2,846 |
| 88. | College Place | 24 | 23,576(0.10%)#88 | 1,204,112(0.00%)#2,866 |
| 89. | Larch Way | 24 | 23,576(0.10%)#89 | 1,204,112(0.00%)#2,884 |
| 90. | Mount Vista | 23 | 23,576(0.10%)#90 | 1,204,112(0.00%)#2,921 |
| 91. | Maryhill | 23 | 23,576(0.10%)#91 | 1,204,112(0.00%)#2,954 |
| 92. | Pasco | 21 | 23,576(0.09%)#92 | 1,204,112(0.00%)#3,011 |
| 93. | Esperance | 21 | 23,576(0.09%)#93 | 1,204,112(0.00%)#3,047 |
| 94. | Fox Island | 20 | 23,576(0.08%)#94 | 1,204,112(0.00%)#3,095 |
| 95. | Bryn Mawr Skyway | 18 | 23,576(0.08%)#95 | 1,204,112(0.00%)#3,185 |
| 96. | Ames Lake | 18 | 23,576(0.08%)#96 | 1,204,112(0.00%)#3,238 |
| 97. | Quilcene | 18 | 23,576(0.08%)#97 | 1,204,112(0.00%)#3,243 |
| 98. | Bellingham | 17 | 23,576(0.07%)#98 | 1,204,112(0.00%)#3,245 |
| 99. | Parkland | 17 | 23,576(0.07%)#99 | 1,204,112(0.00%)#3,247 |
| 100. | Mount Vernon | 17 | 23,576(0.07%)#100 | 1,204,112(0.00%)#3,248 |
Common Questions
What are the Top 10 Cities with the Most Immigrants from Western Asia in Washington?
Top 10 Cities with the Most Immigrants from Western Asia in Washington are:
What city has the Most Immigrants from Western Asia in Washington?
Seattle has the Most Immigrants from Western Asia in Washington with 2,872.
What is the Total Immigrants from Western Asia in the State of Washington?
Total Immigrants from Western Asia in Washington is 23,576.
What is the Total Immigrants from Western Asia in the United States?
Total Immigrants from Western Asia in the United States is 1,204,112.